
COVID-19 Modeling and the Crop Cycle
COVID-19 Modeling and the Crop Cycle
Prepared May/June 2020 by the Data, Monitoring, and Analytics Team at USAID/RFS
22 June 2020, 15:04:06 MDT
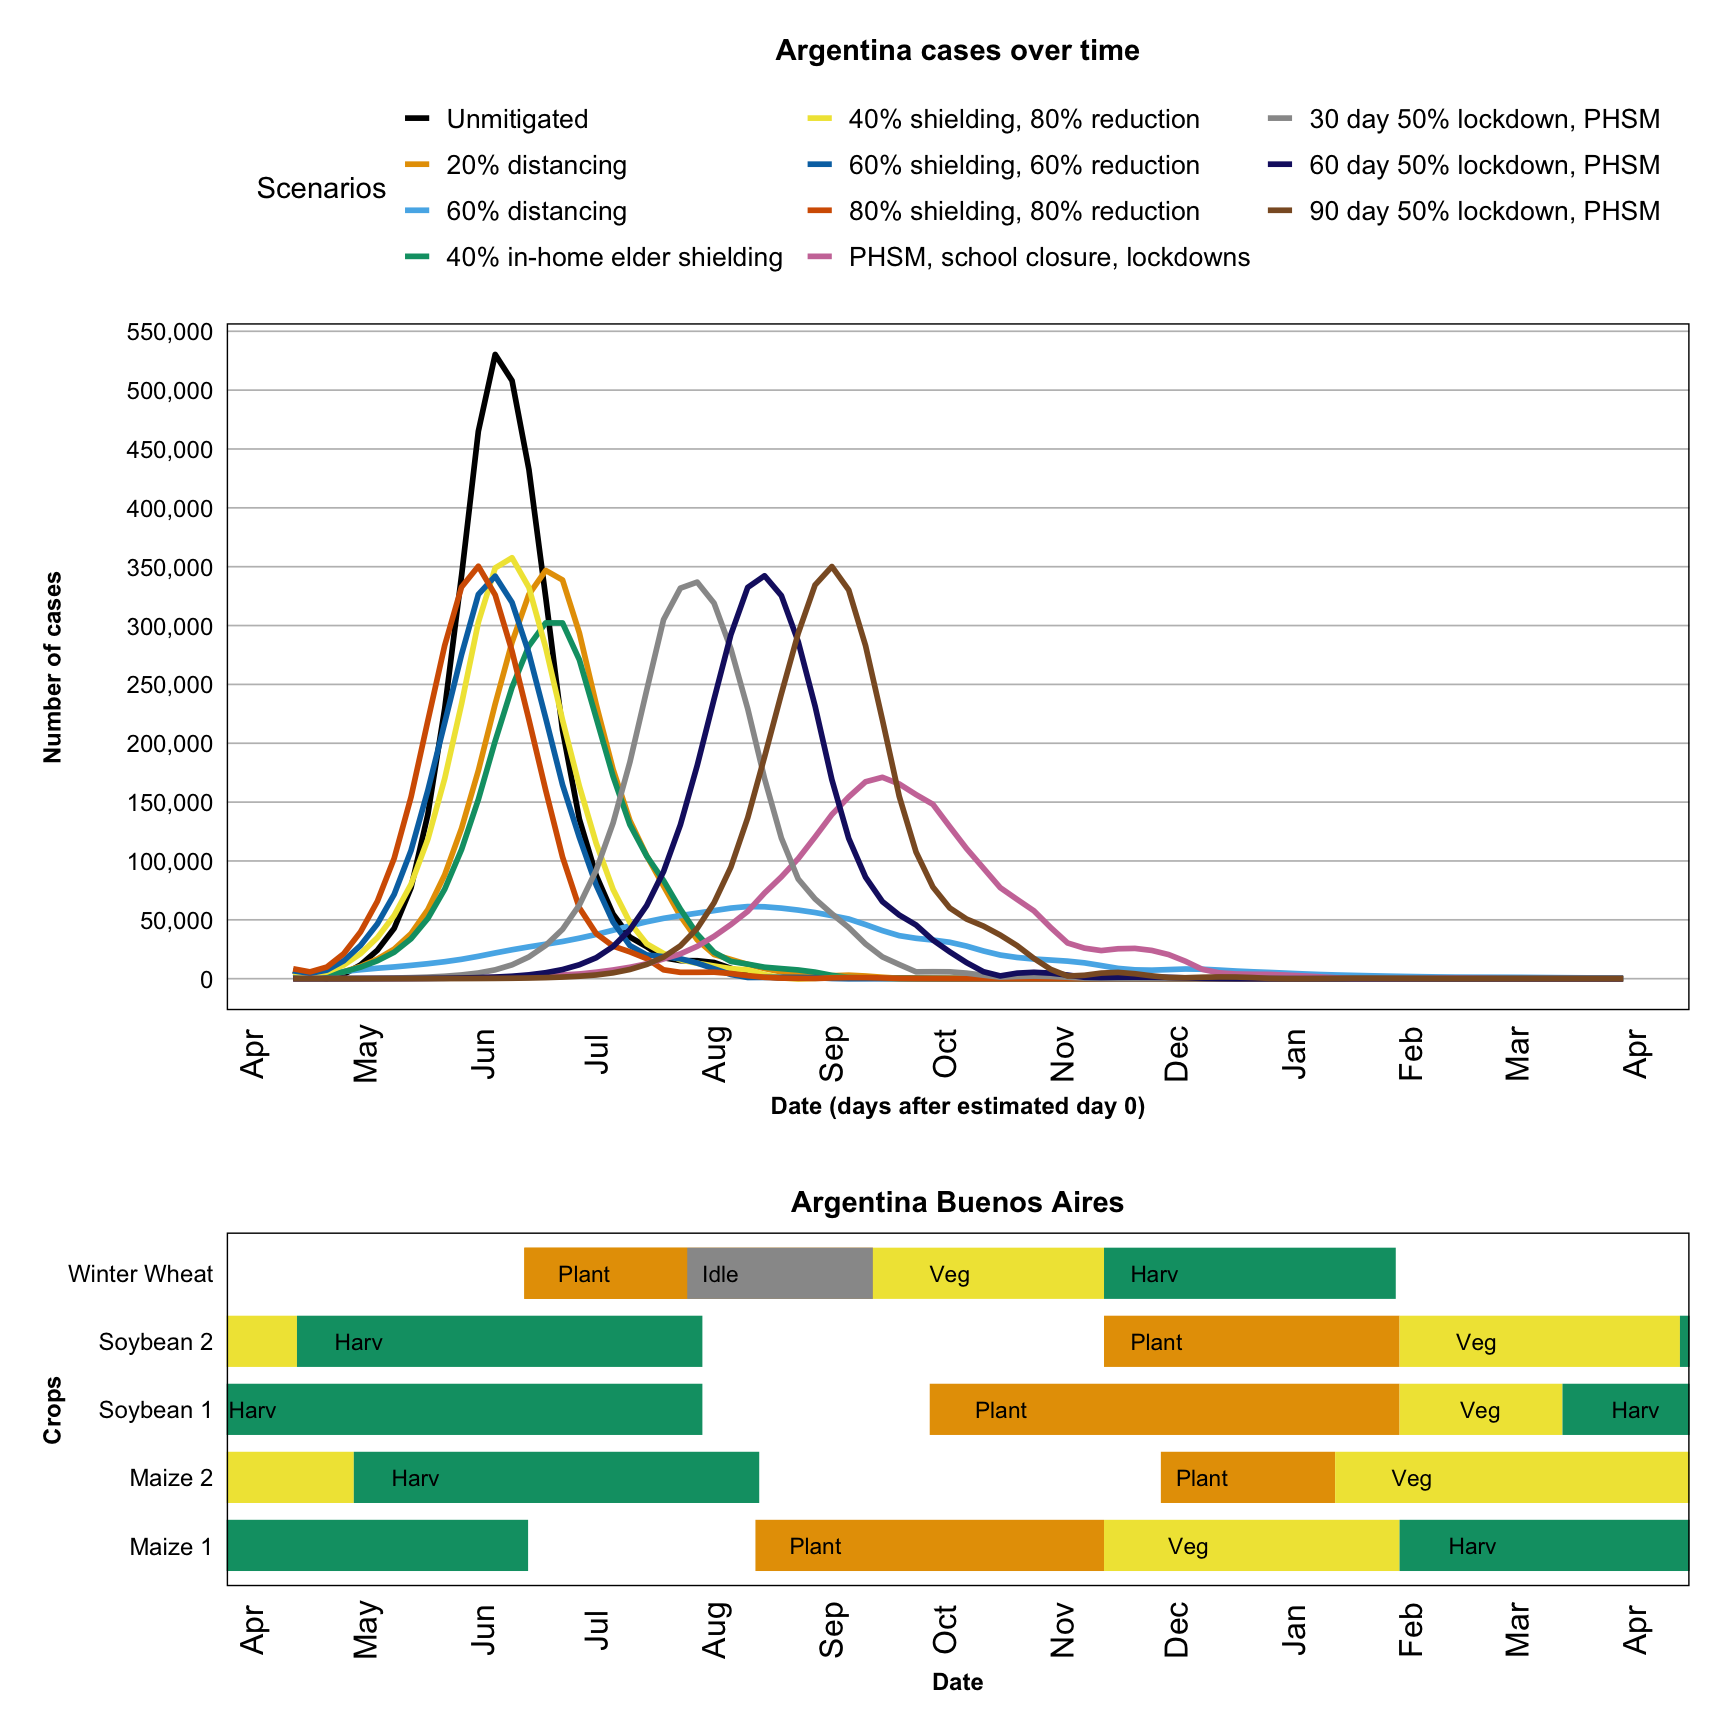
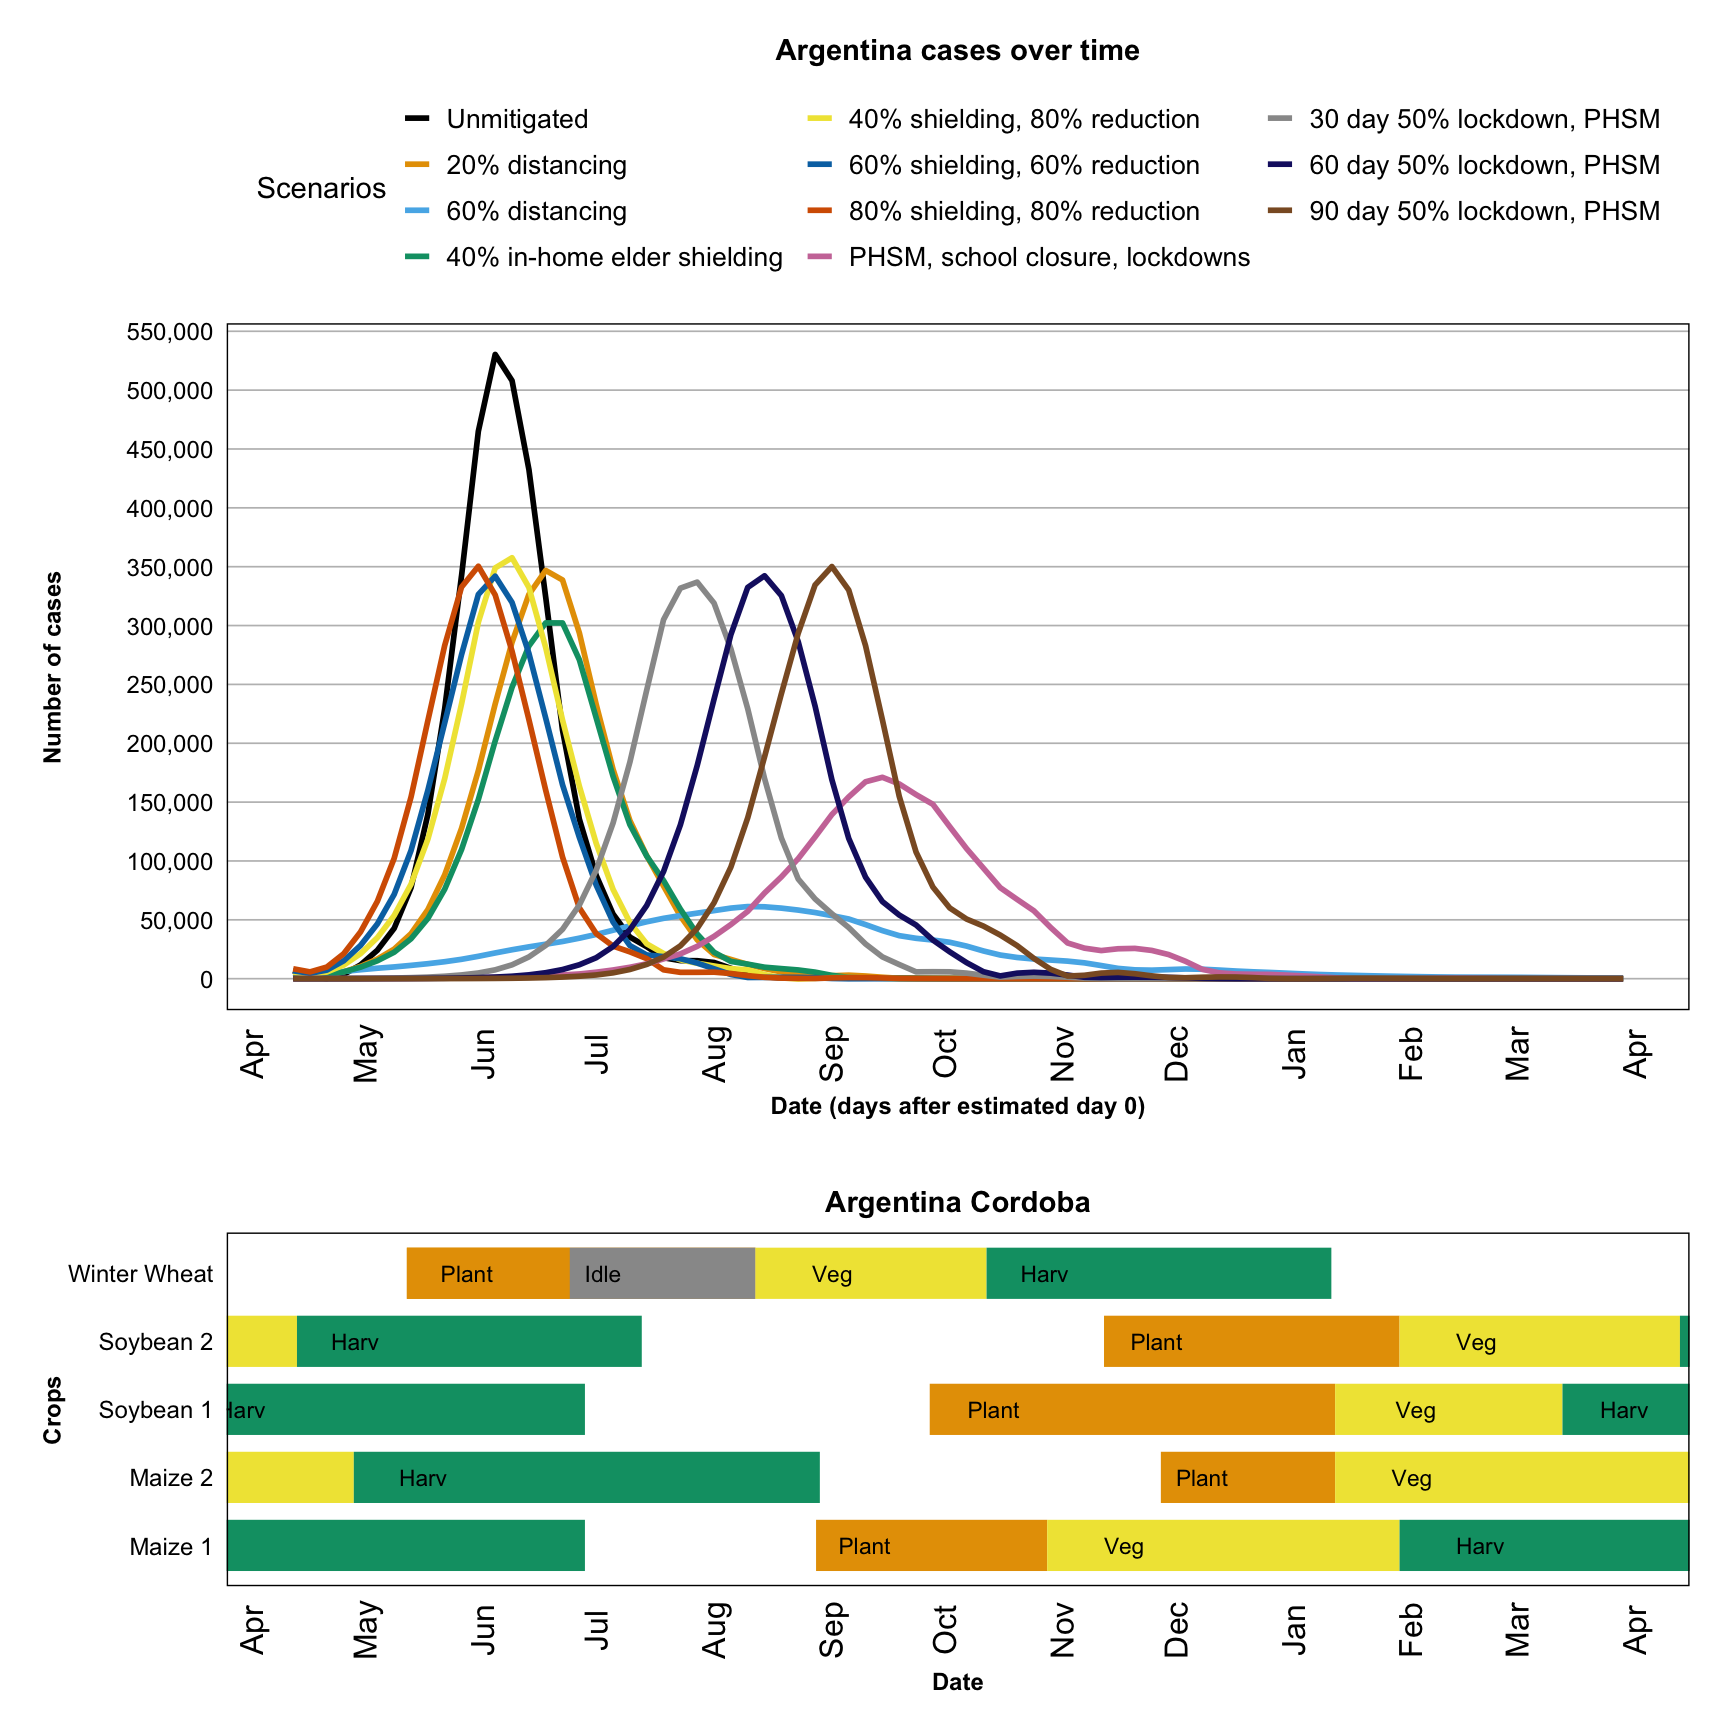
Country specific information
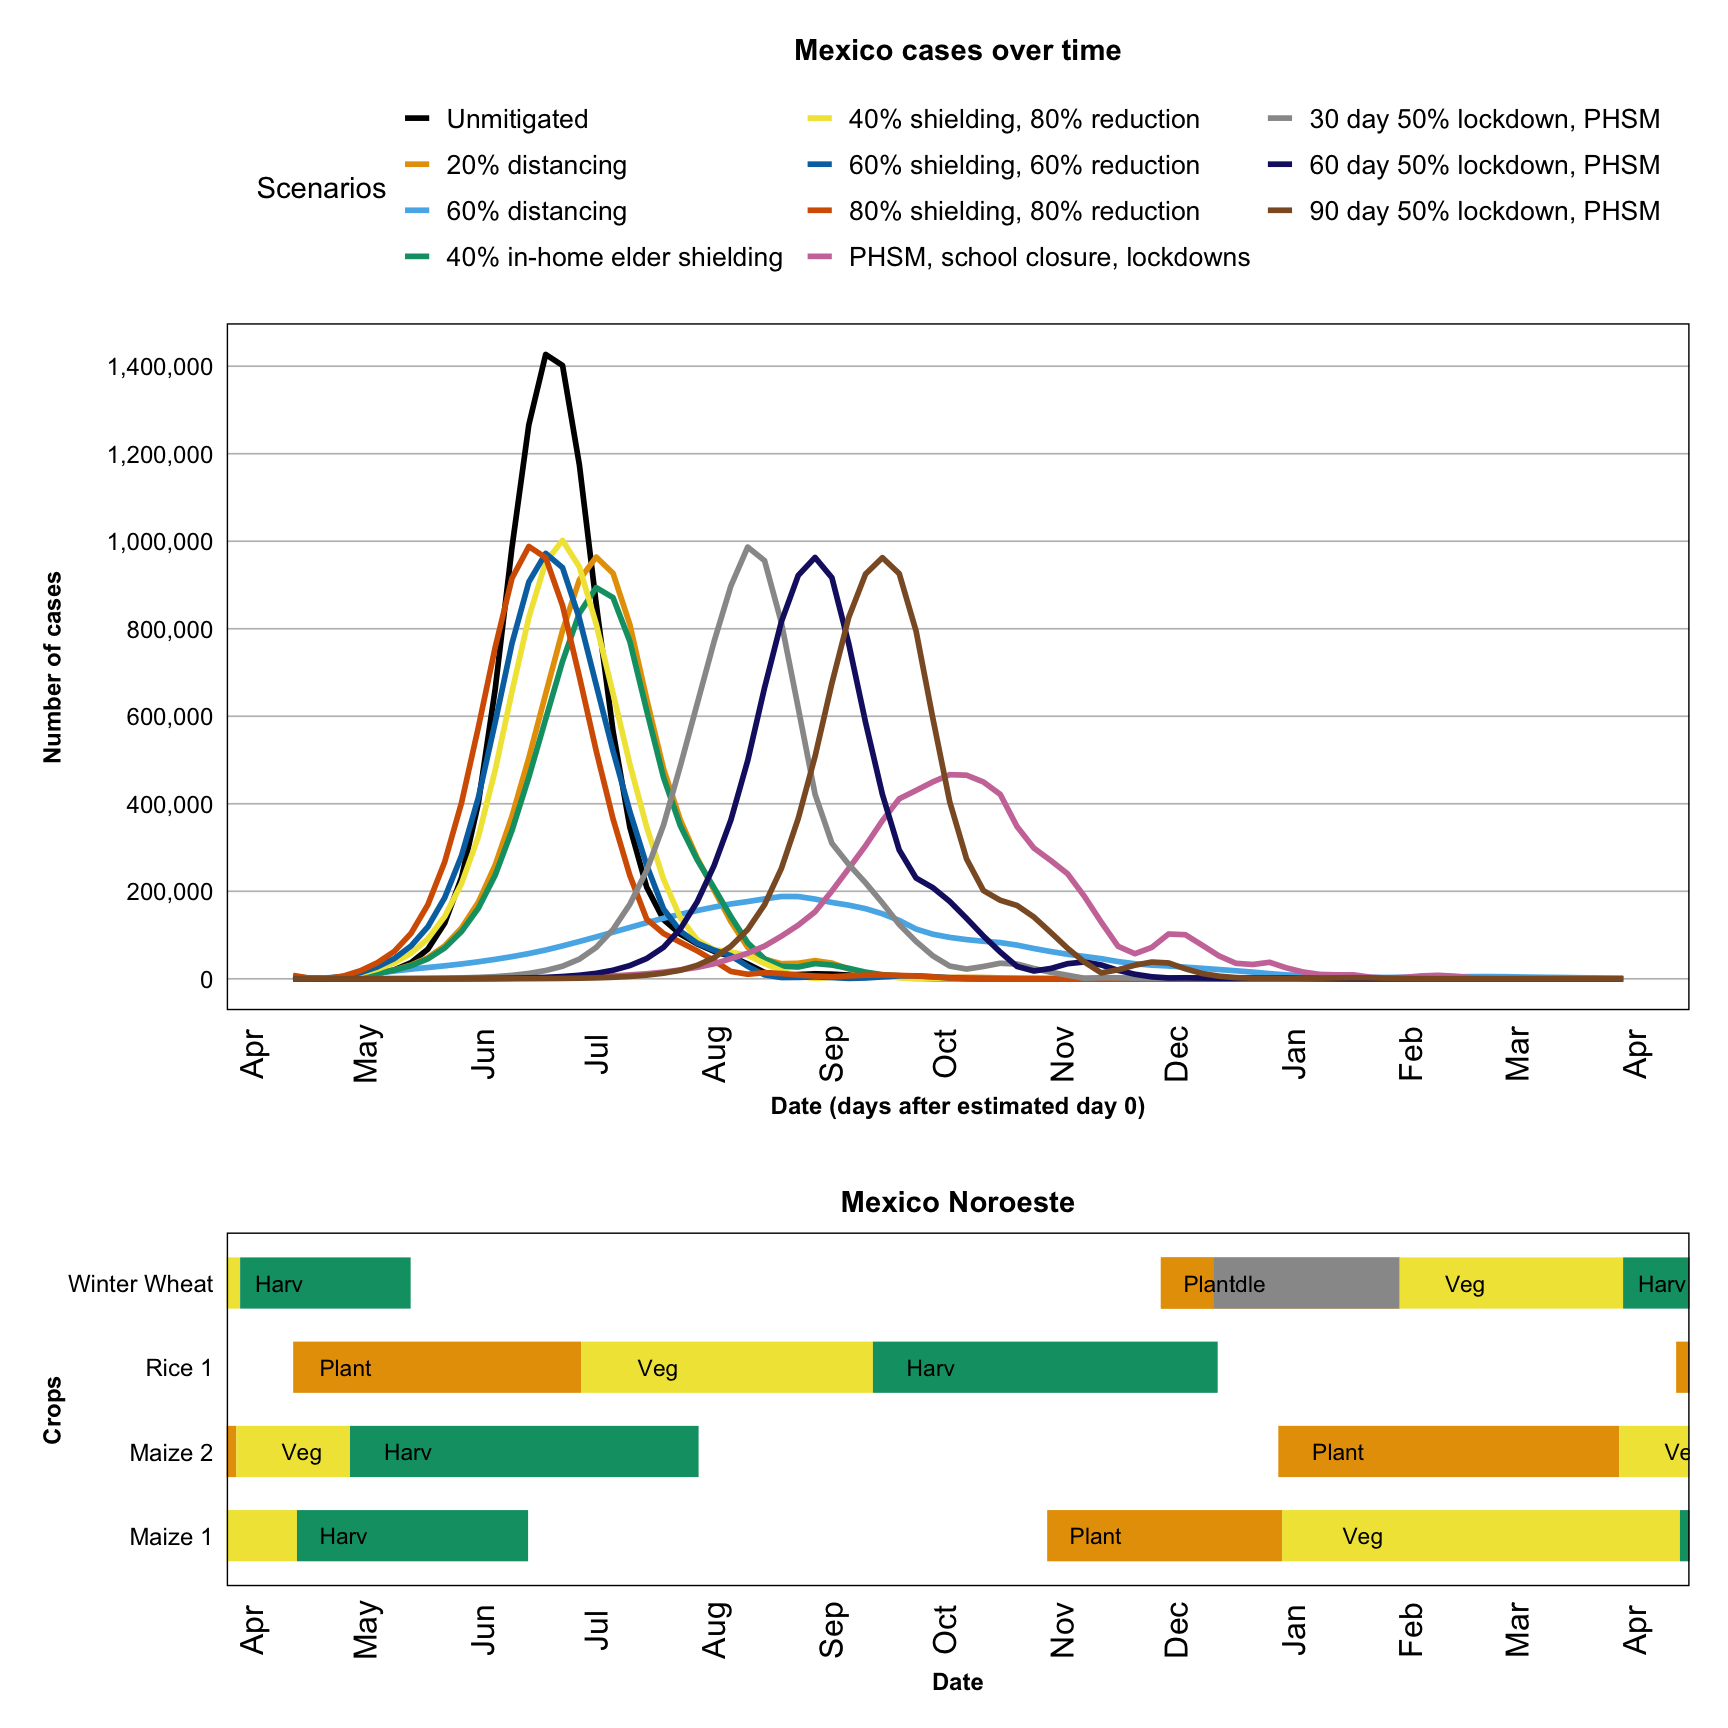
How to read the analysis
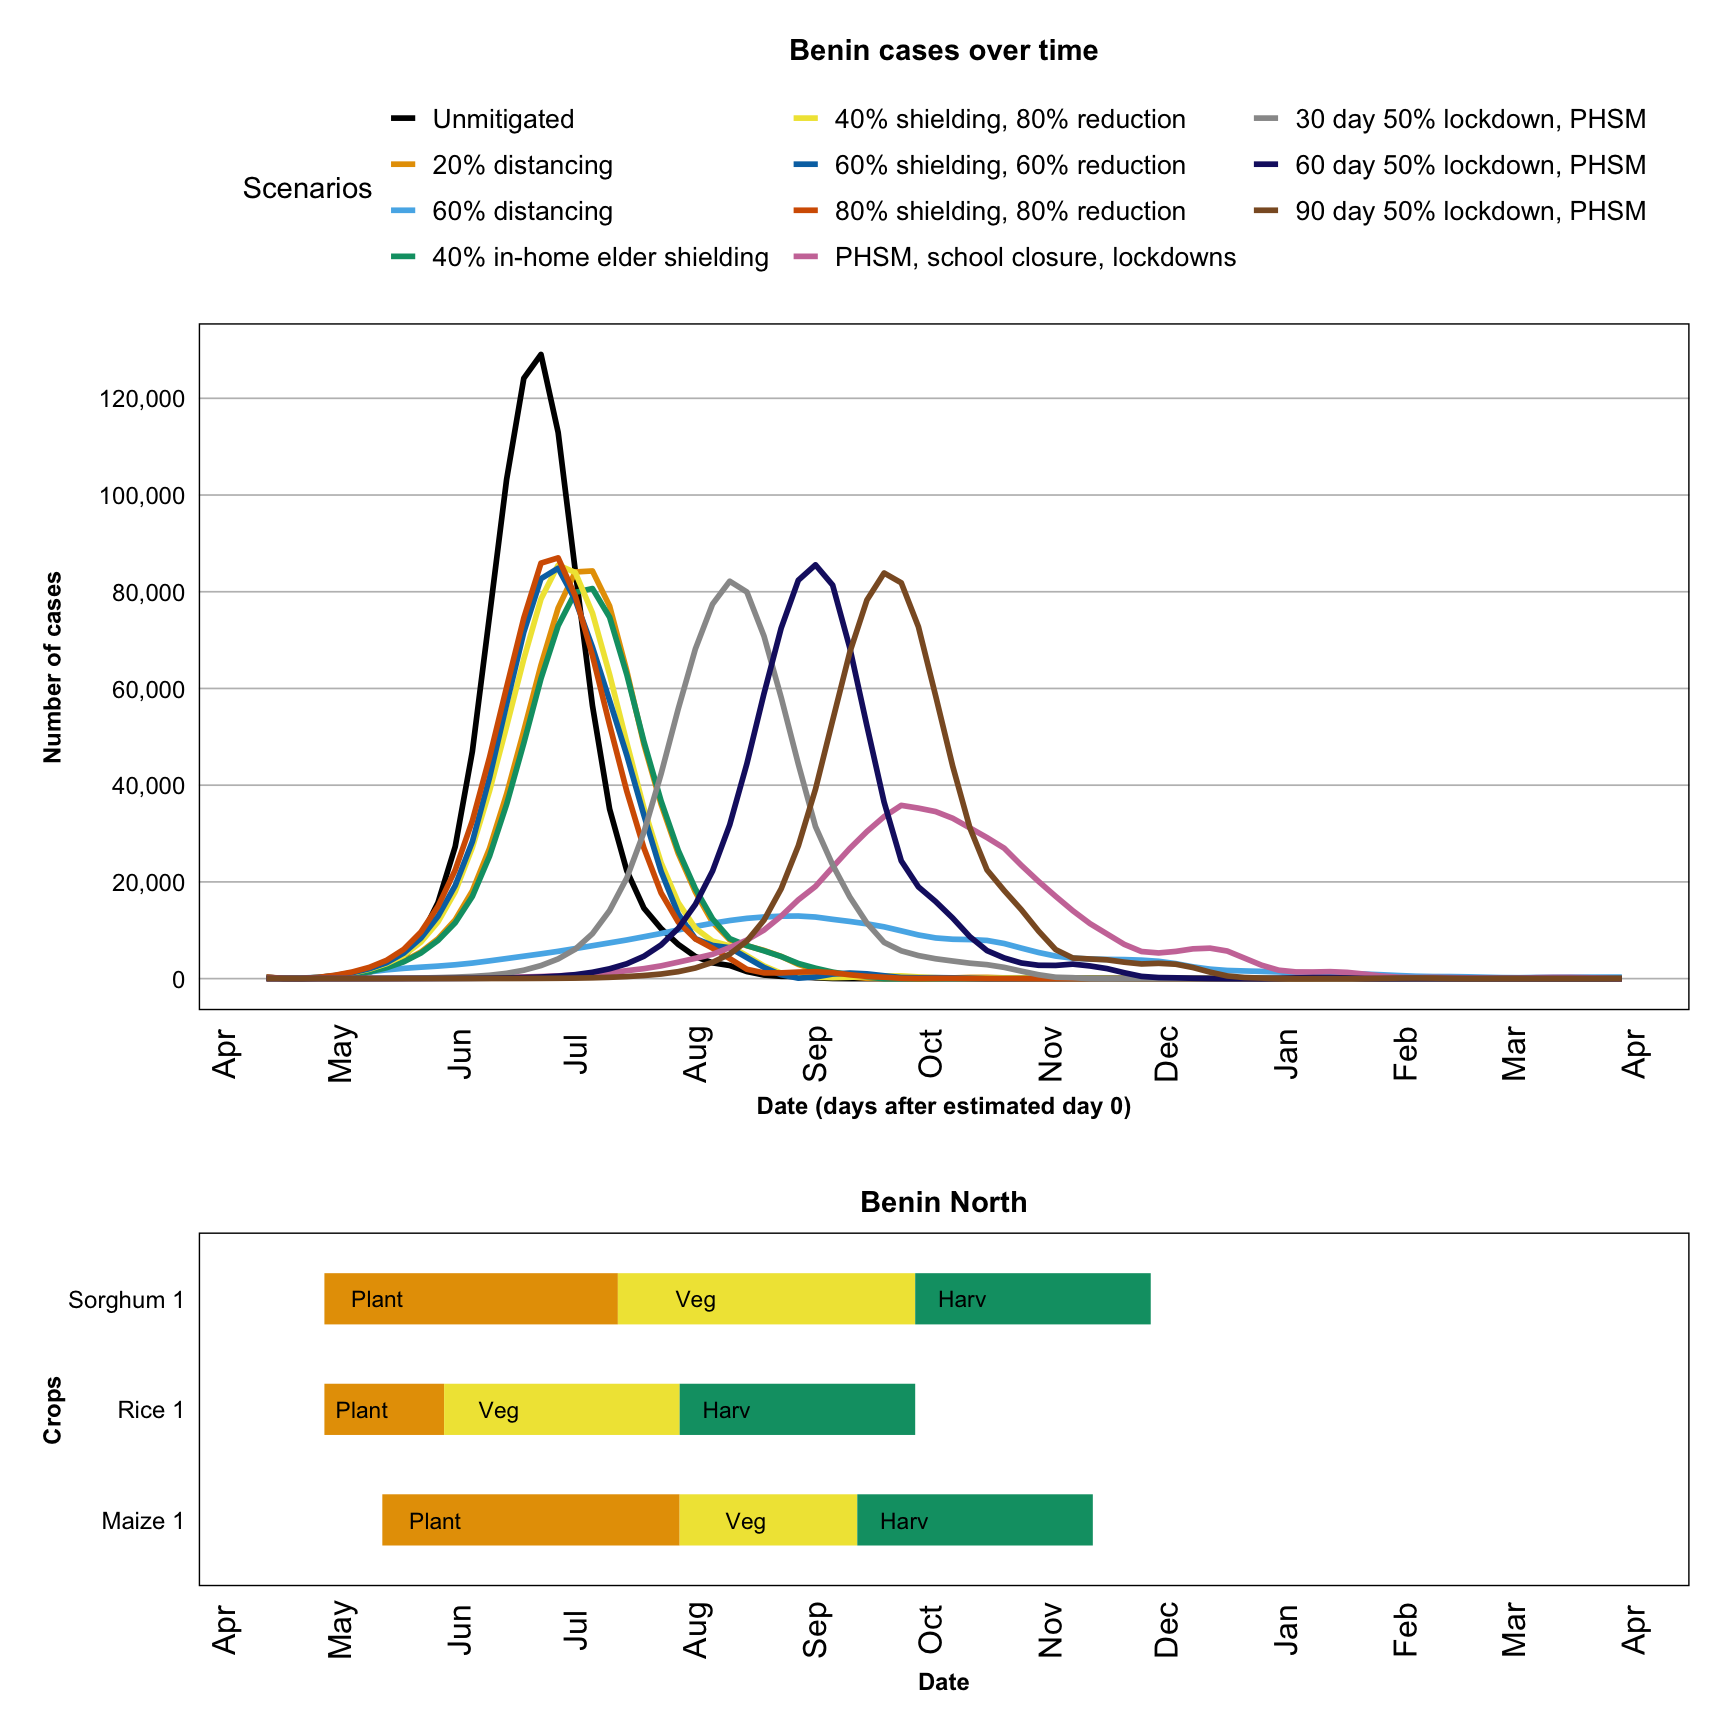
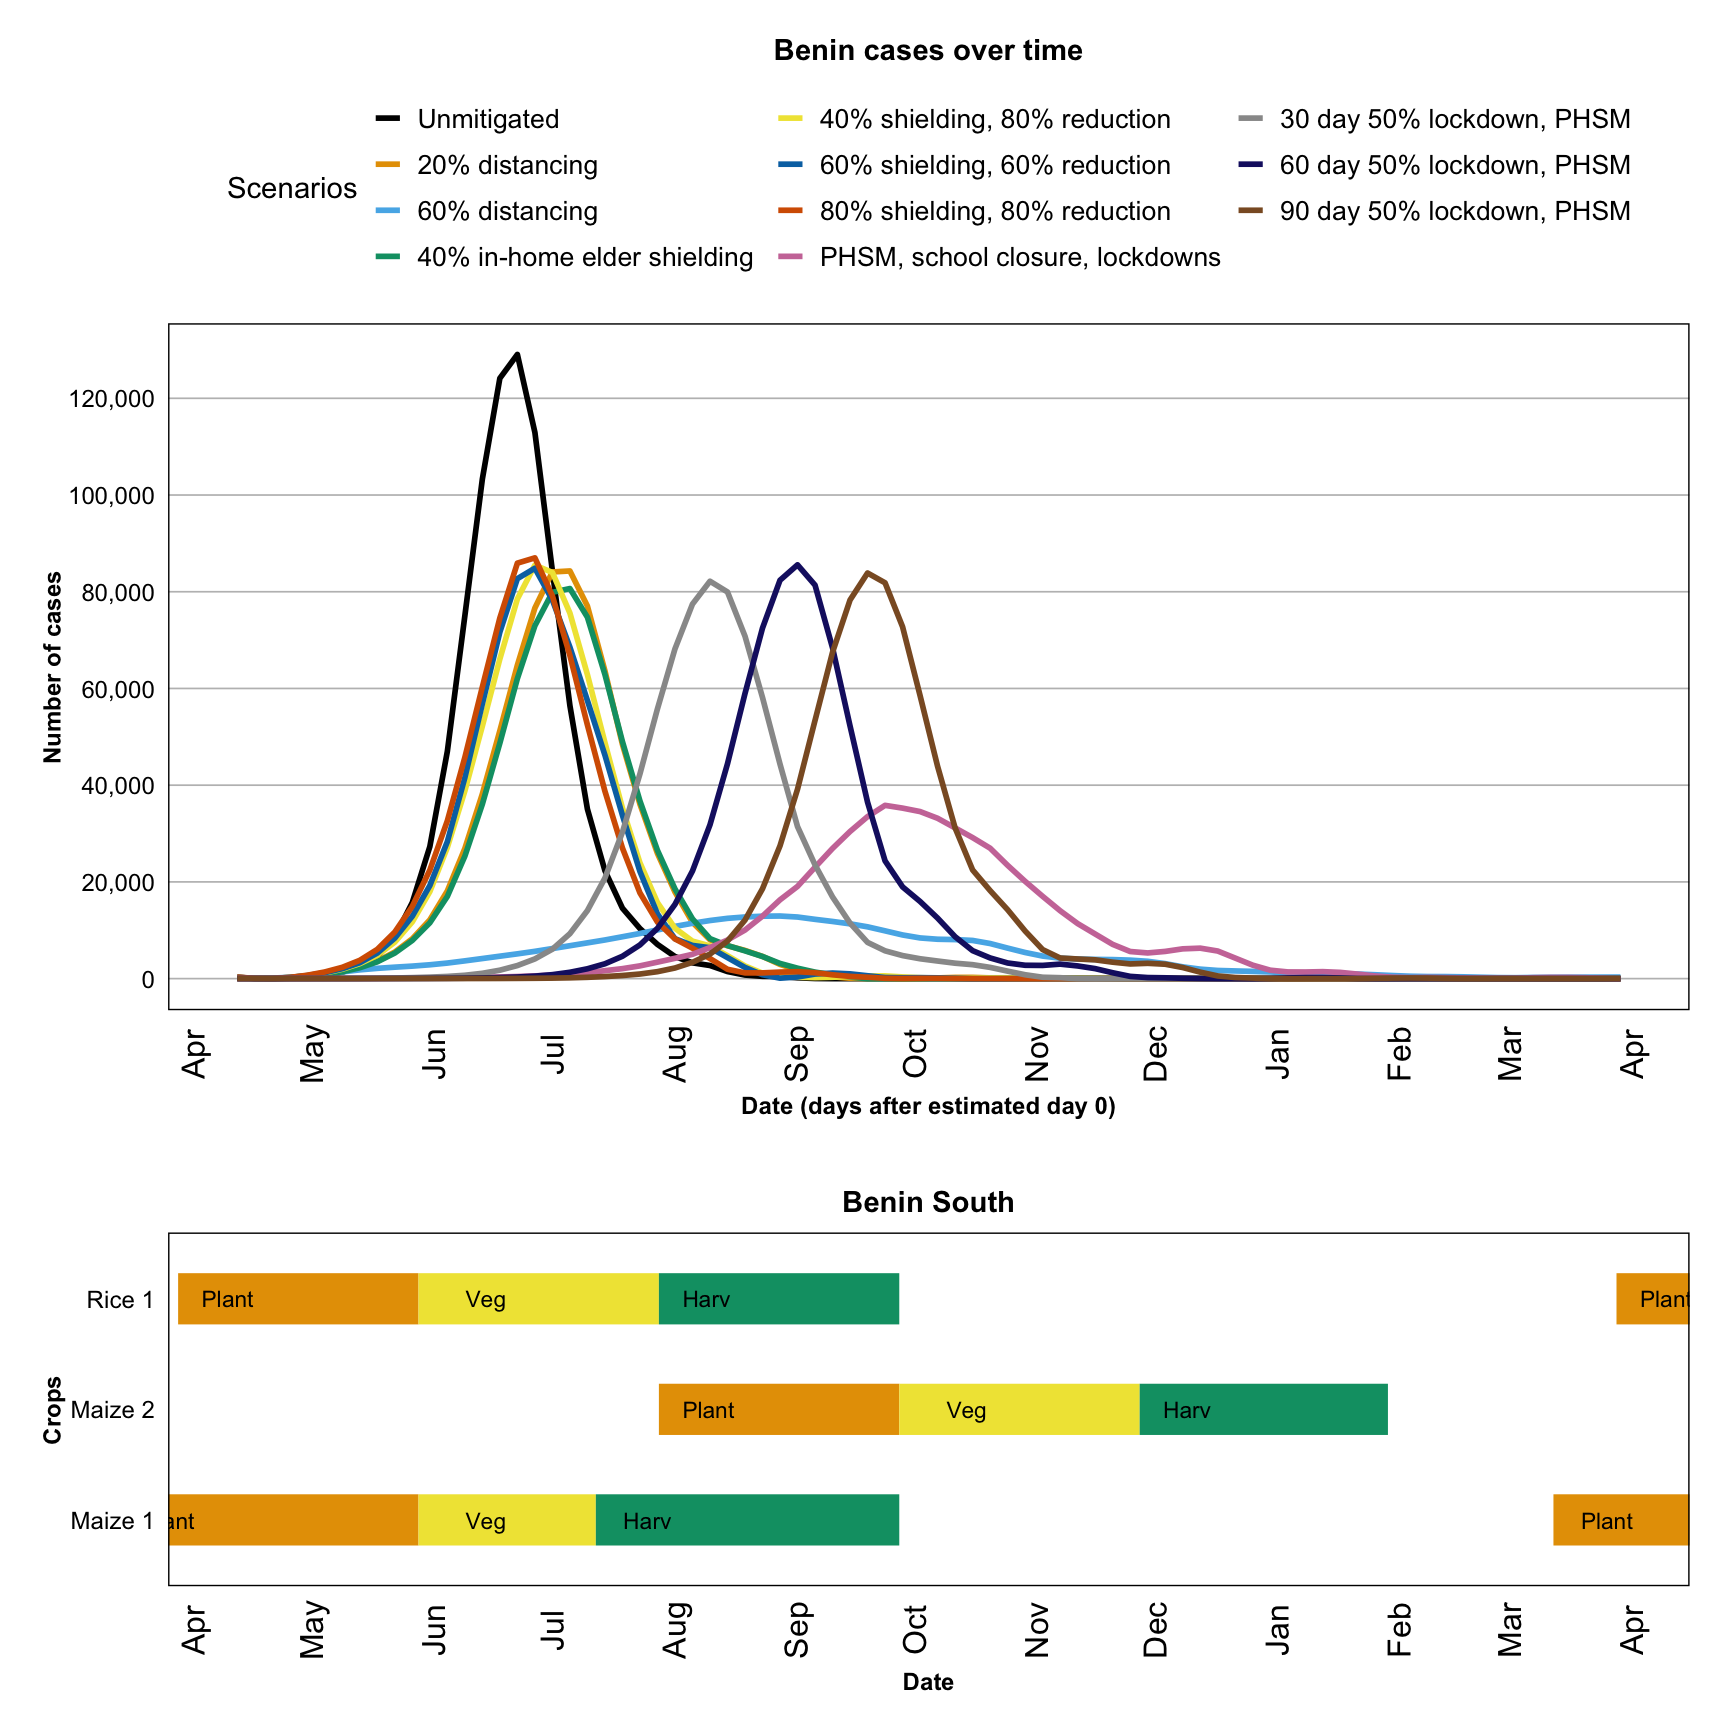
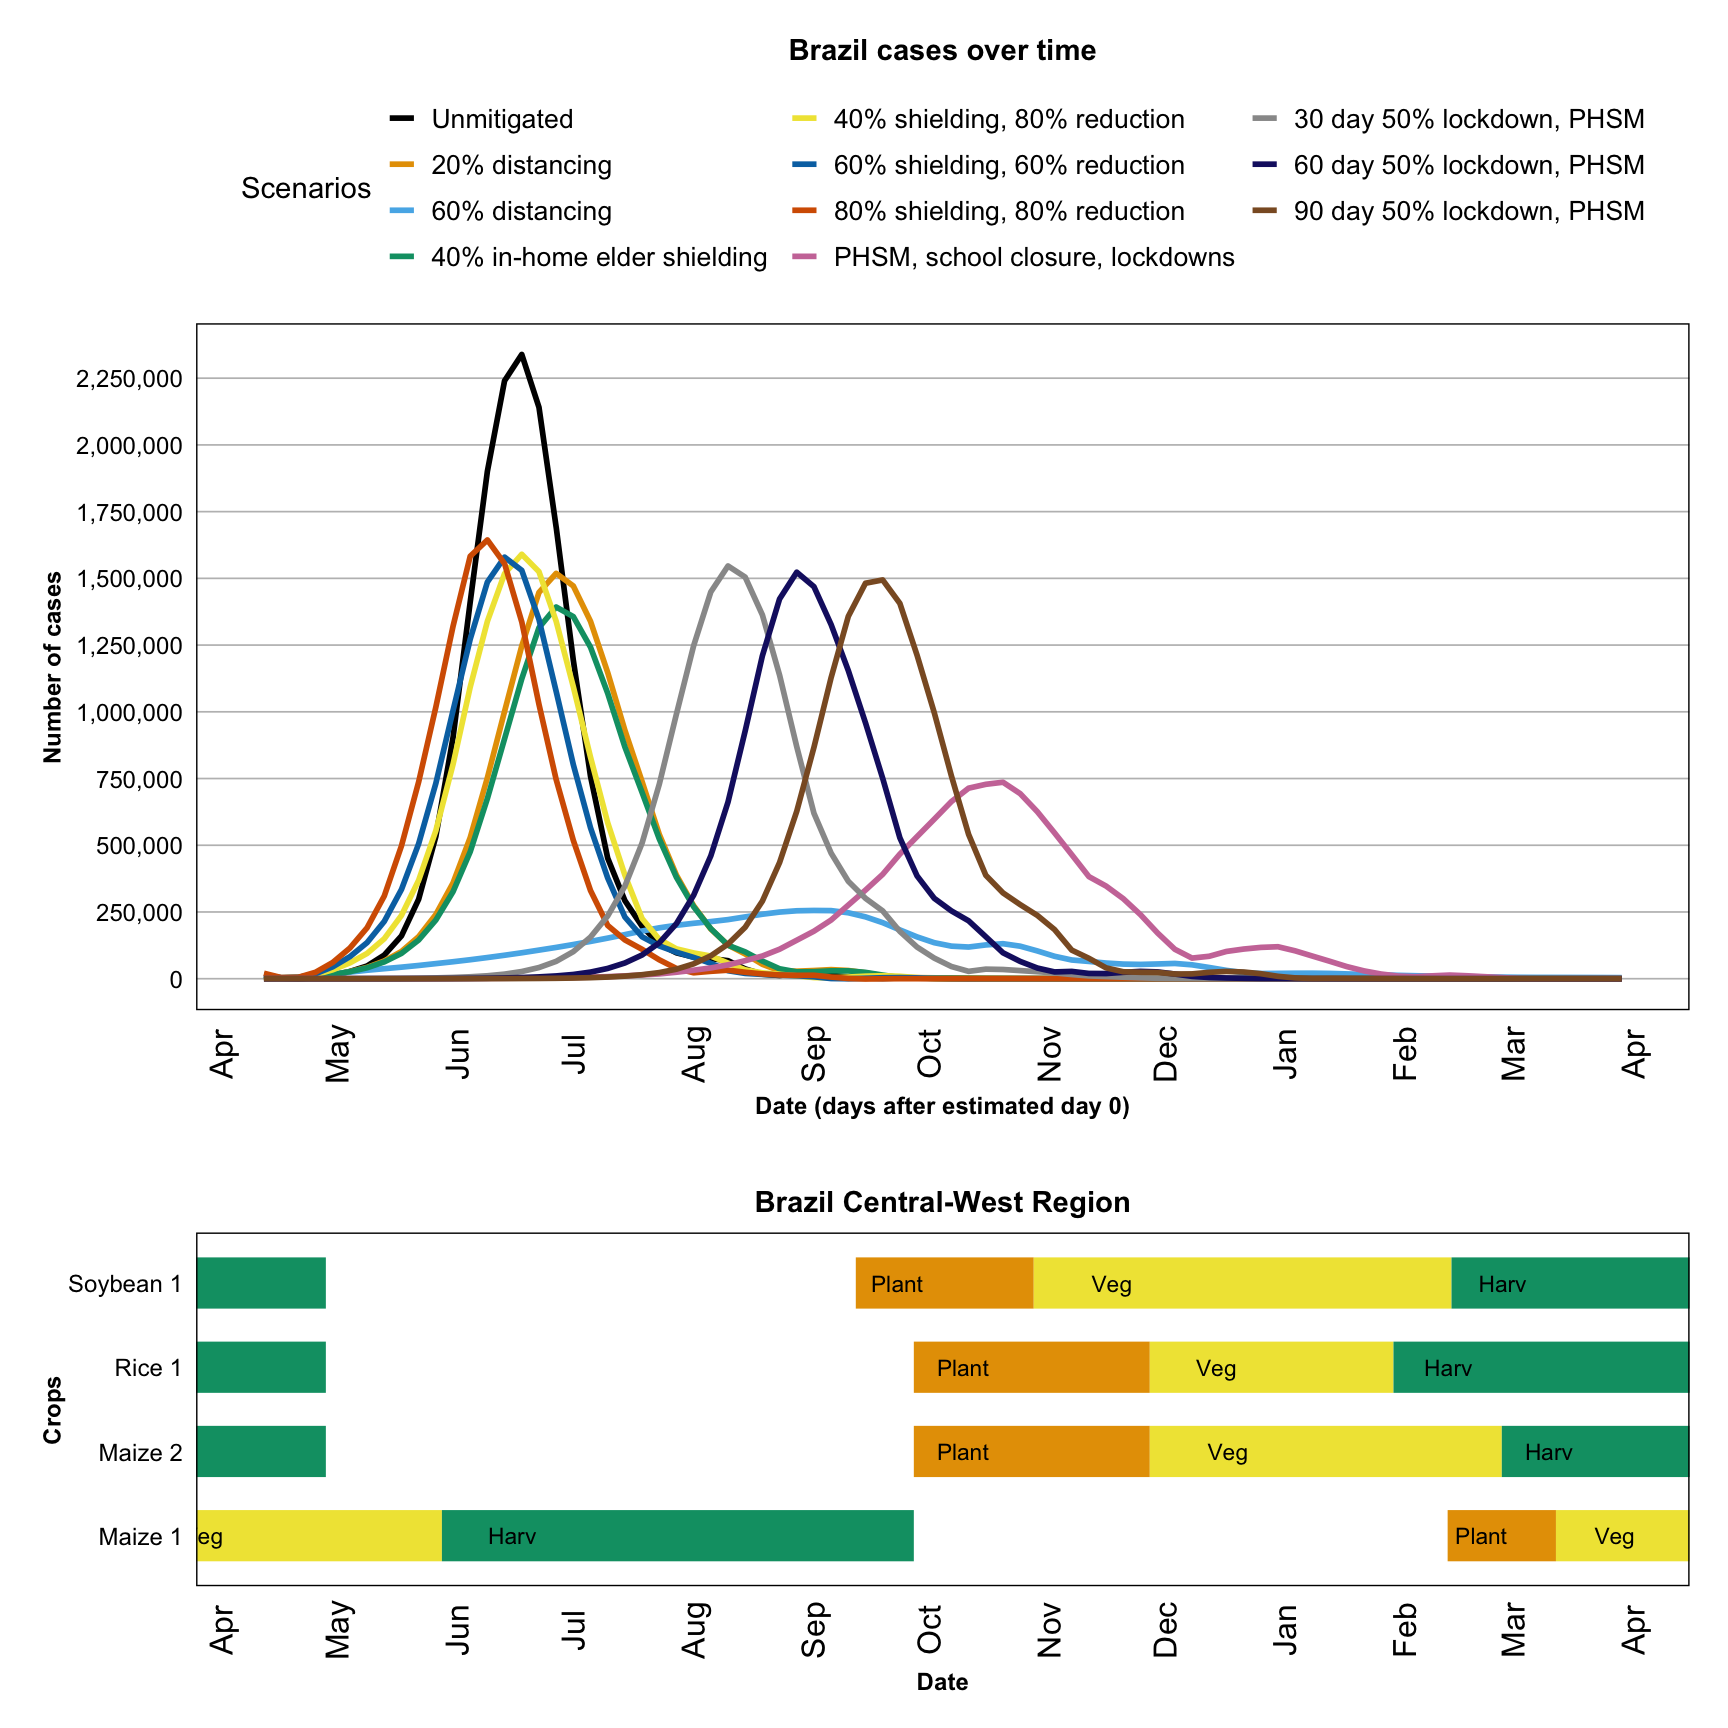
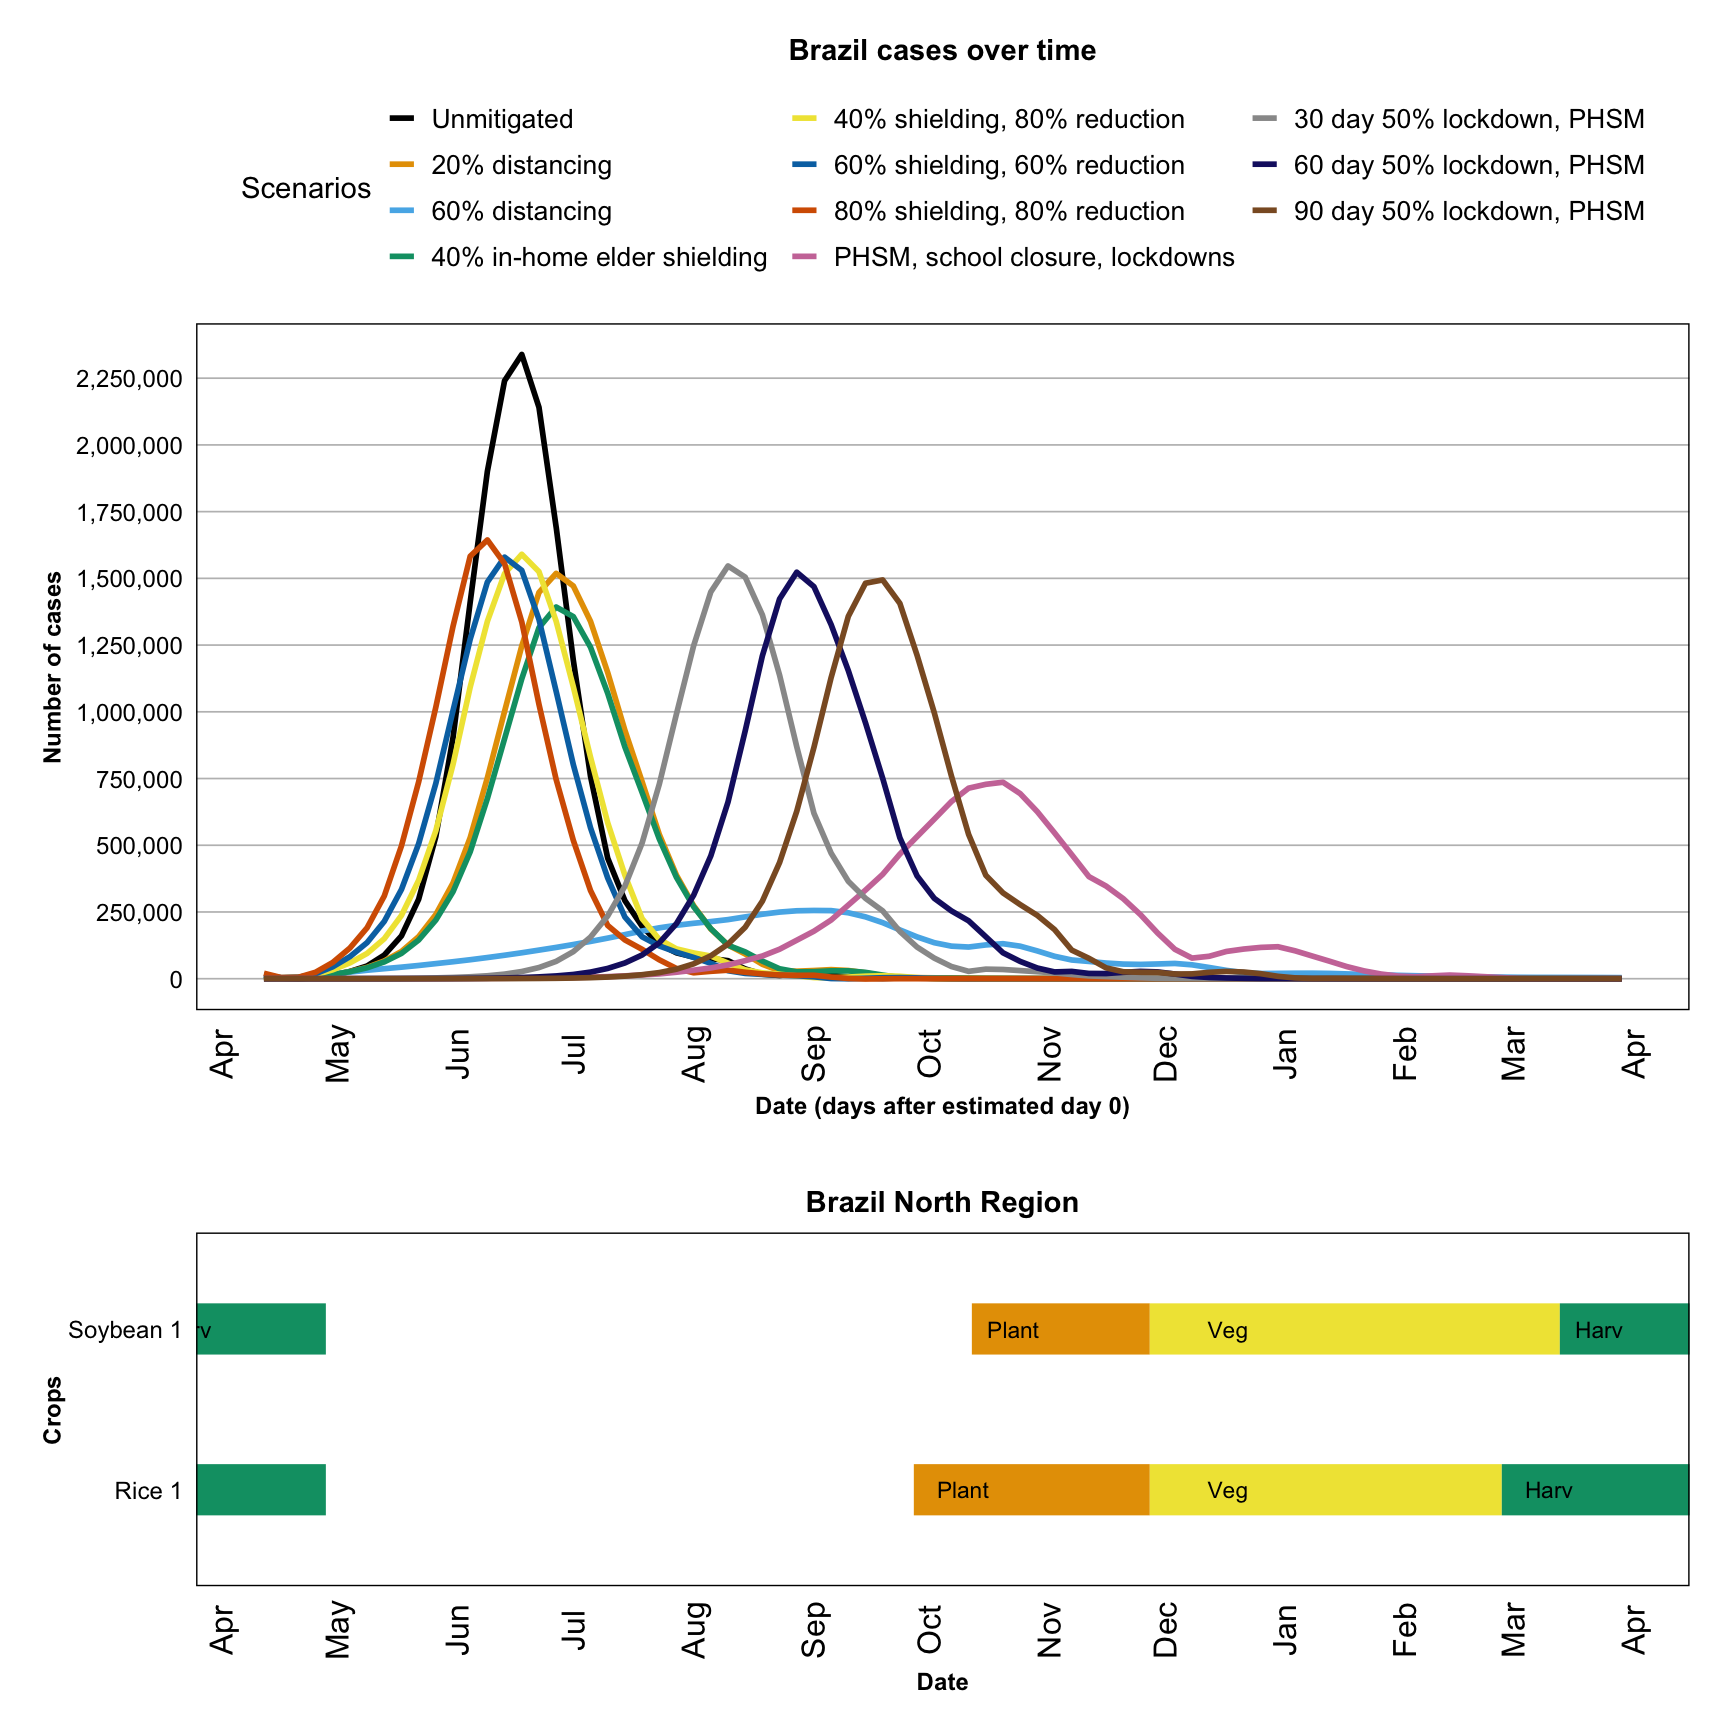
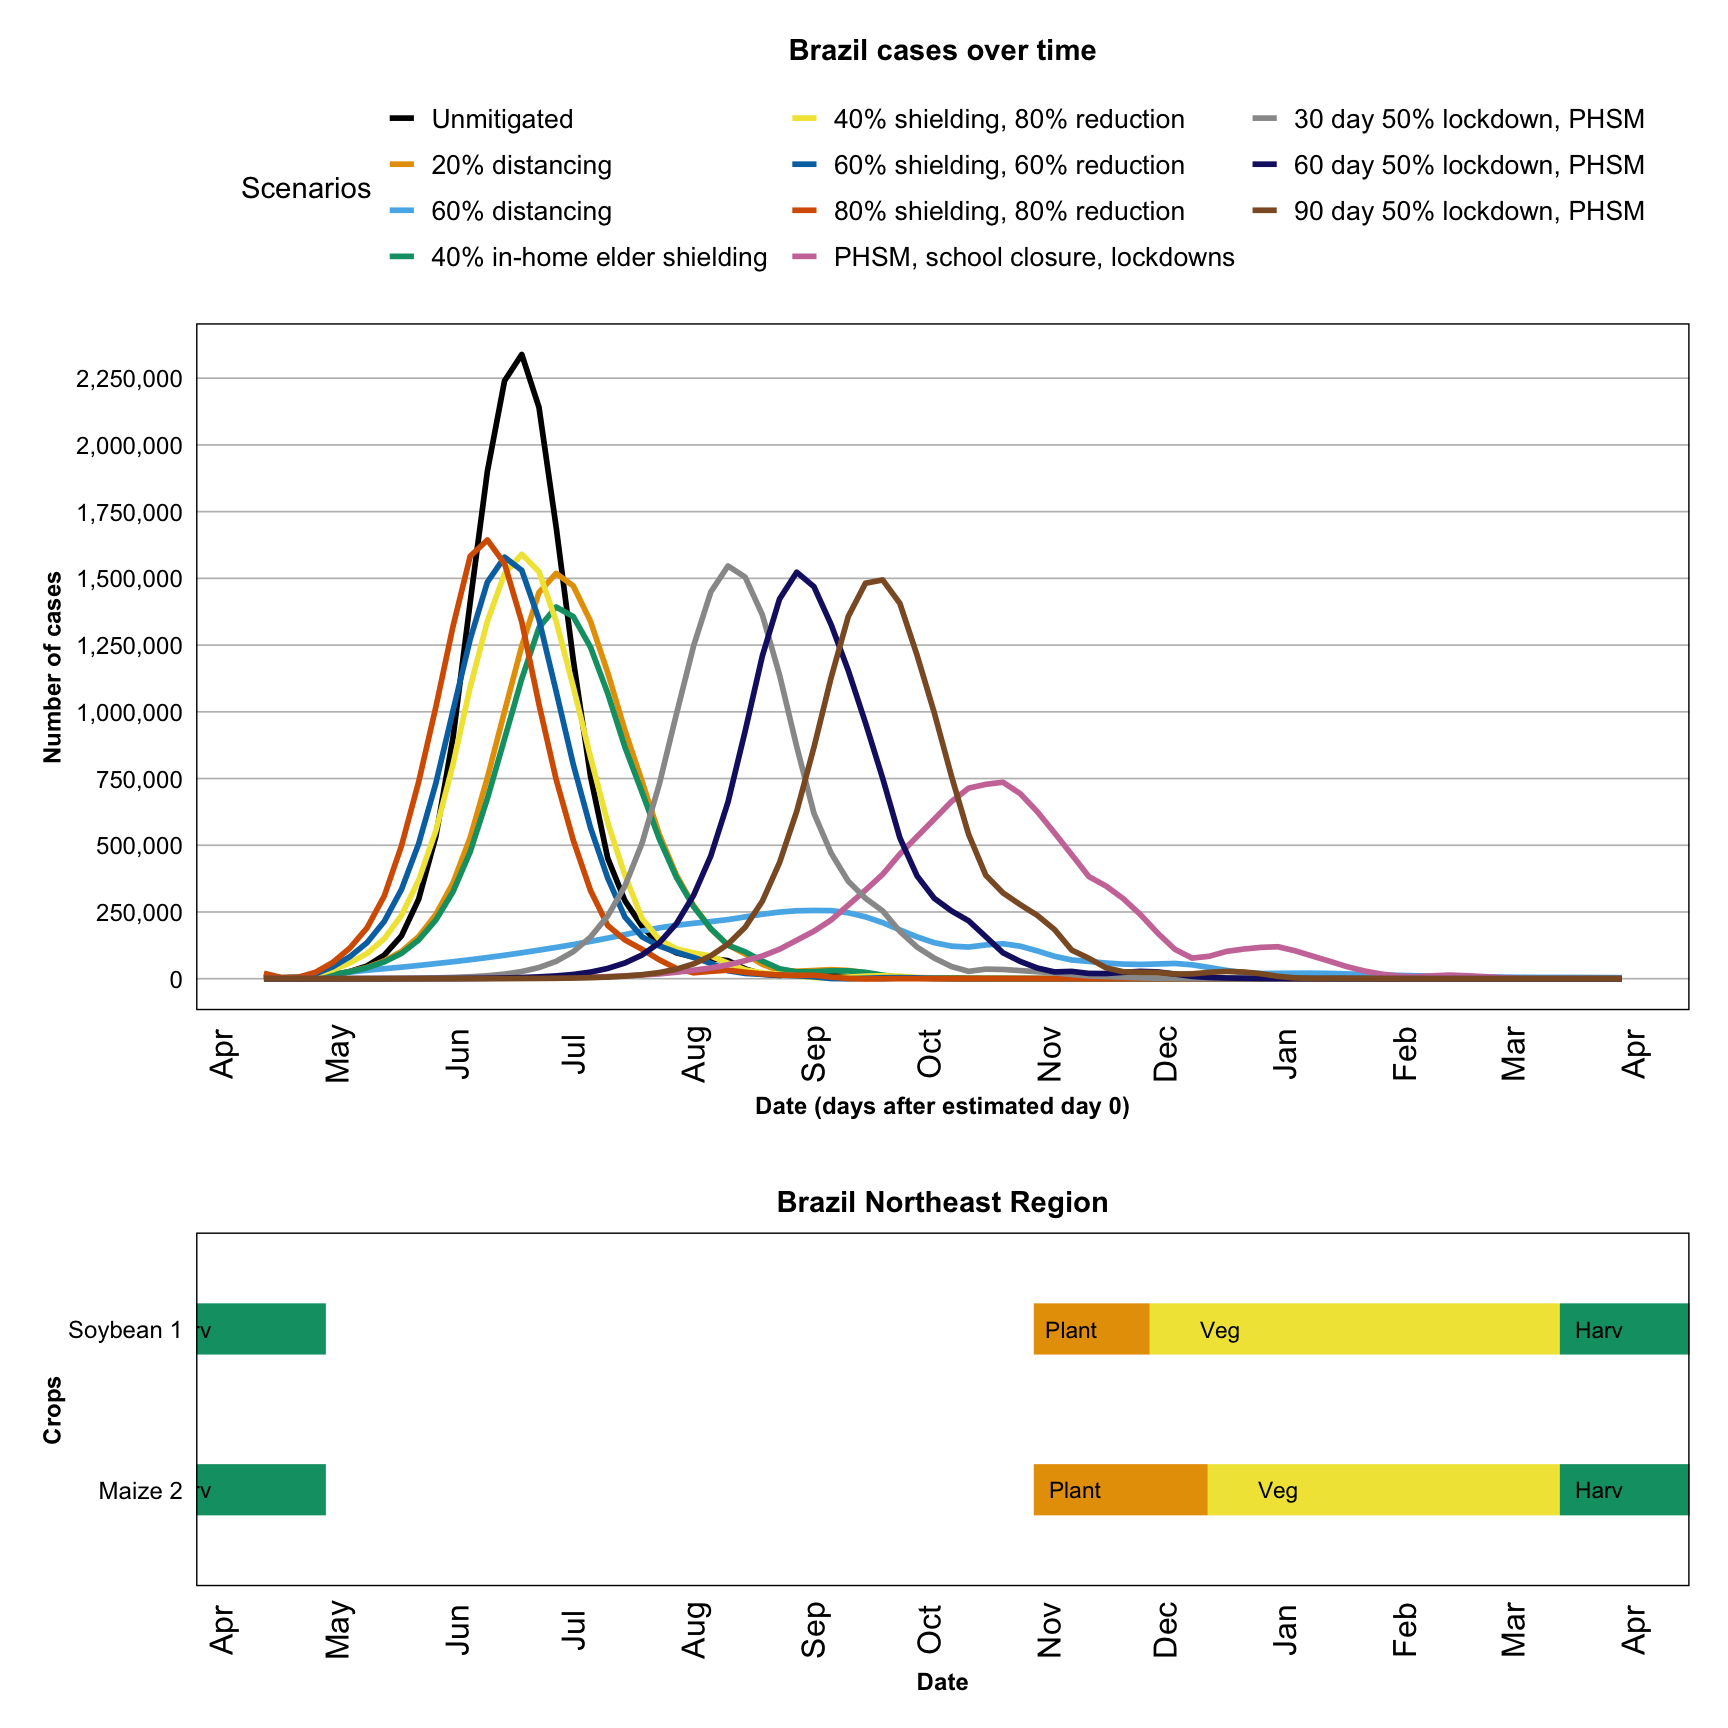
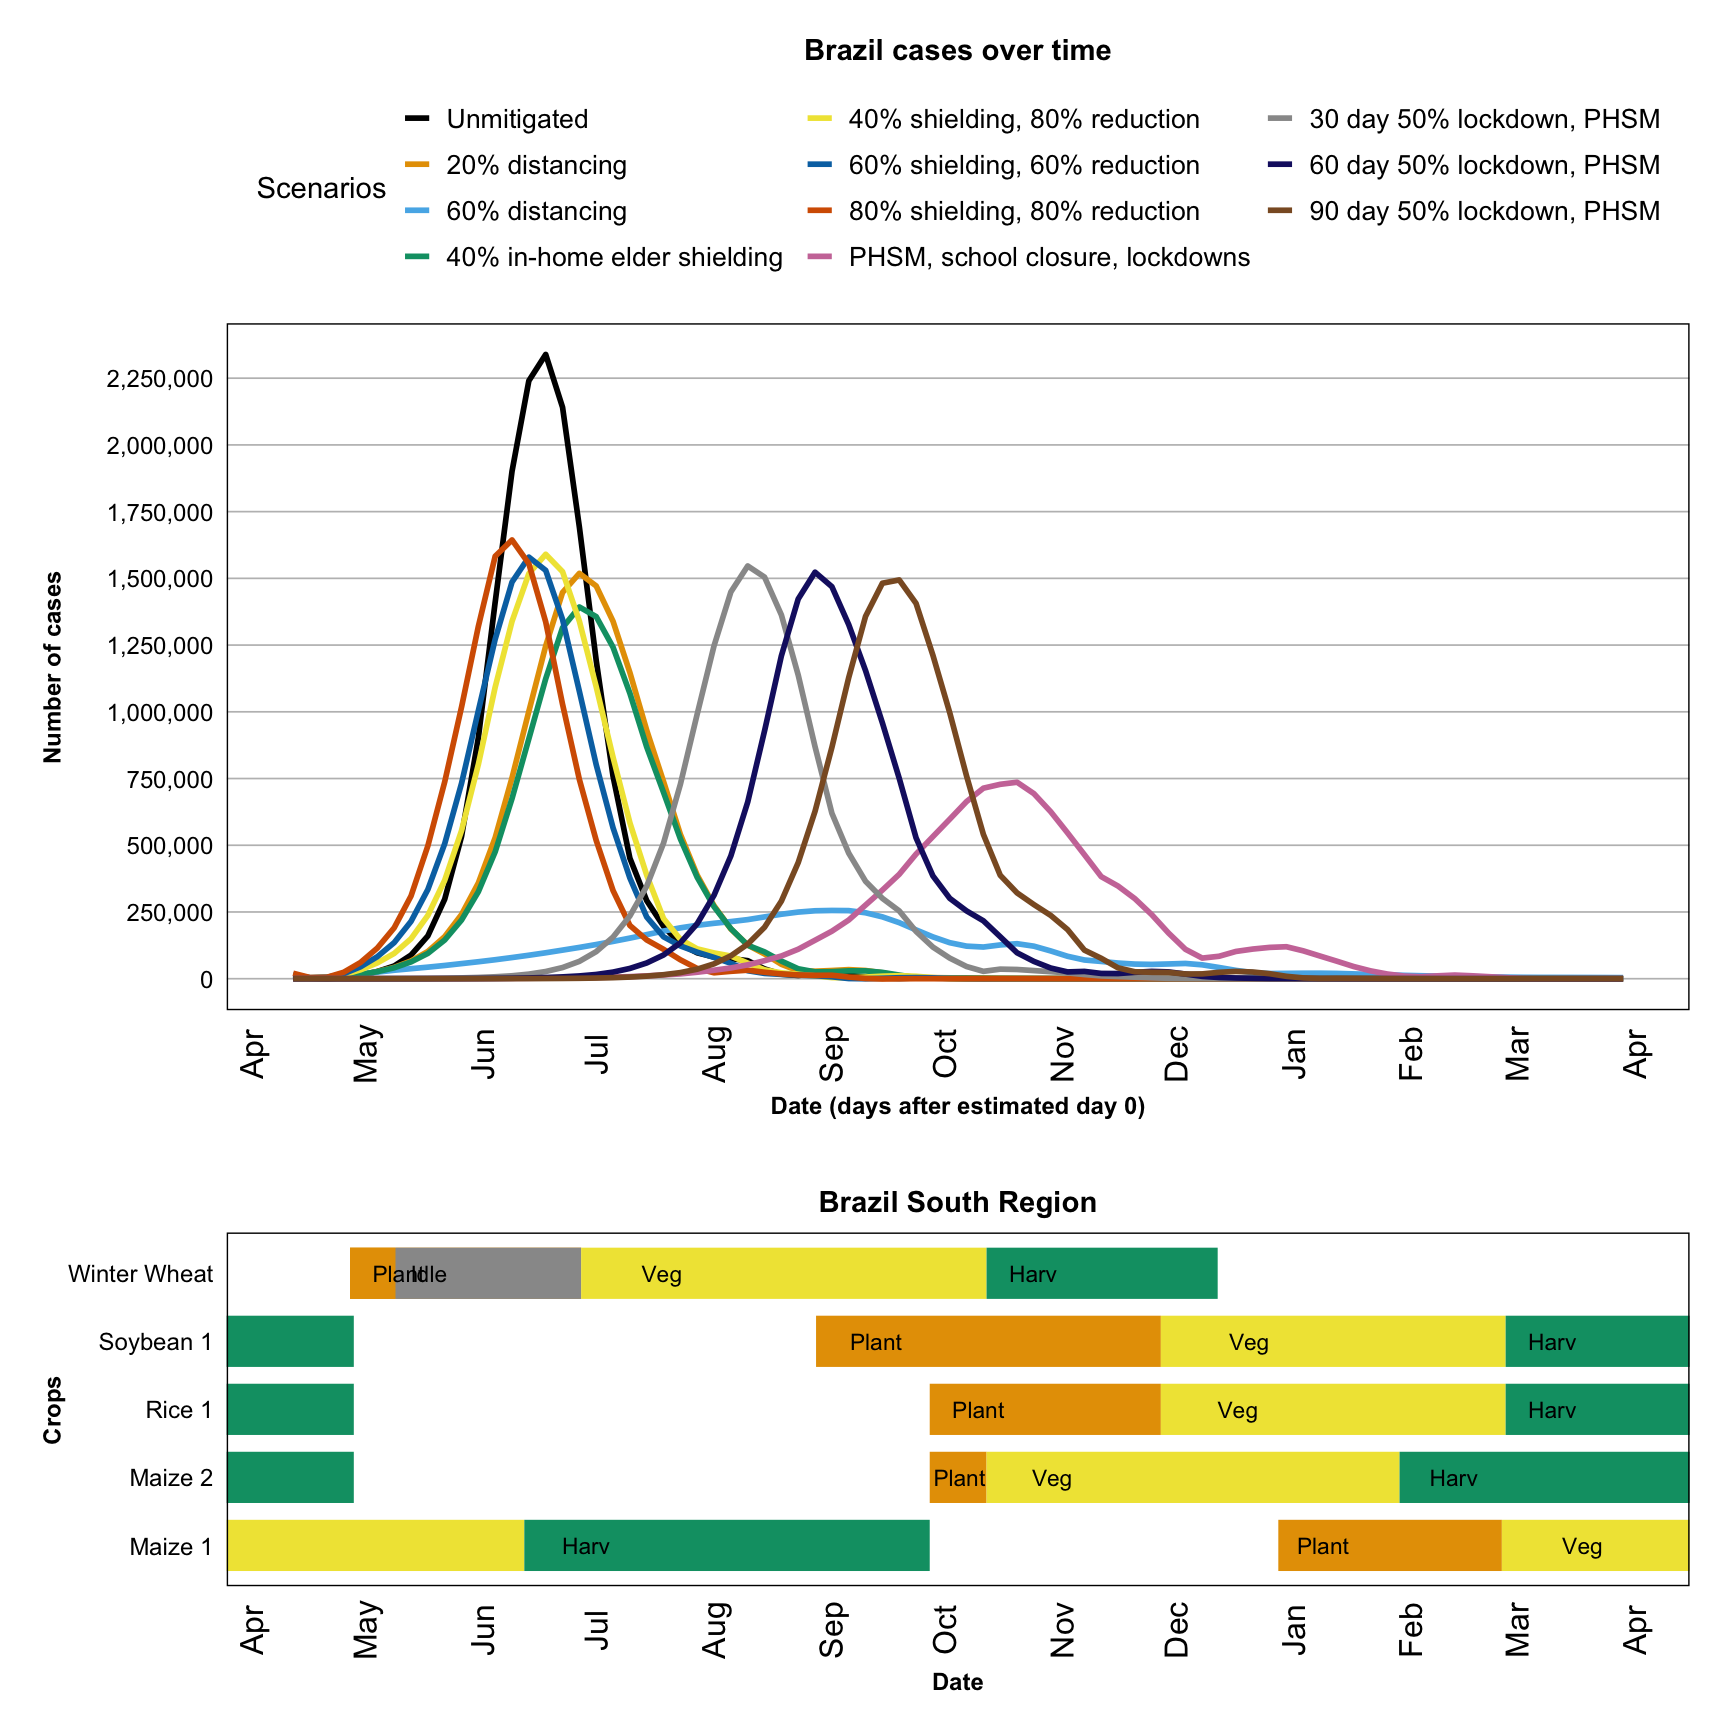
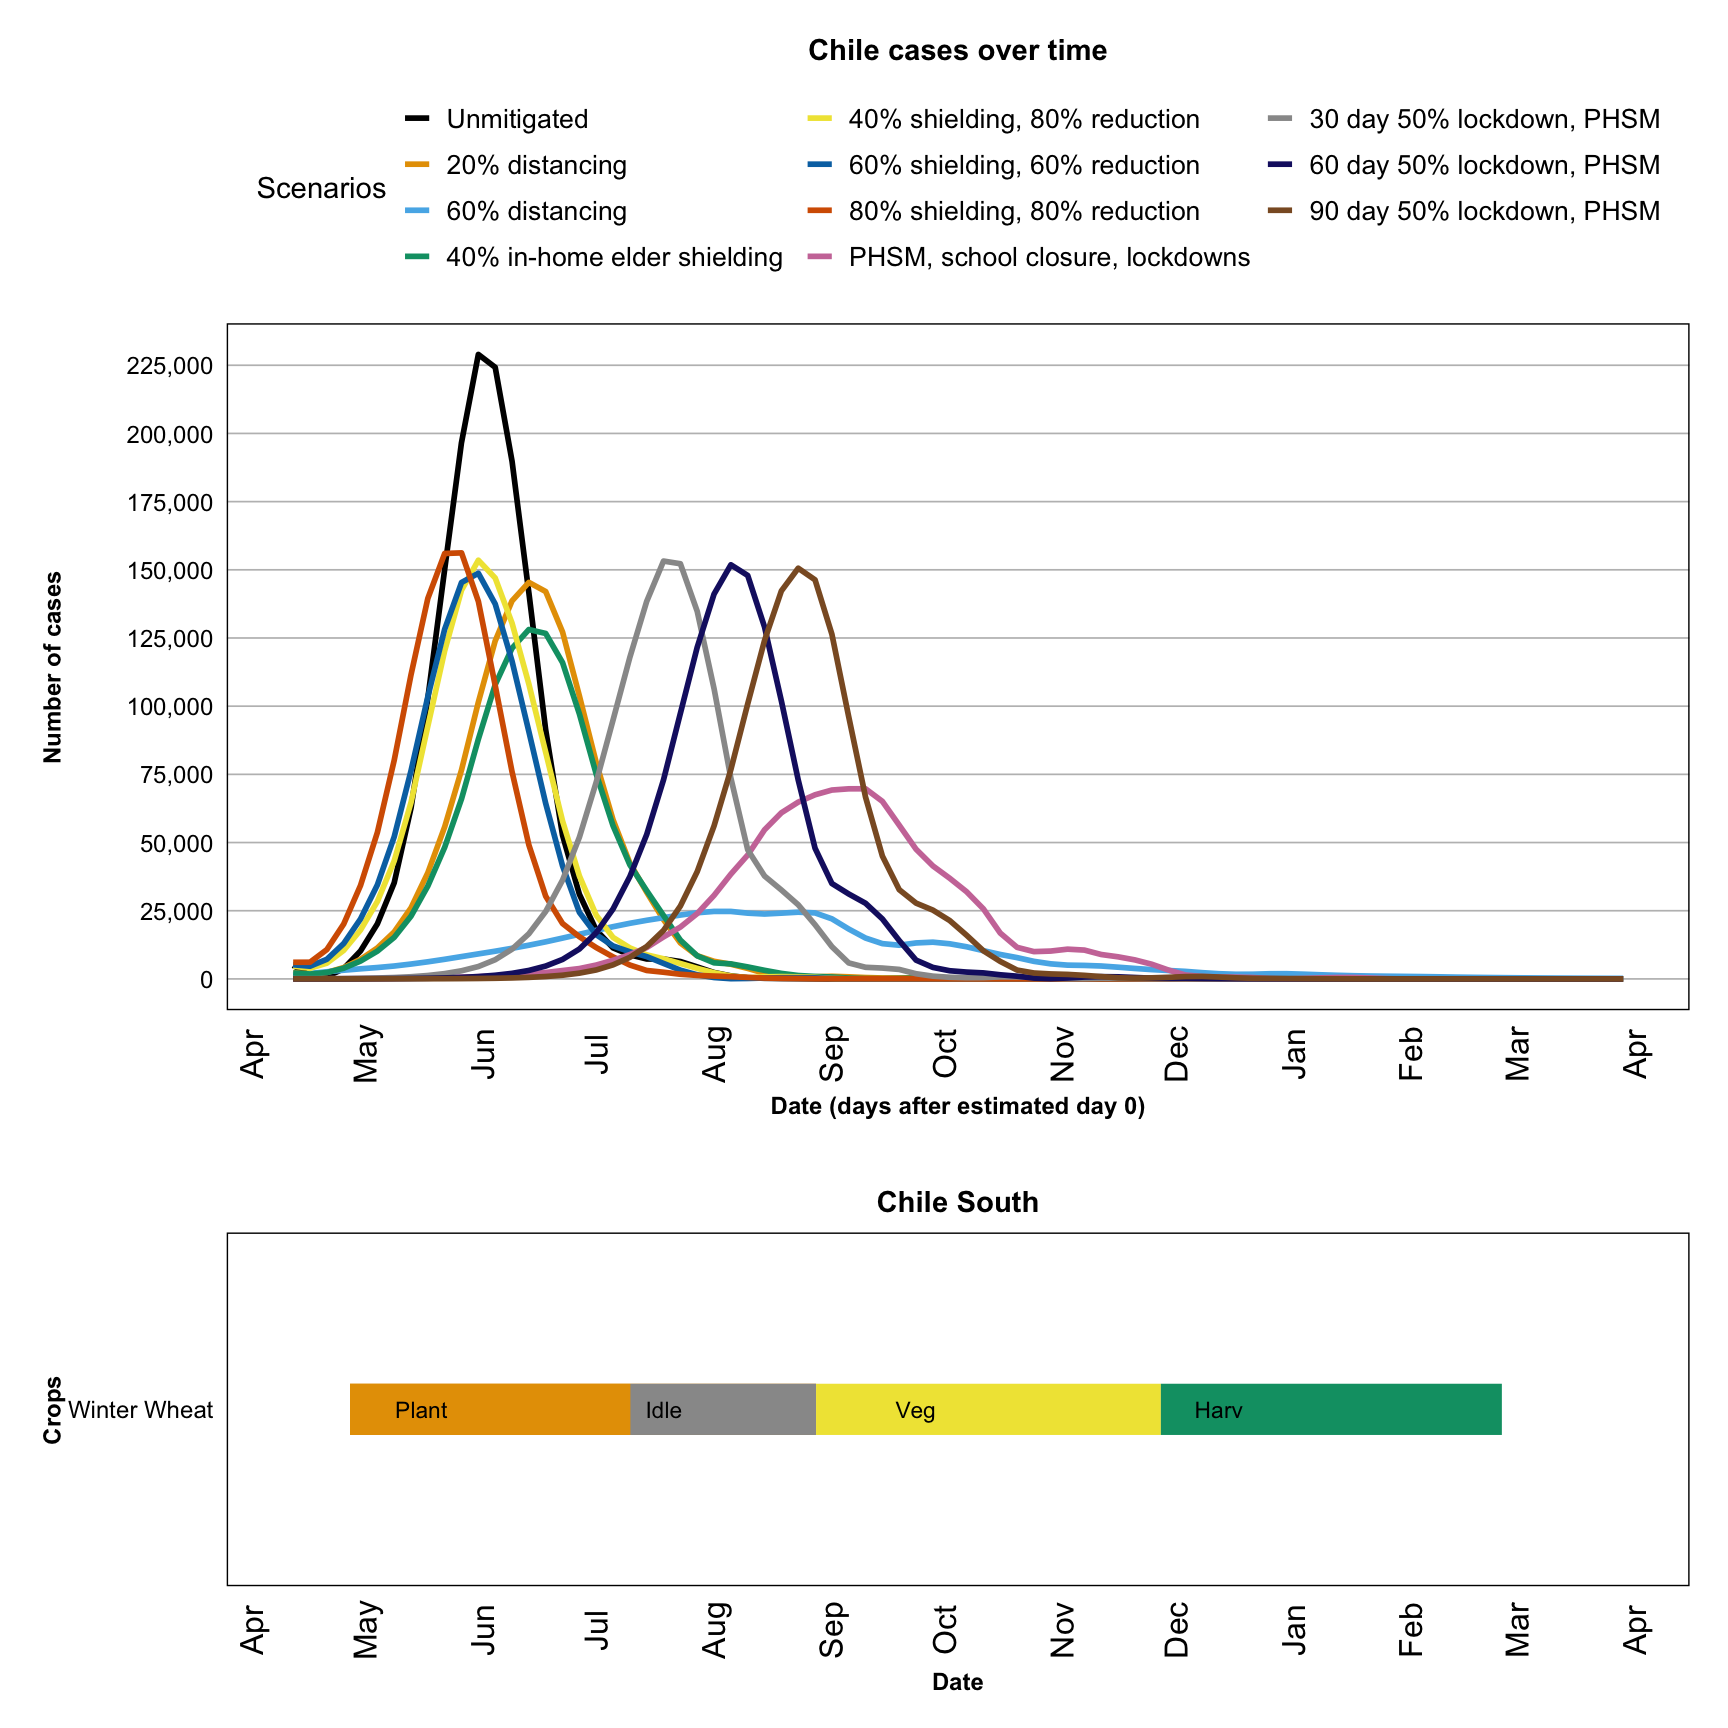
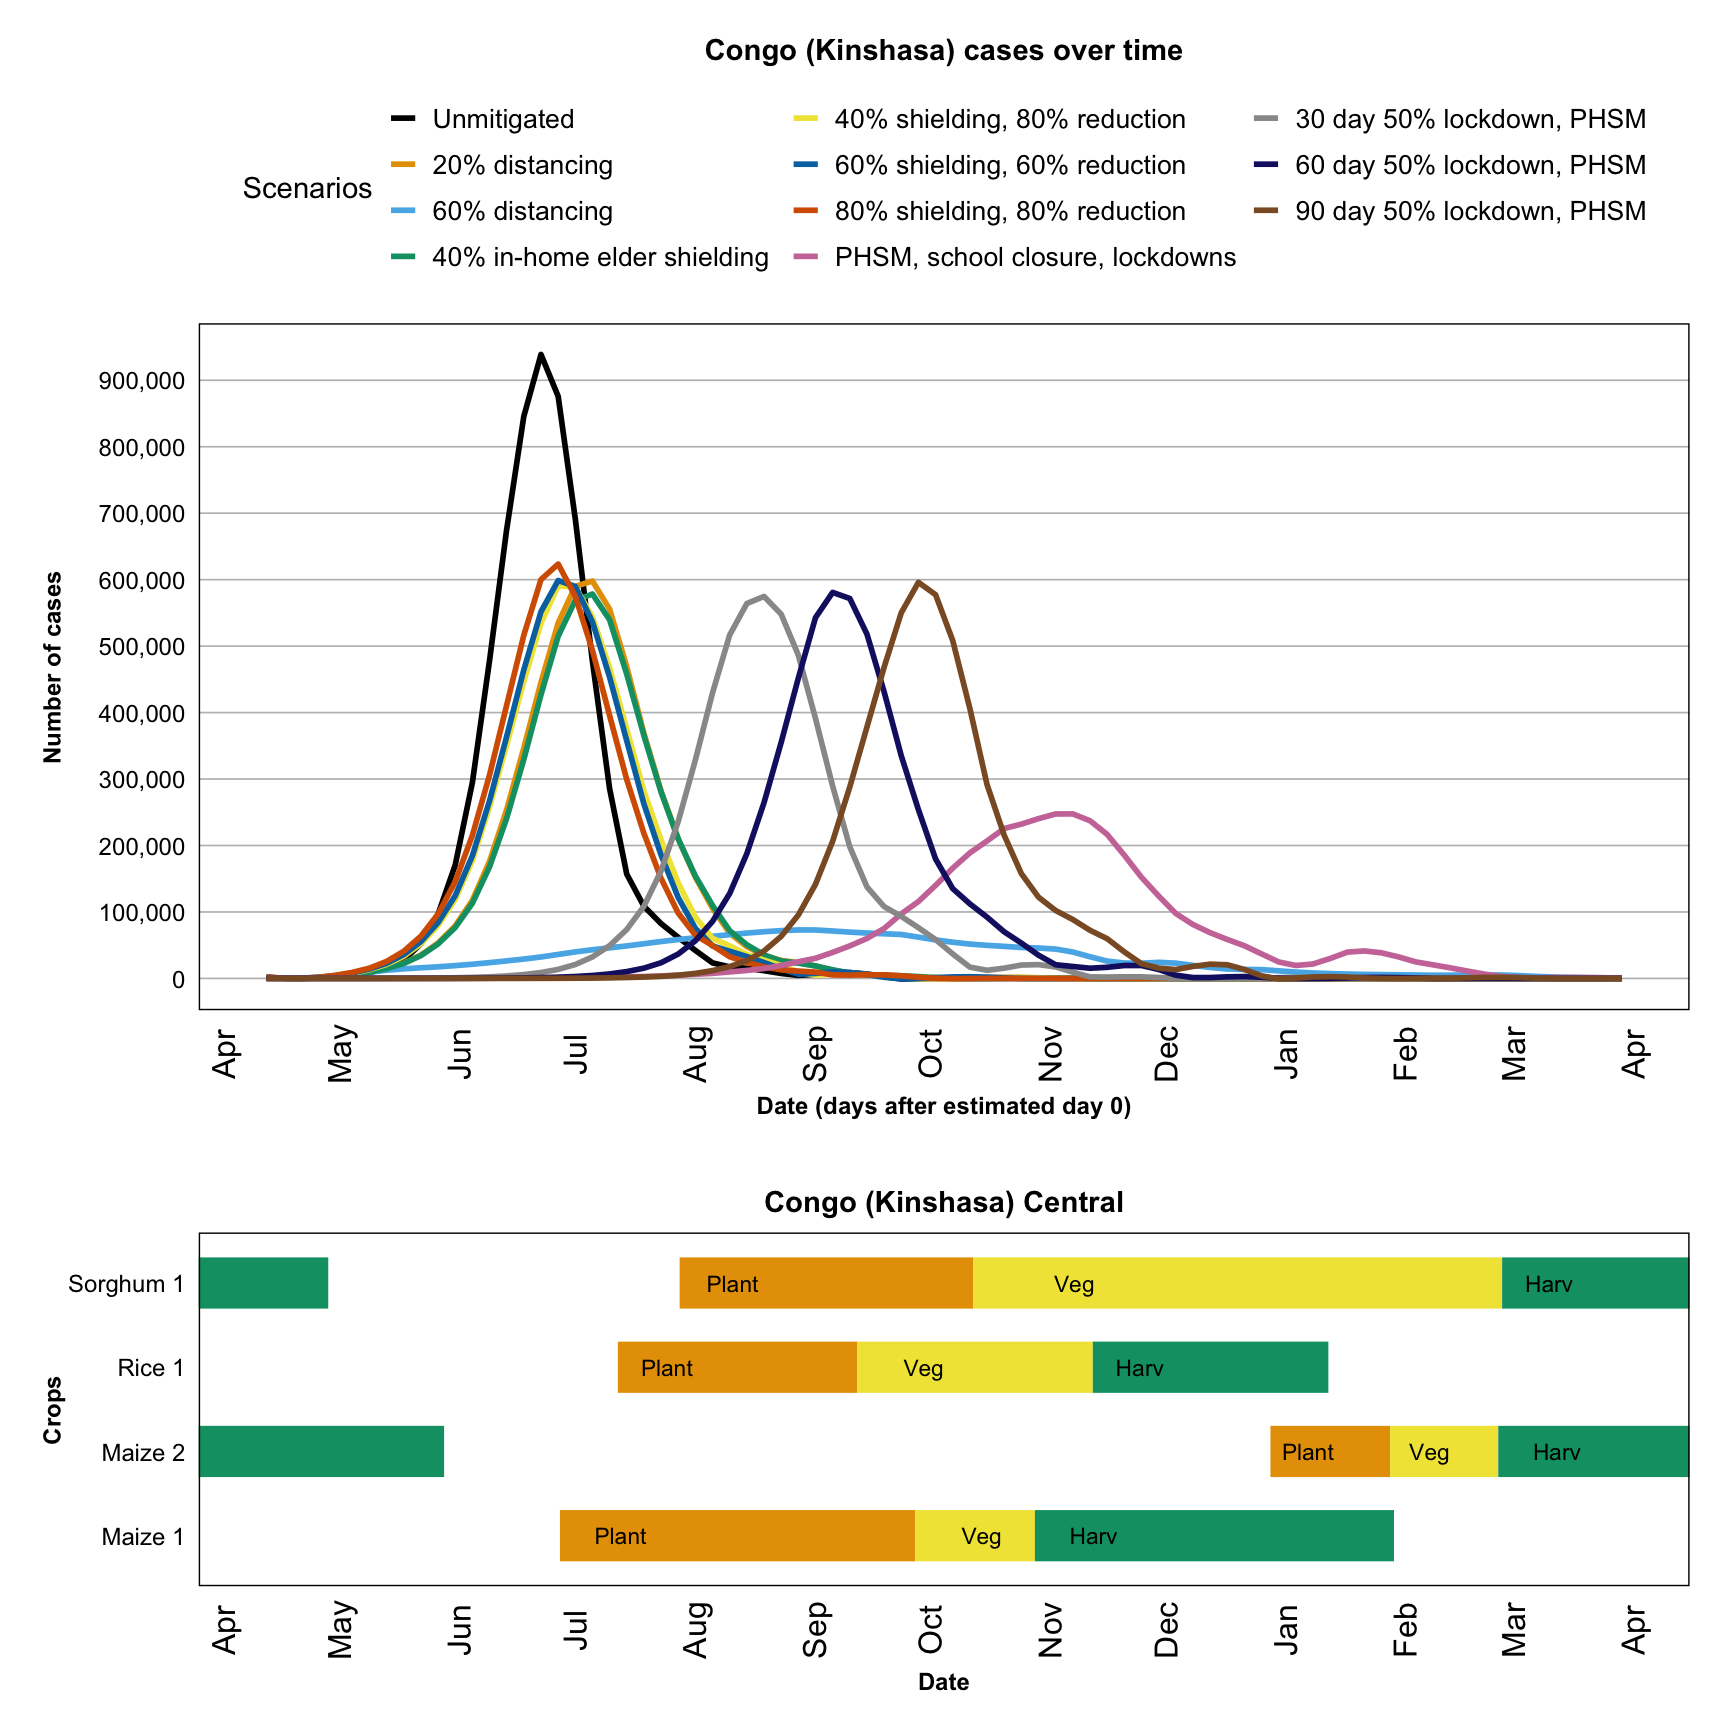
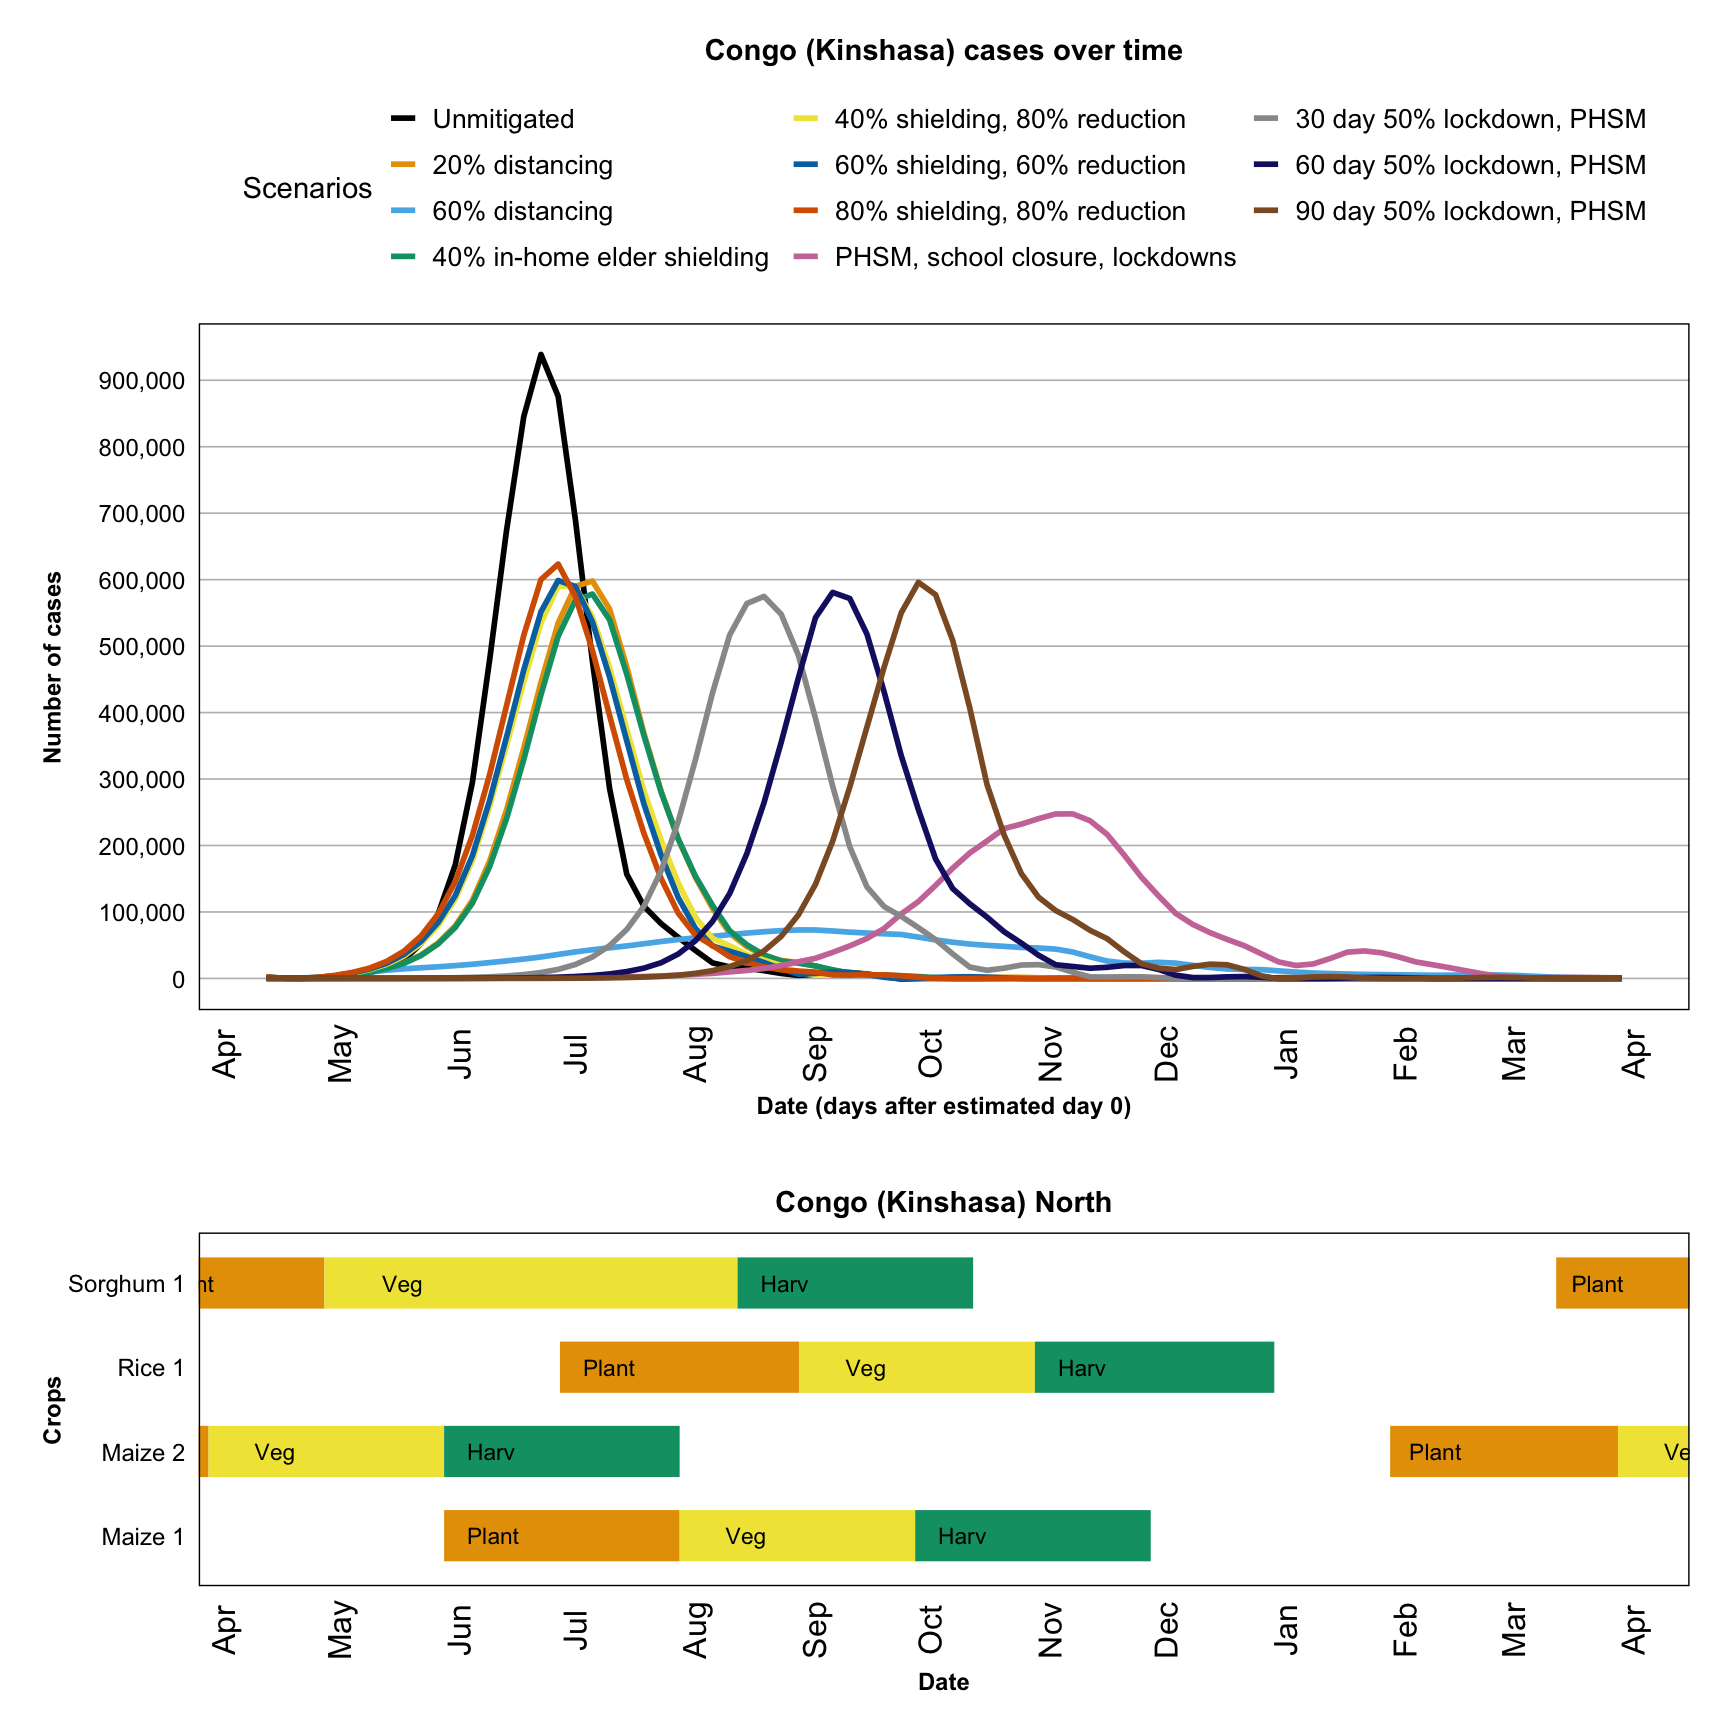
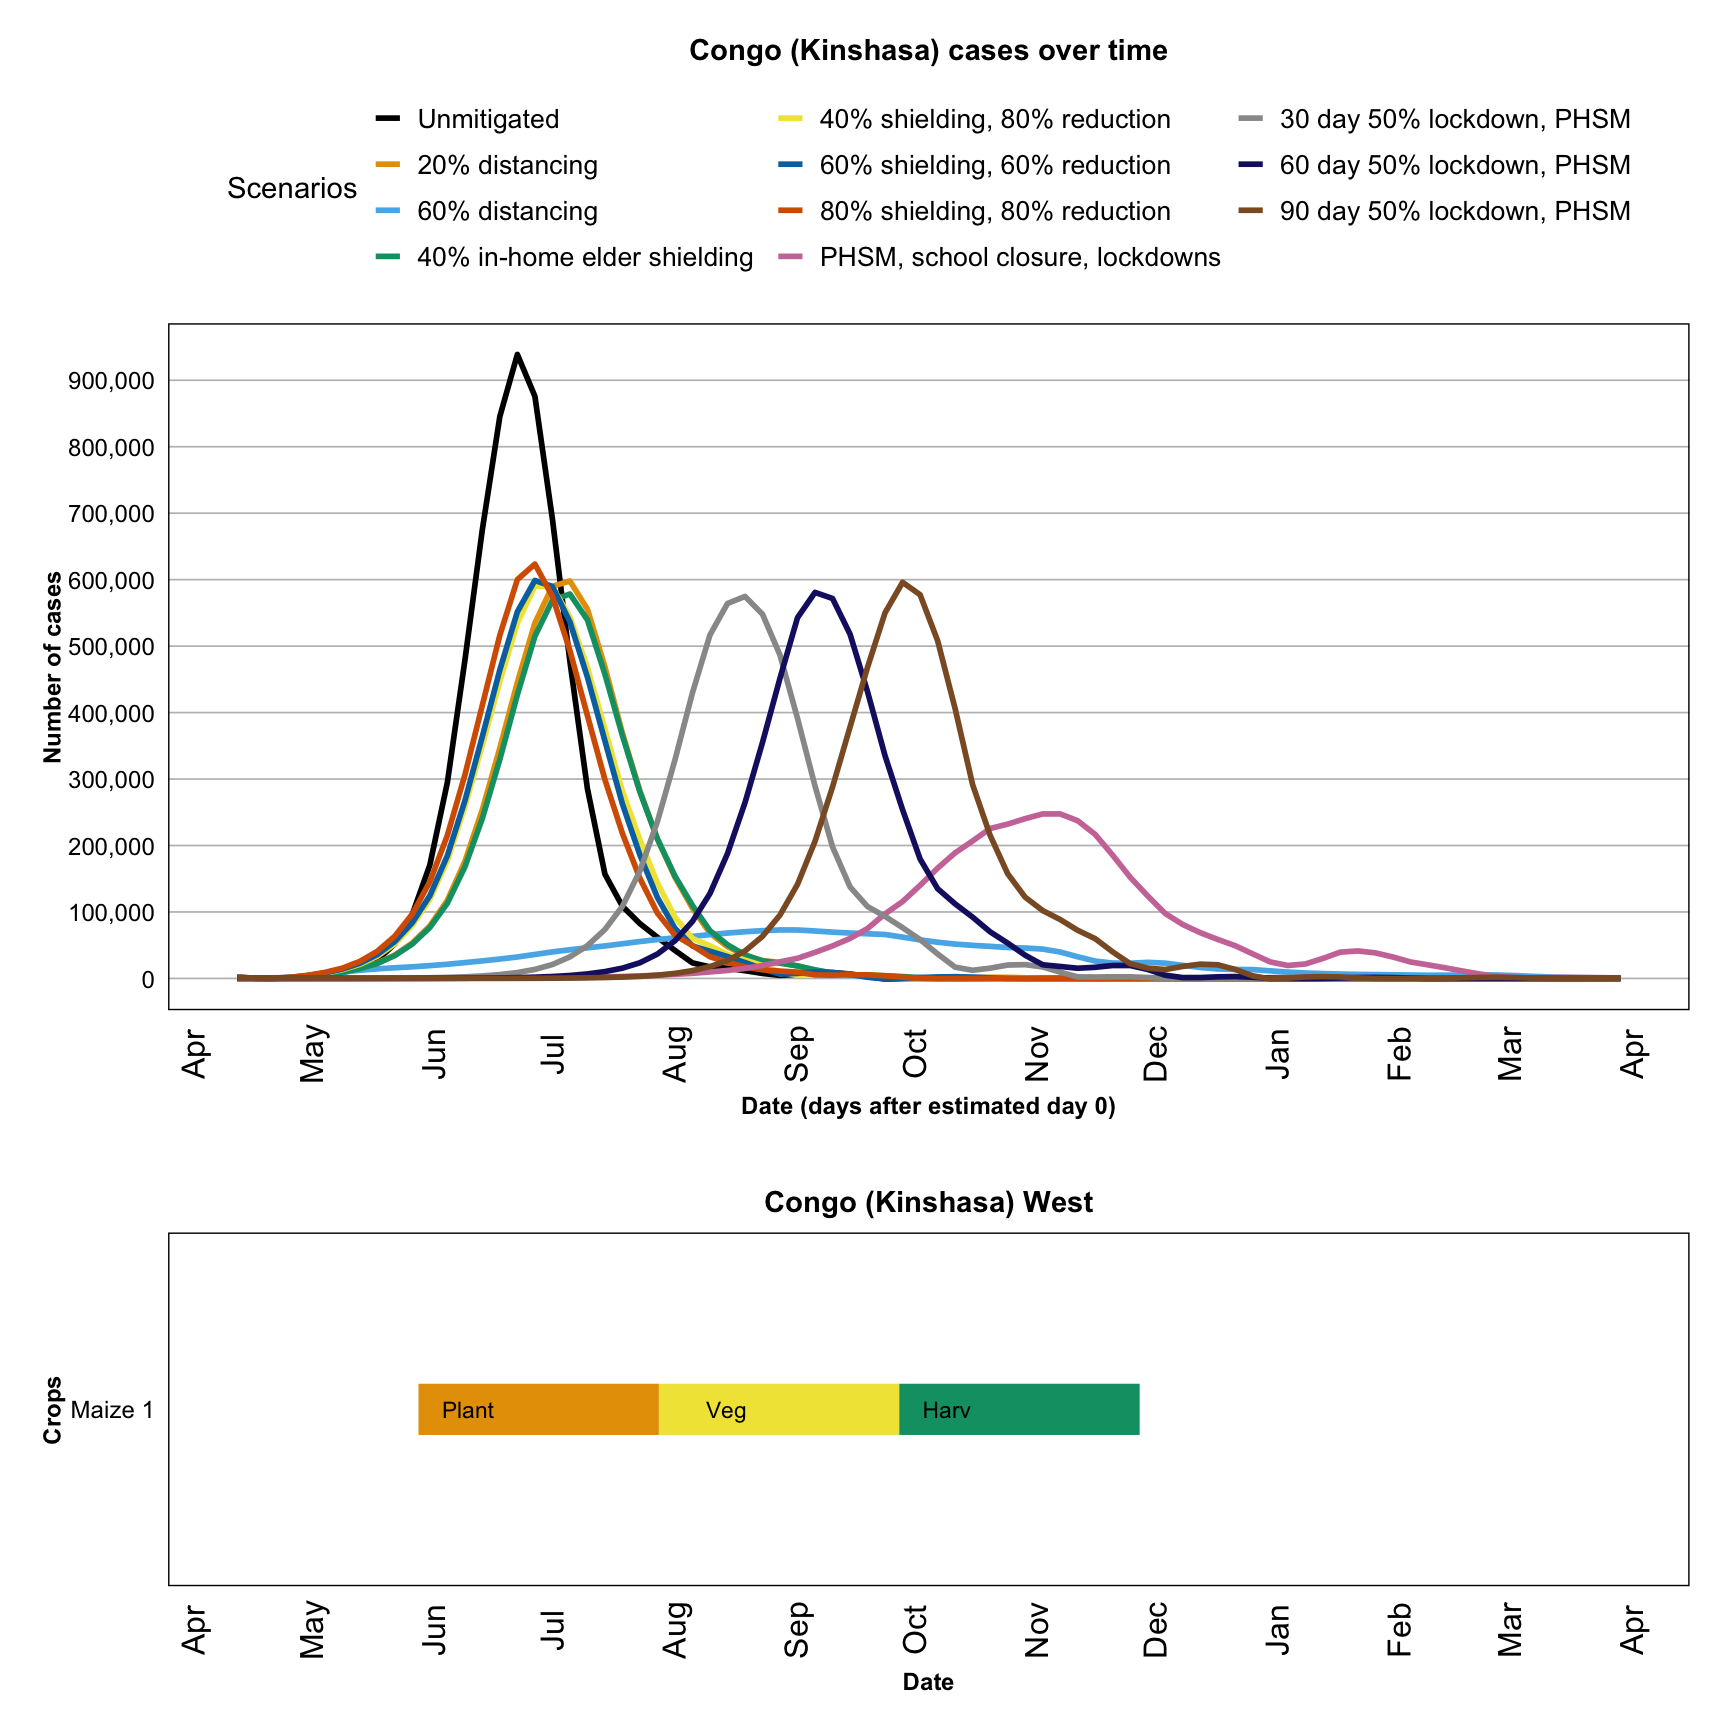
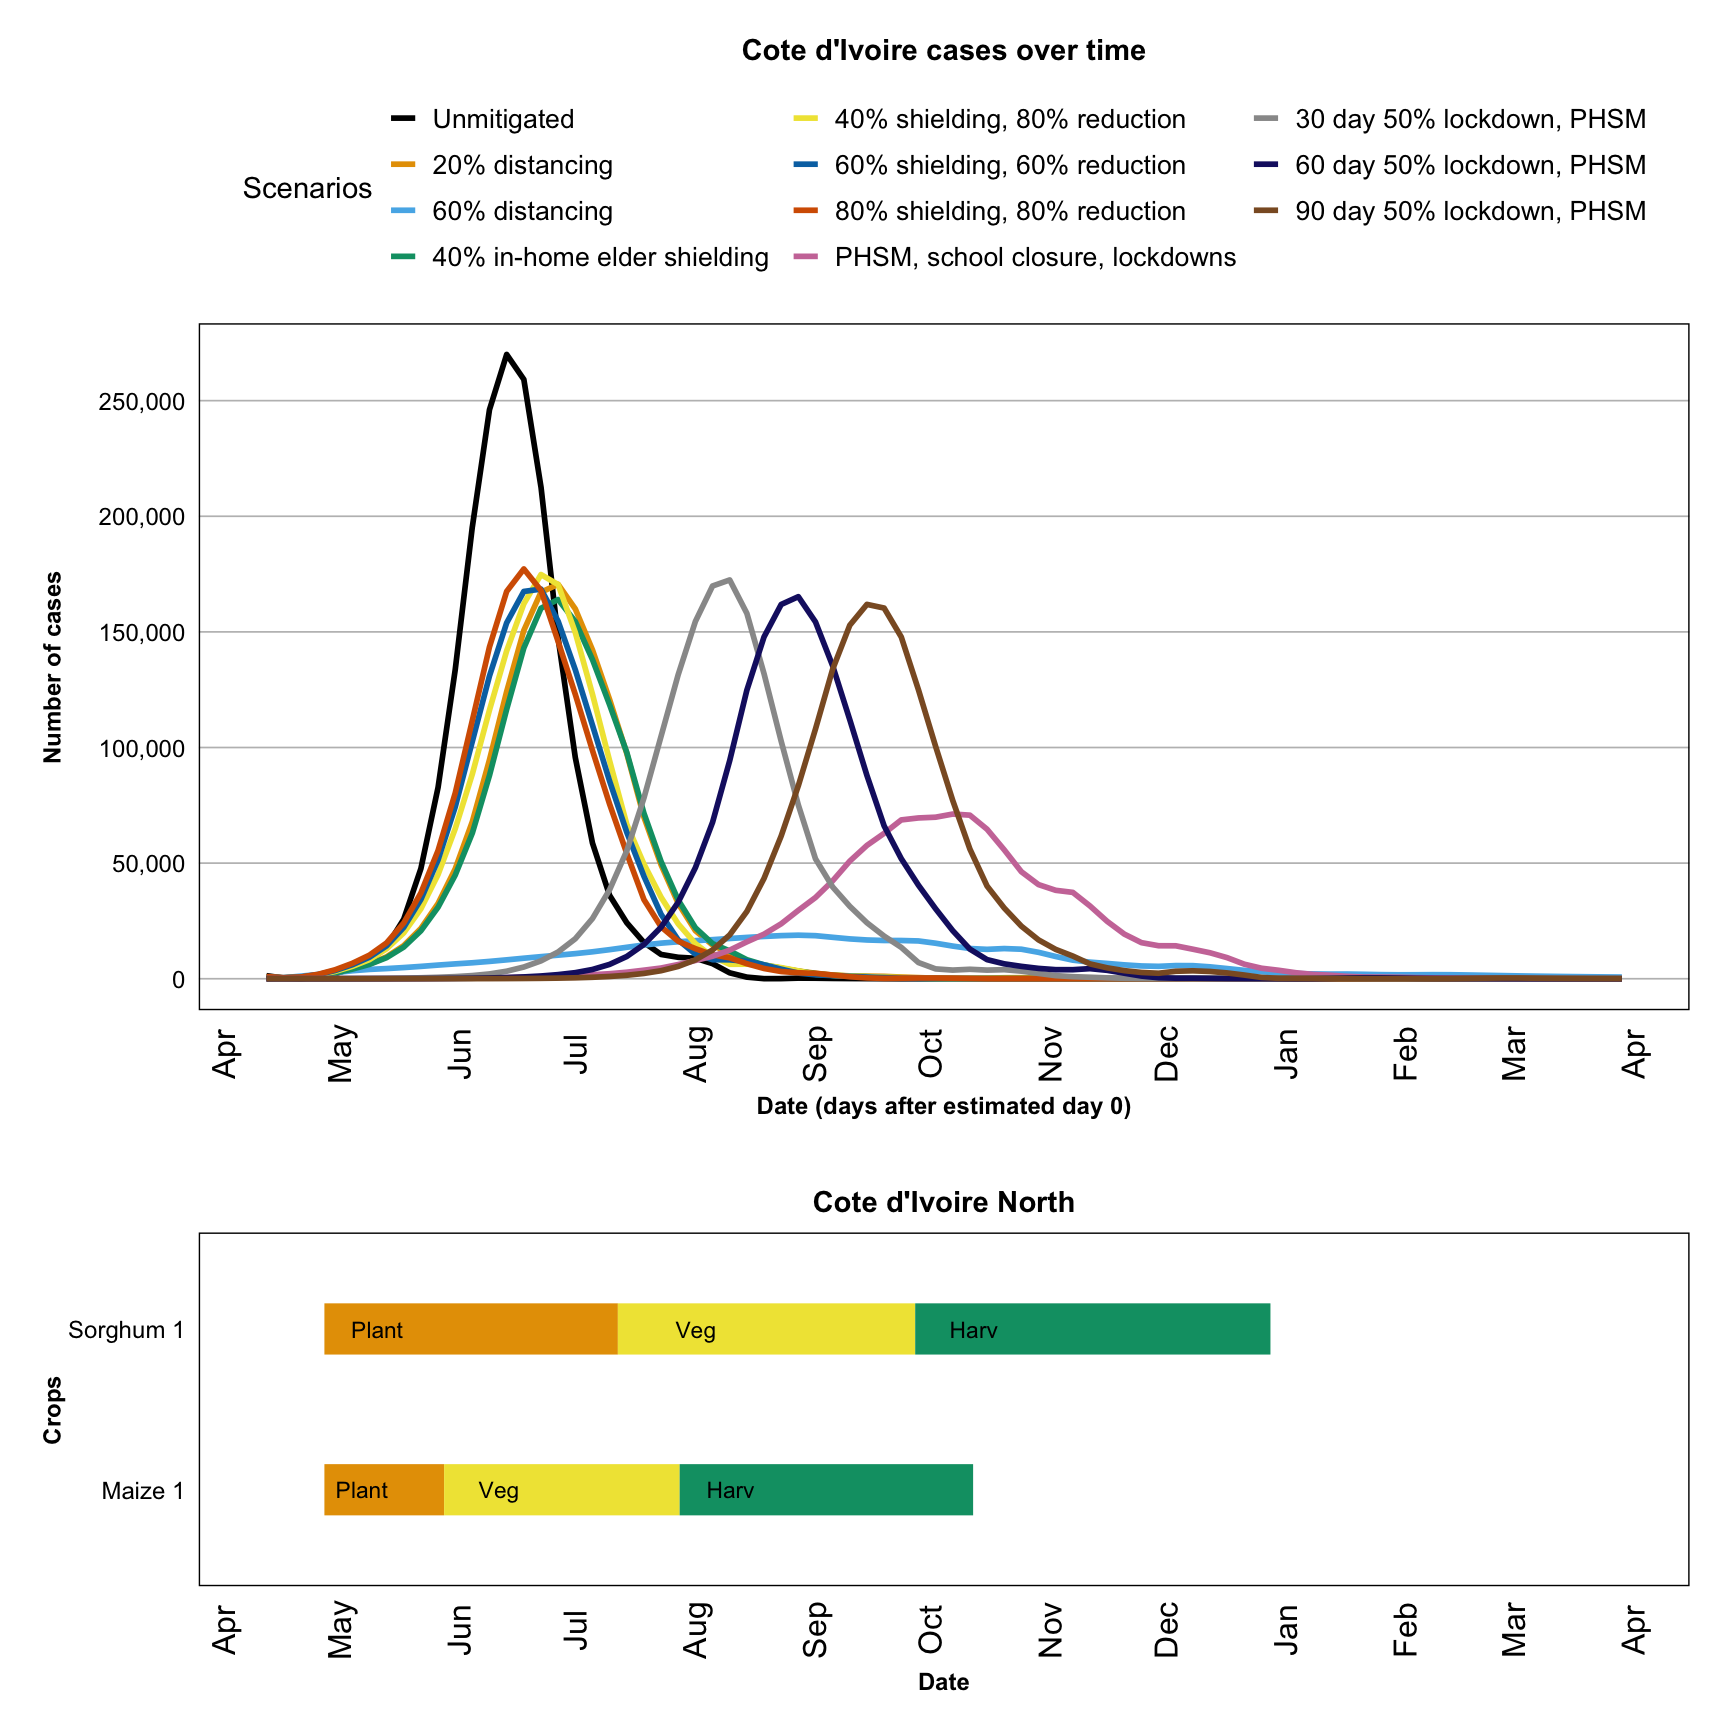
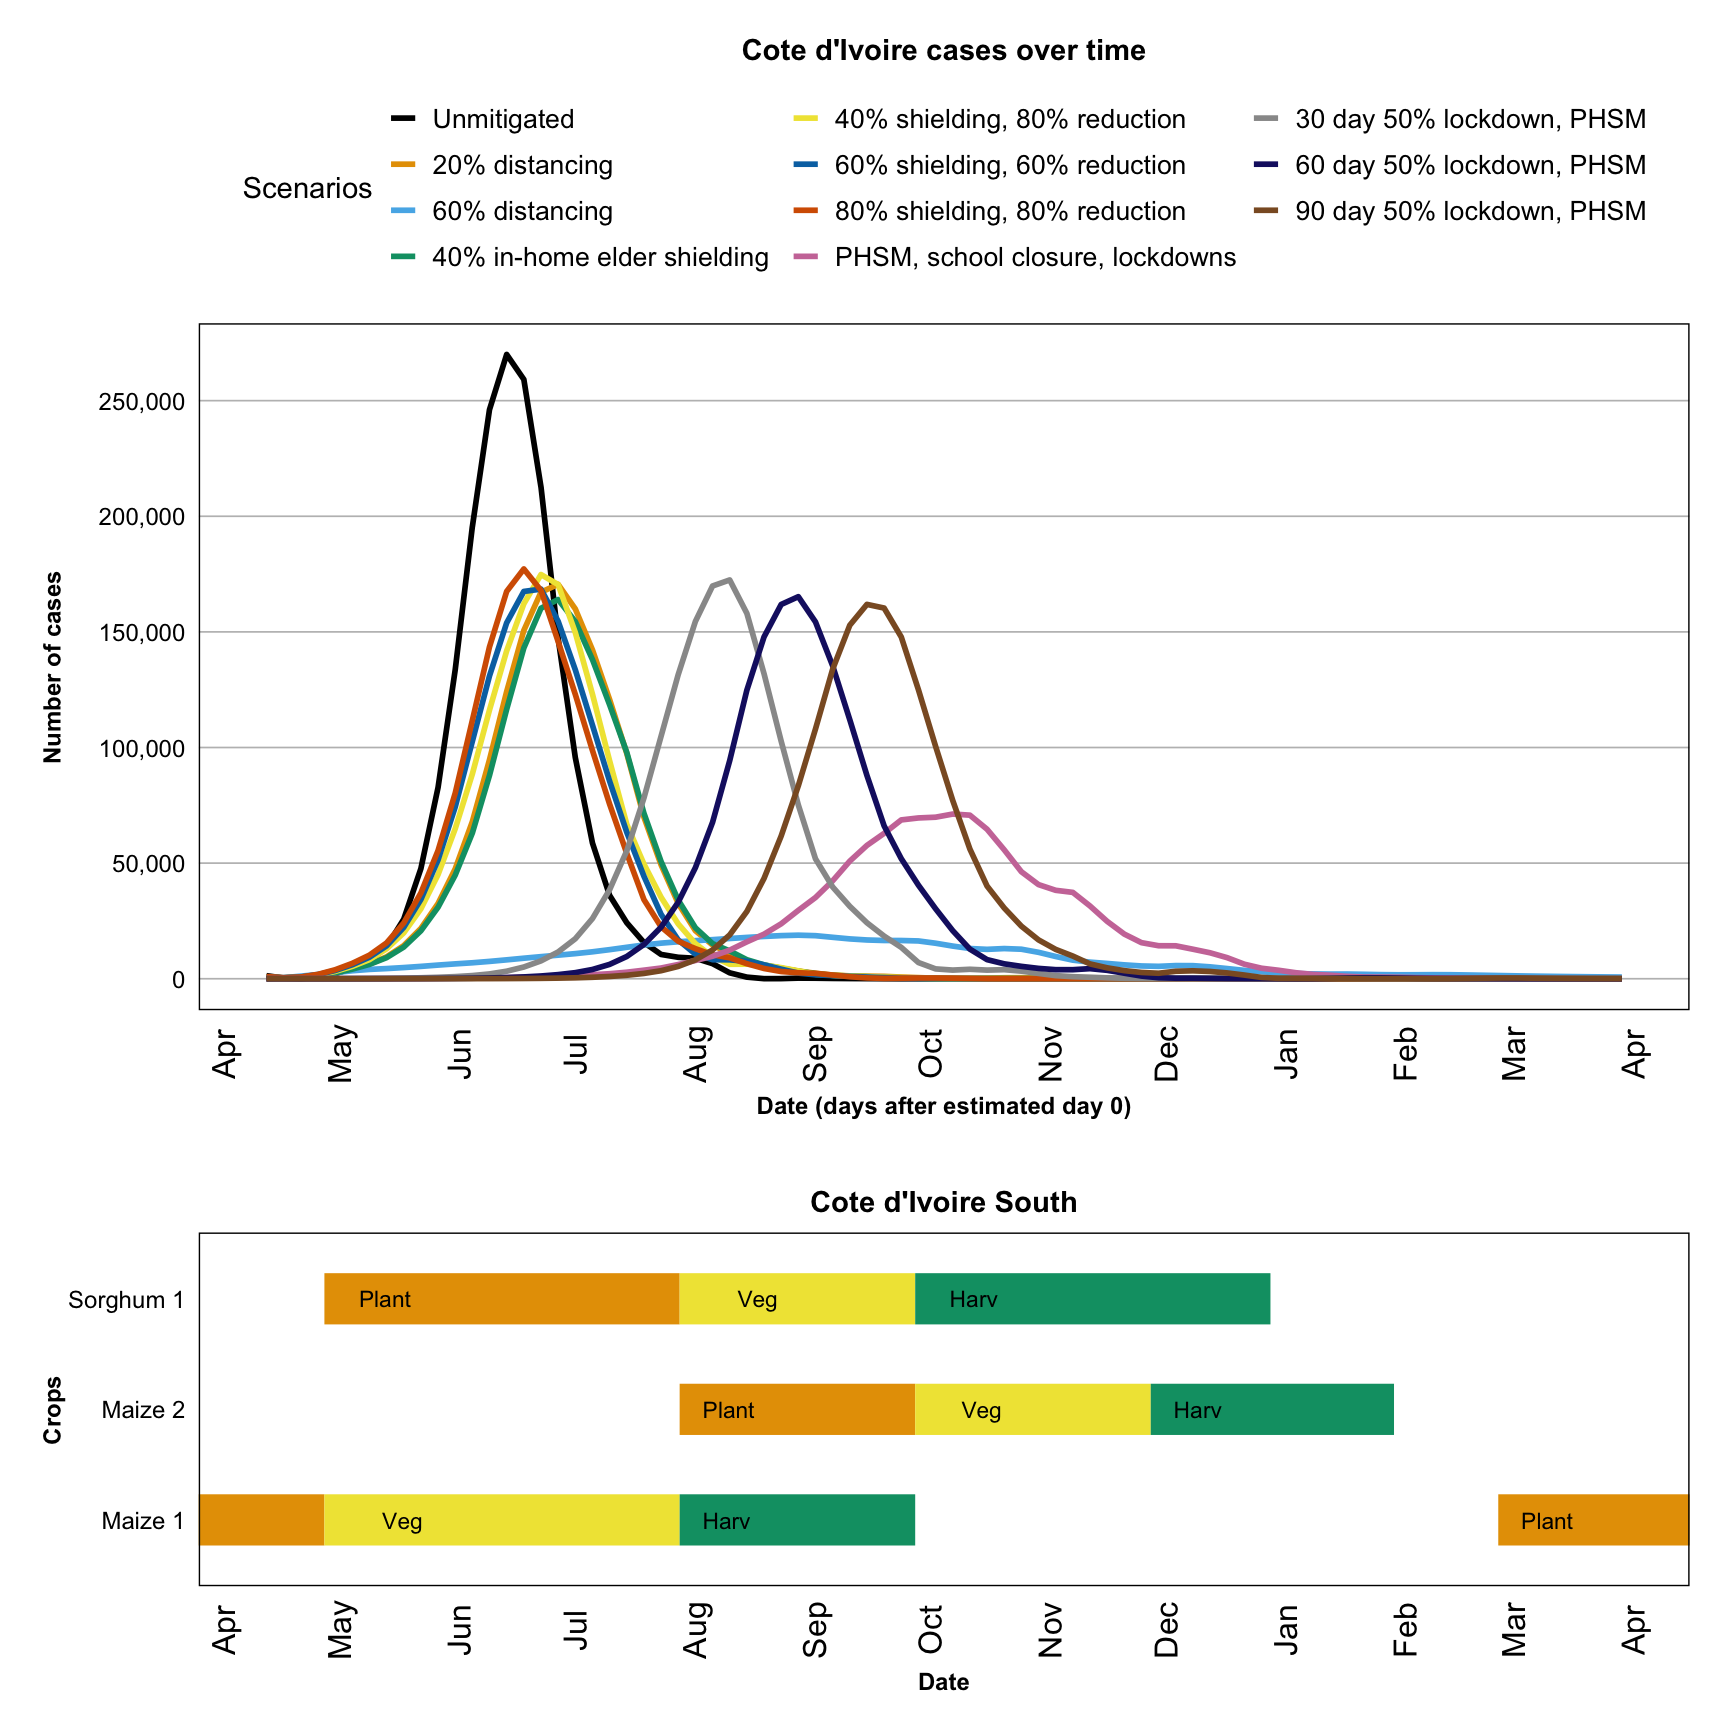
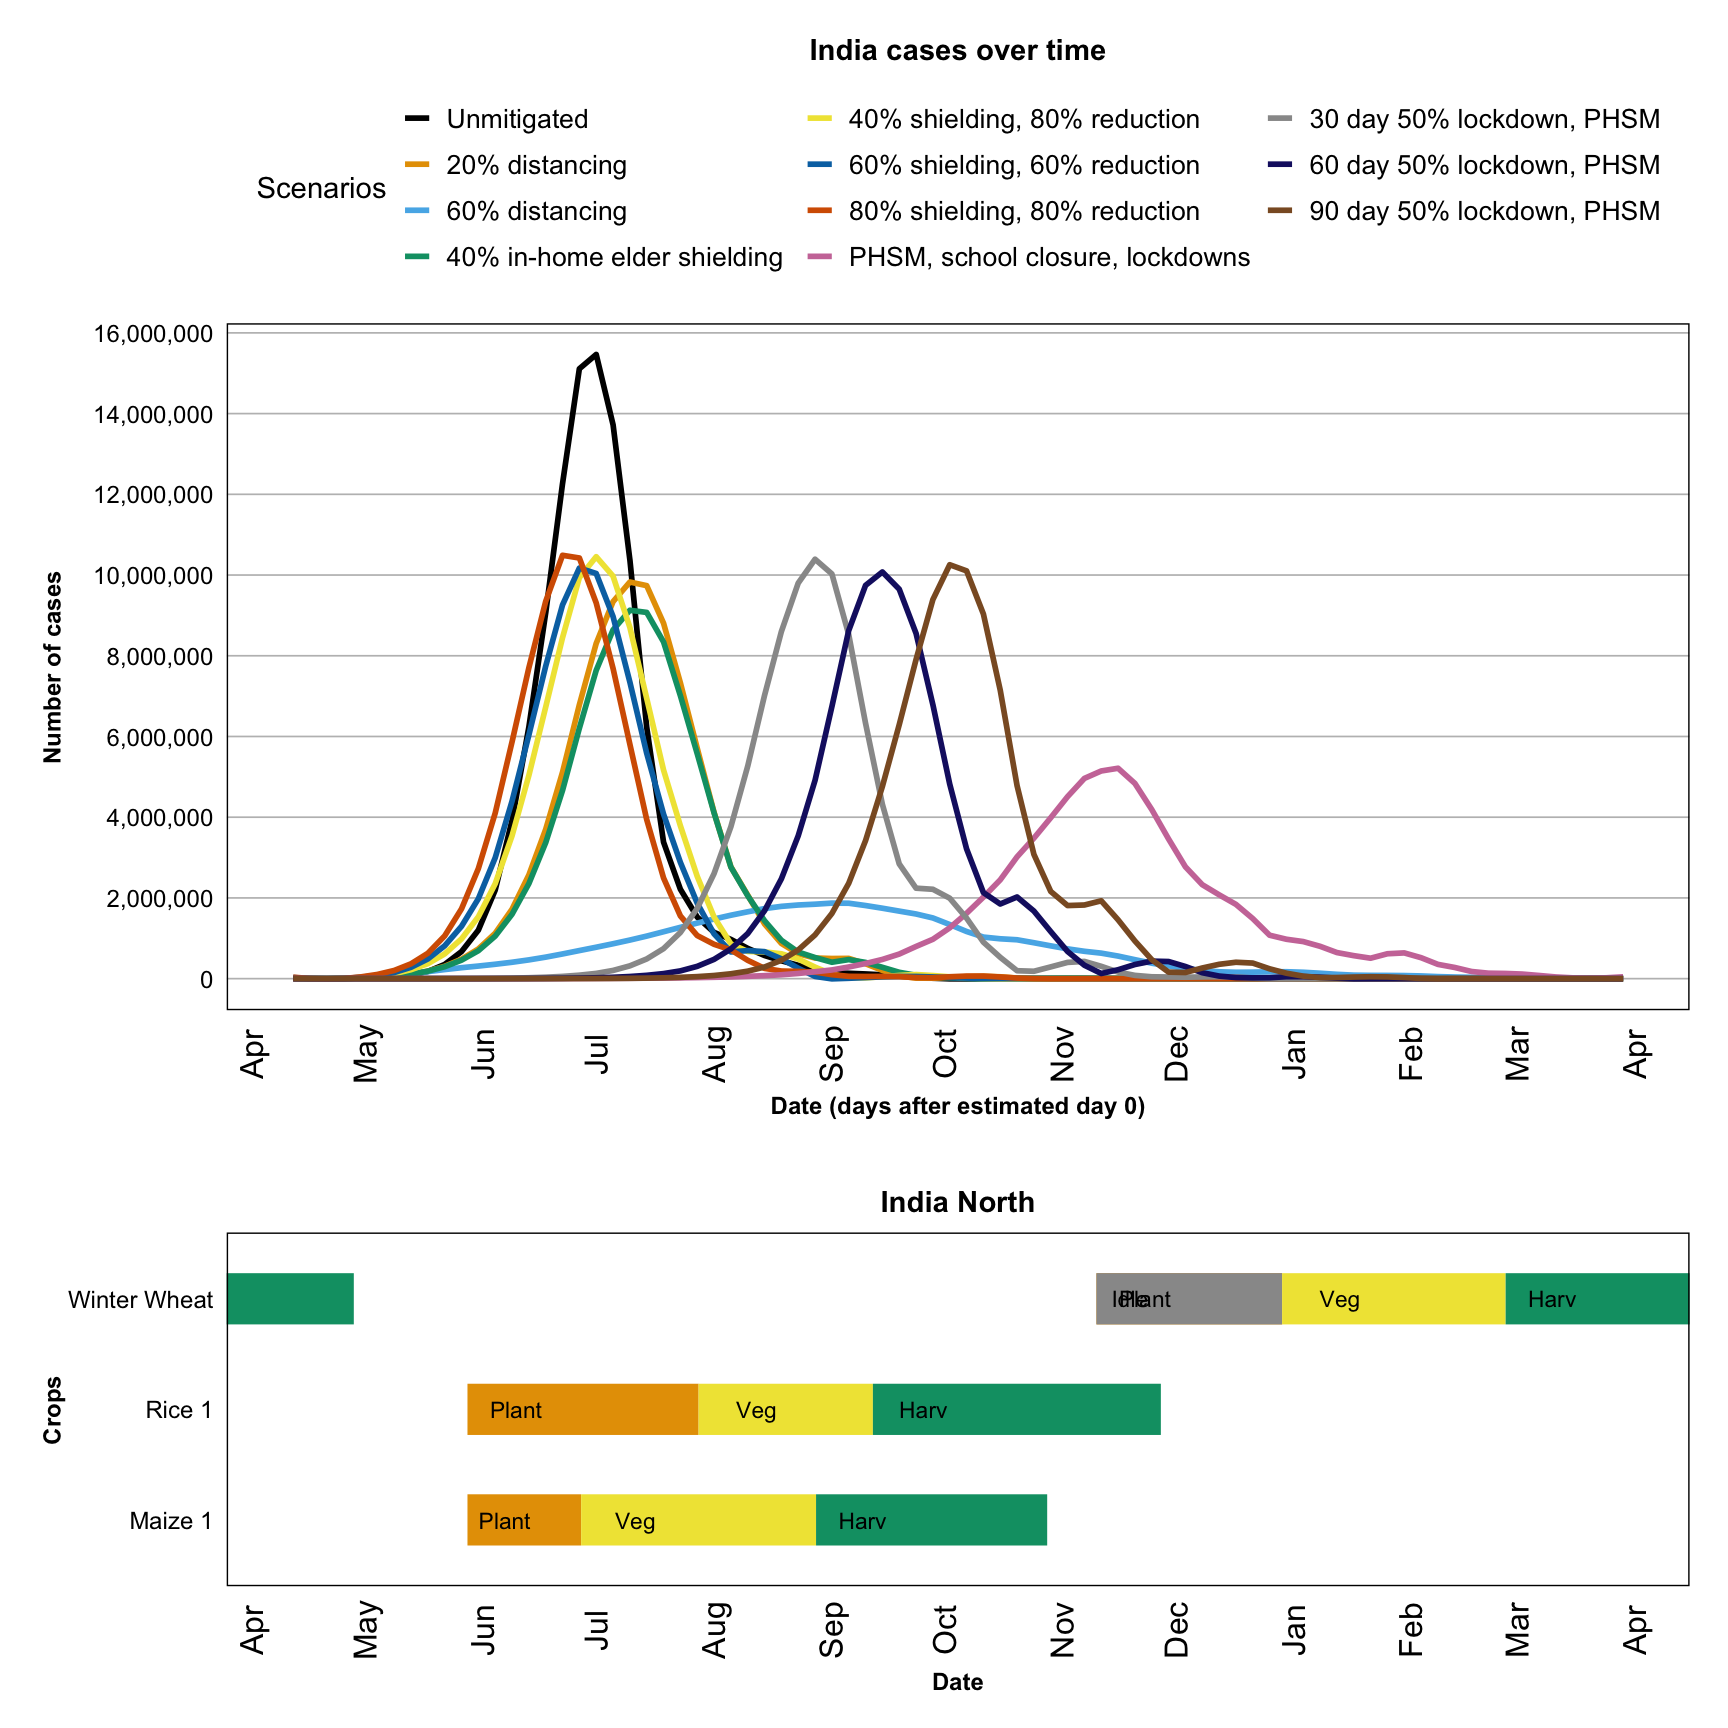
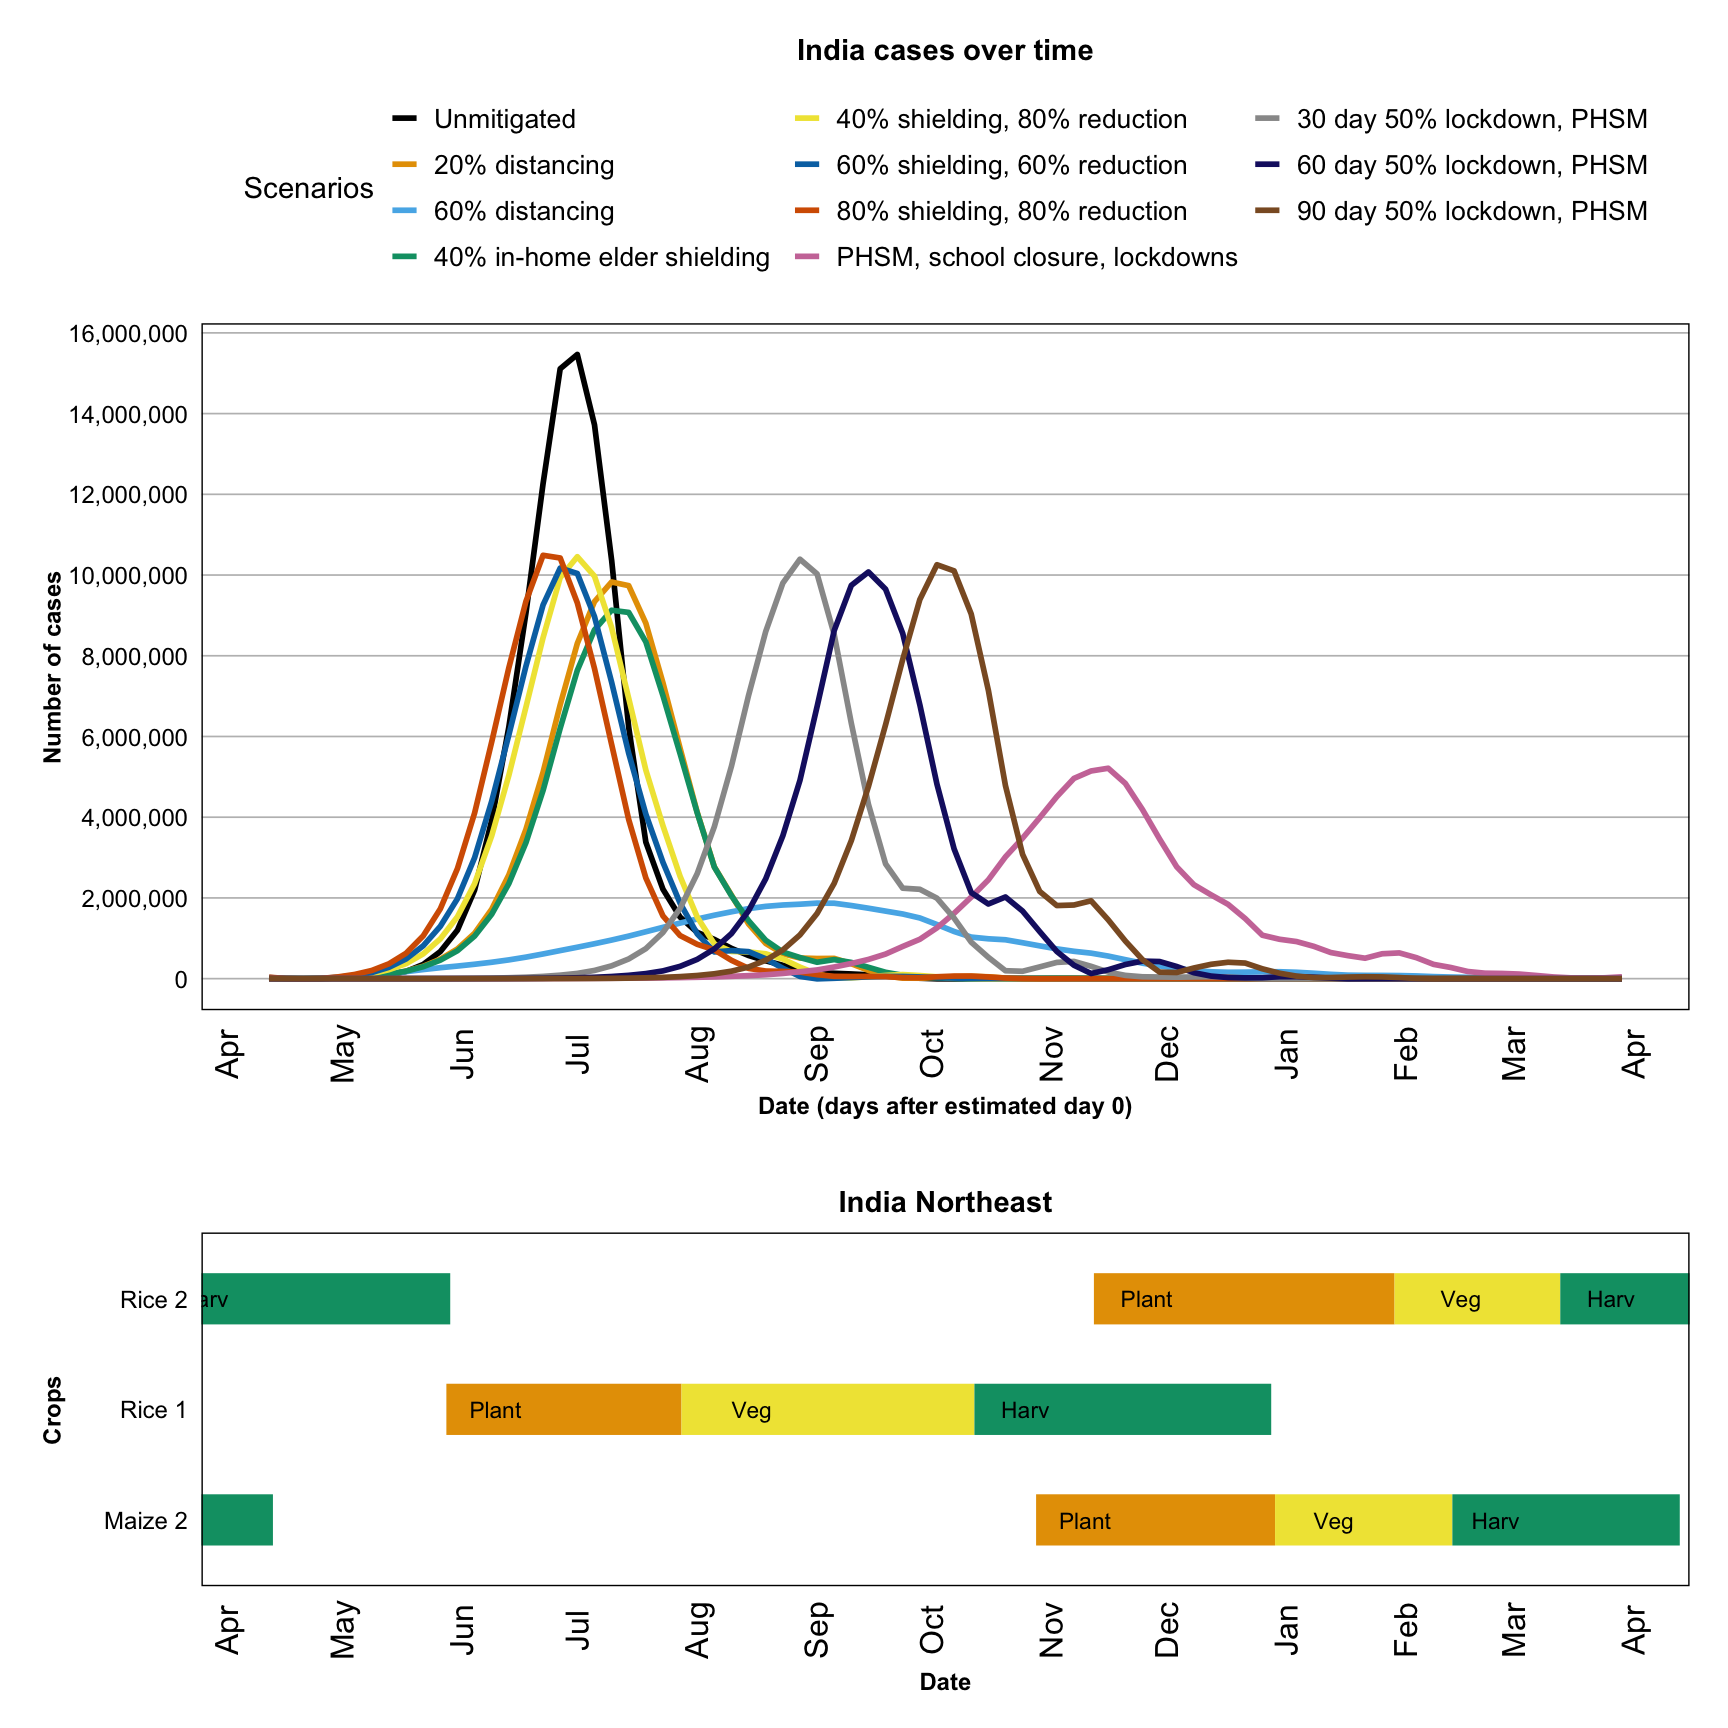
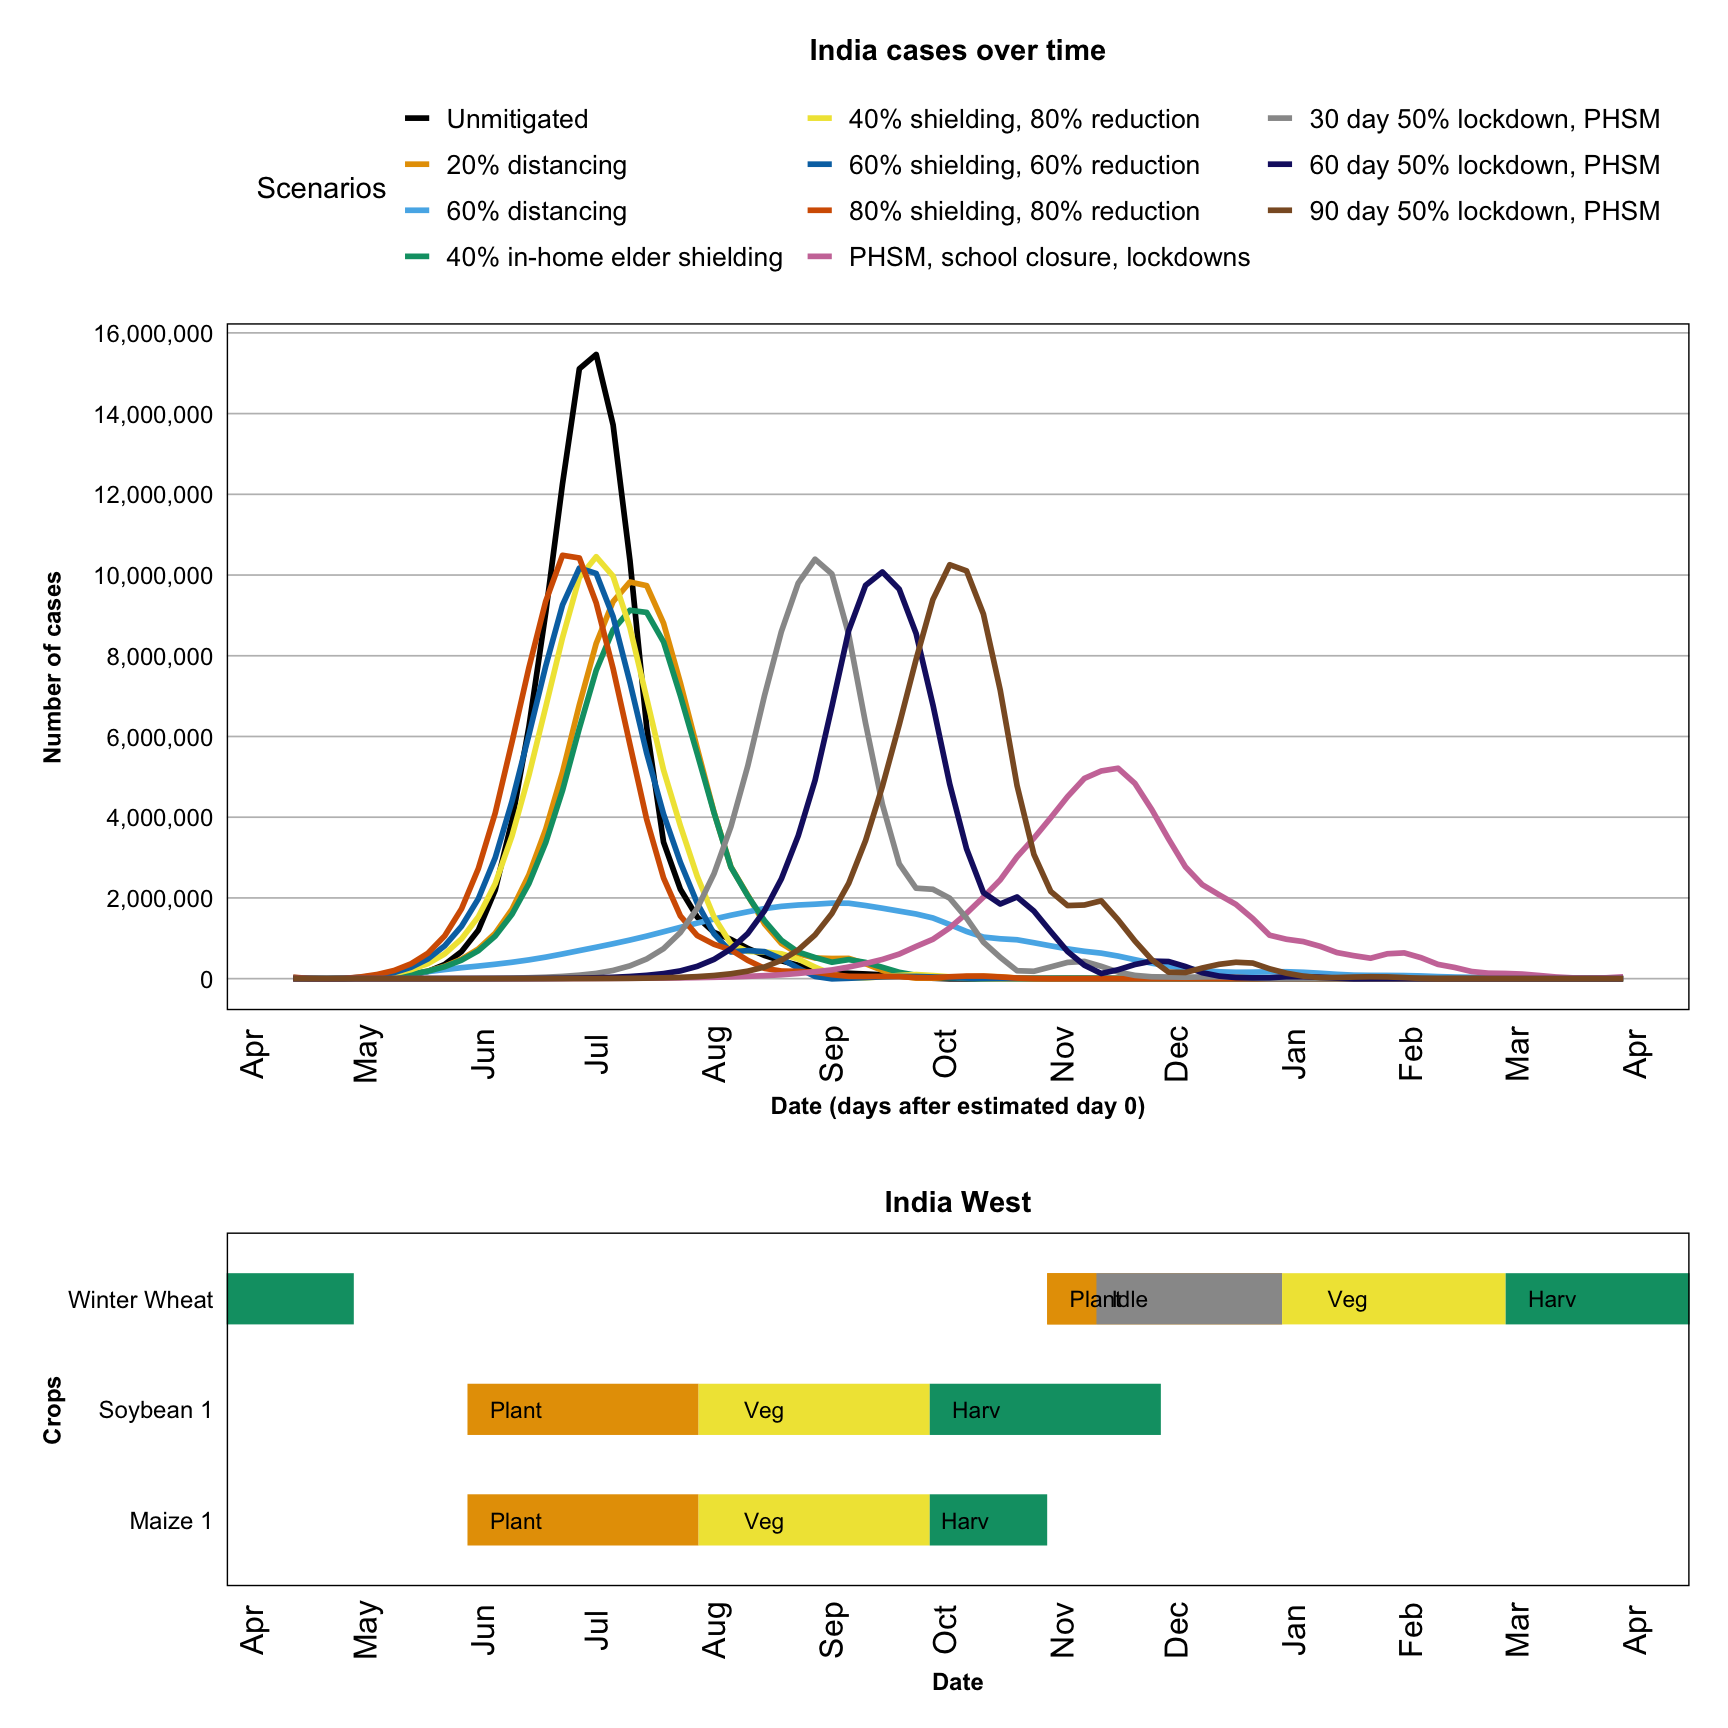
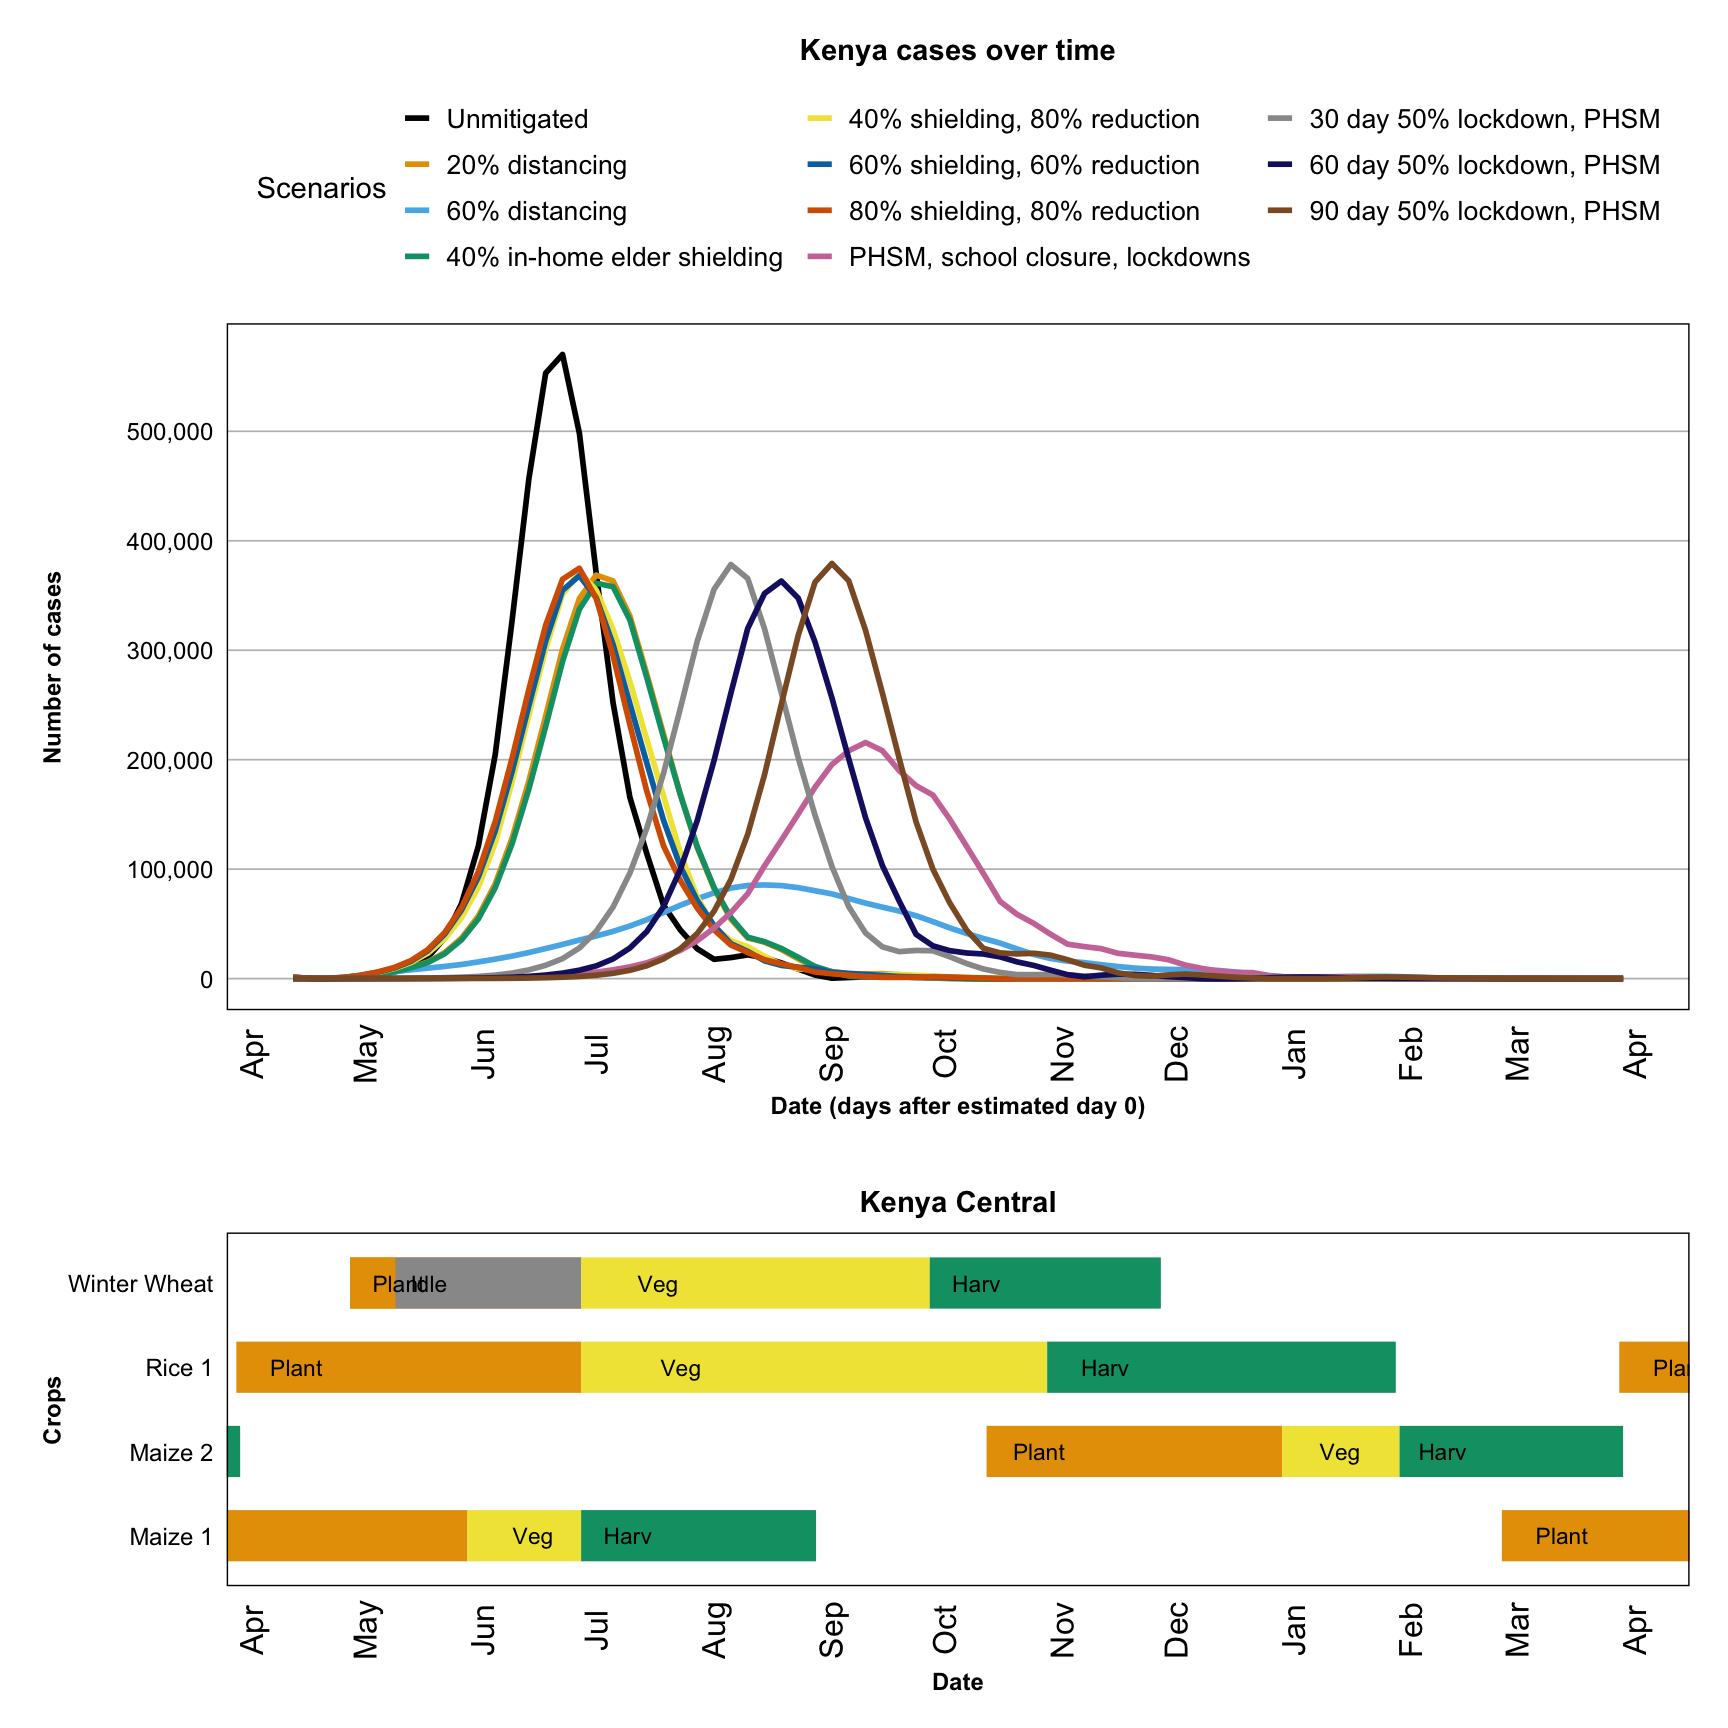
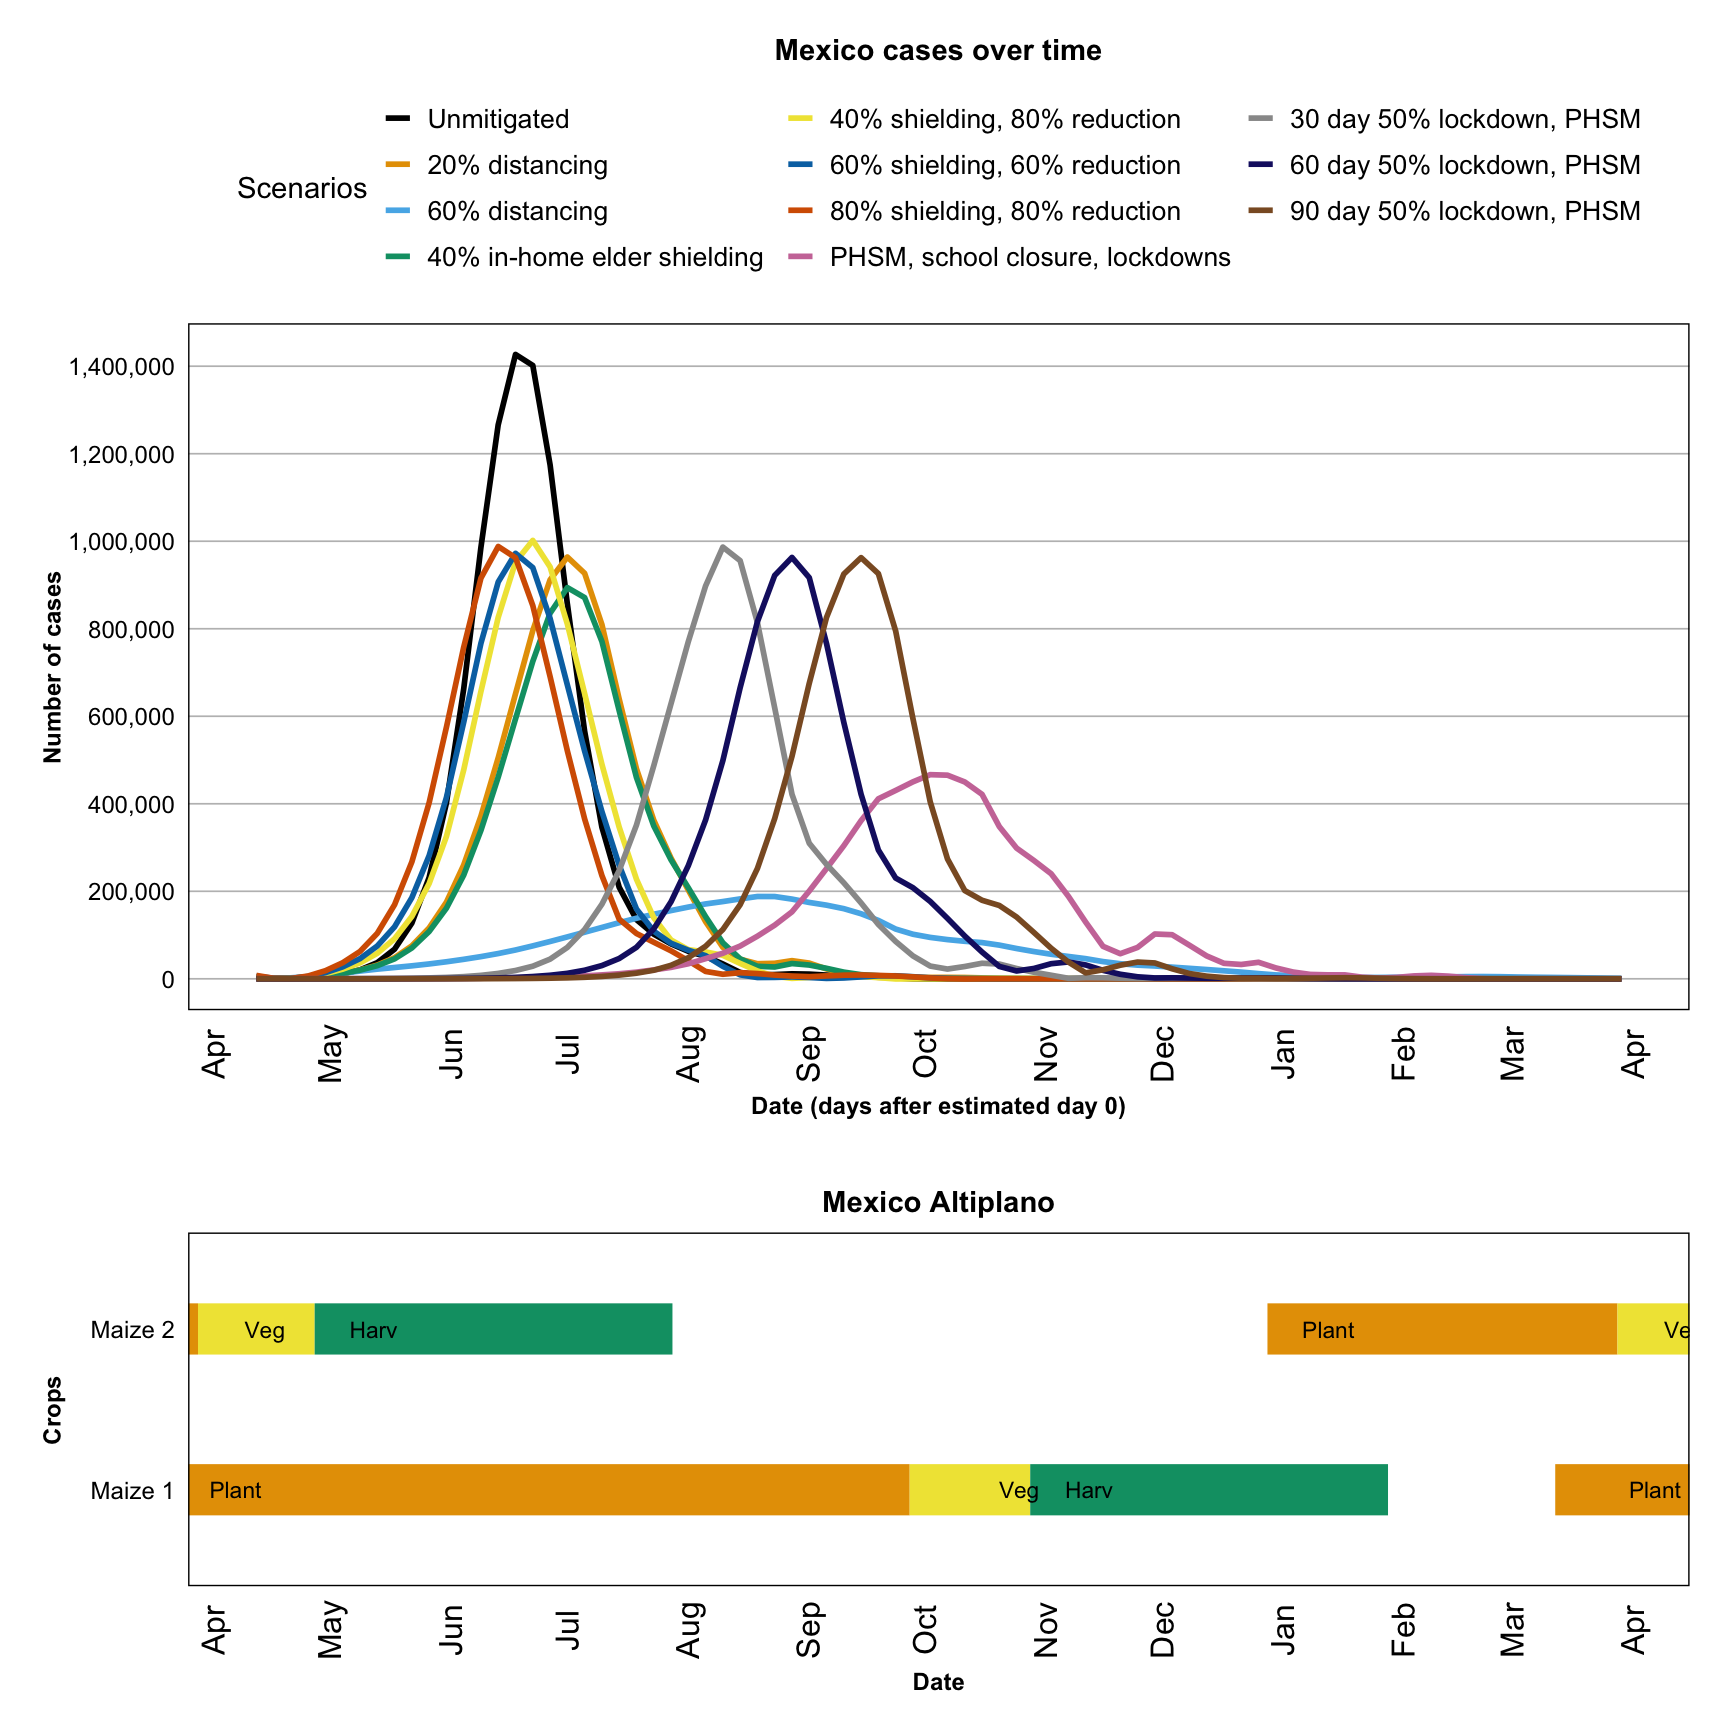
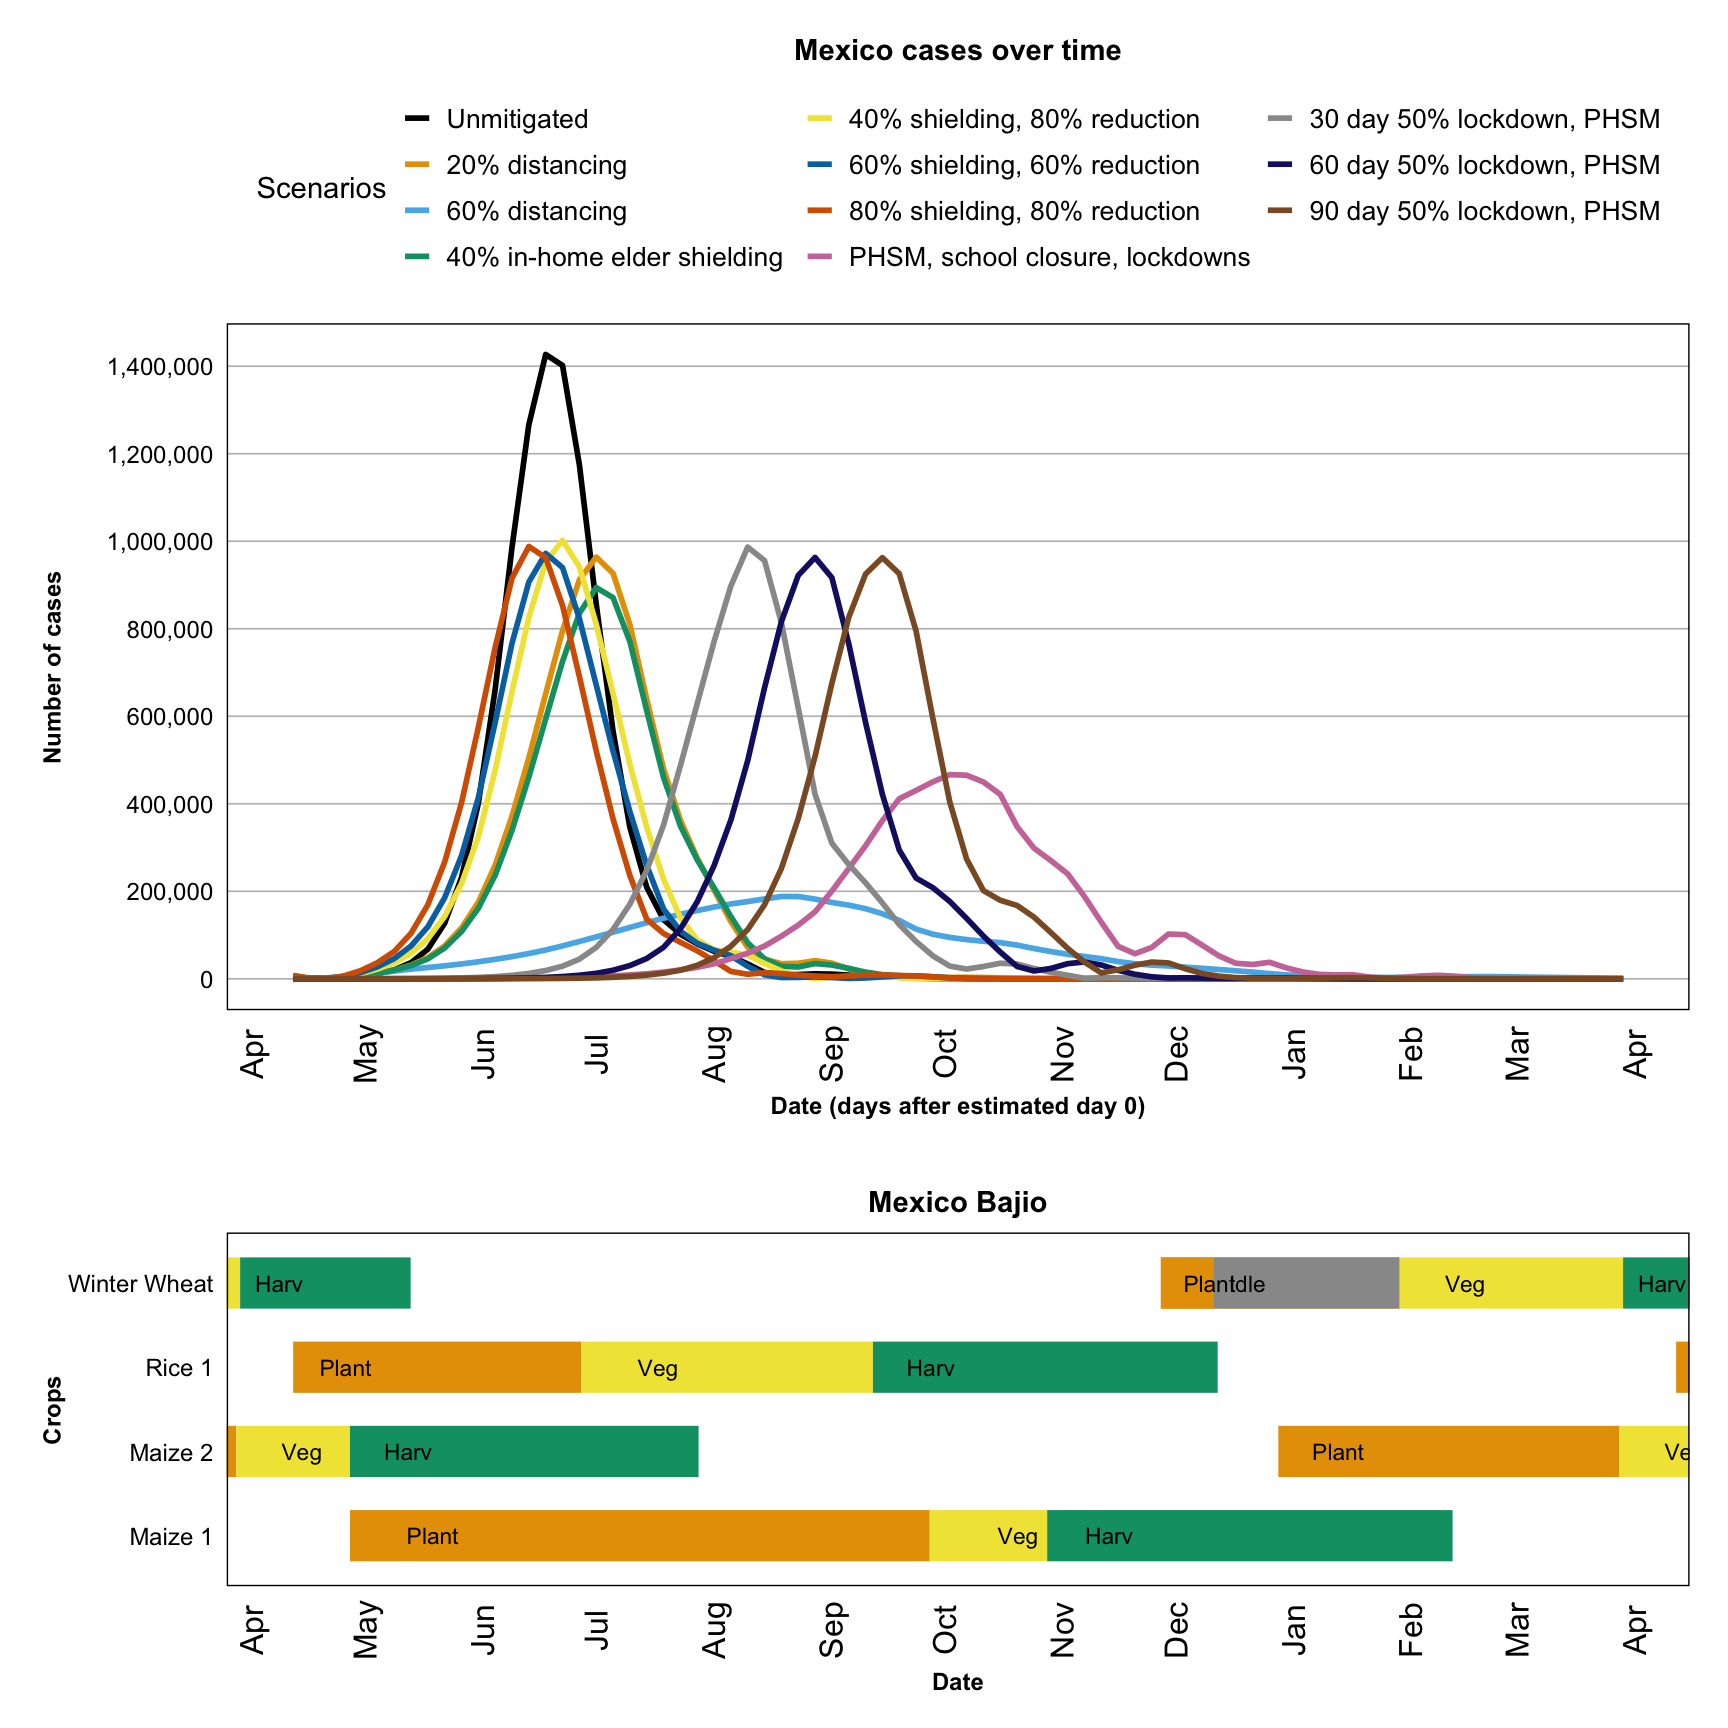
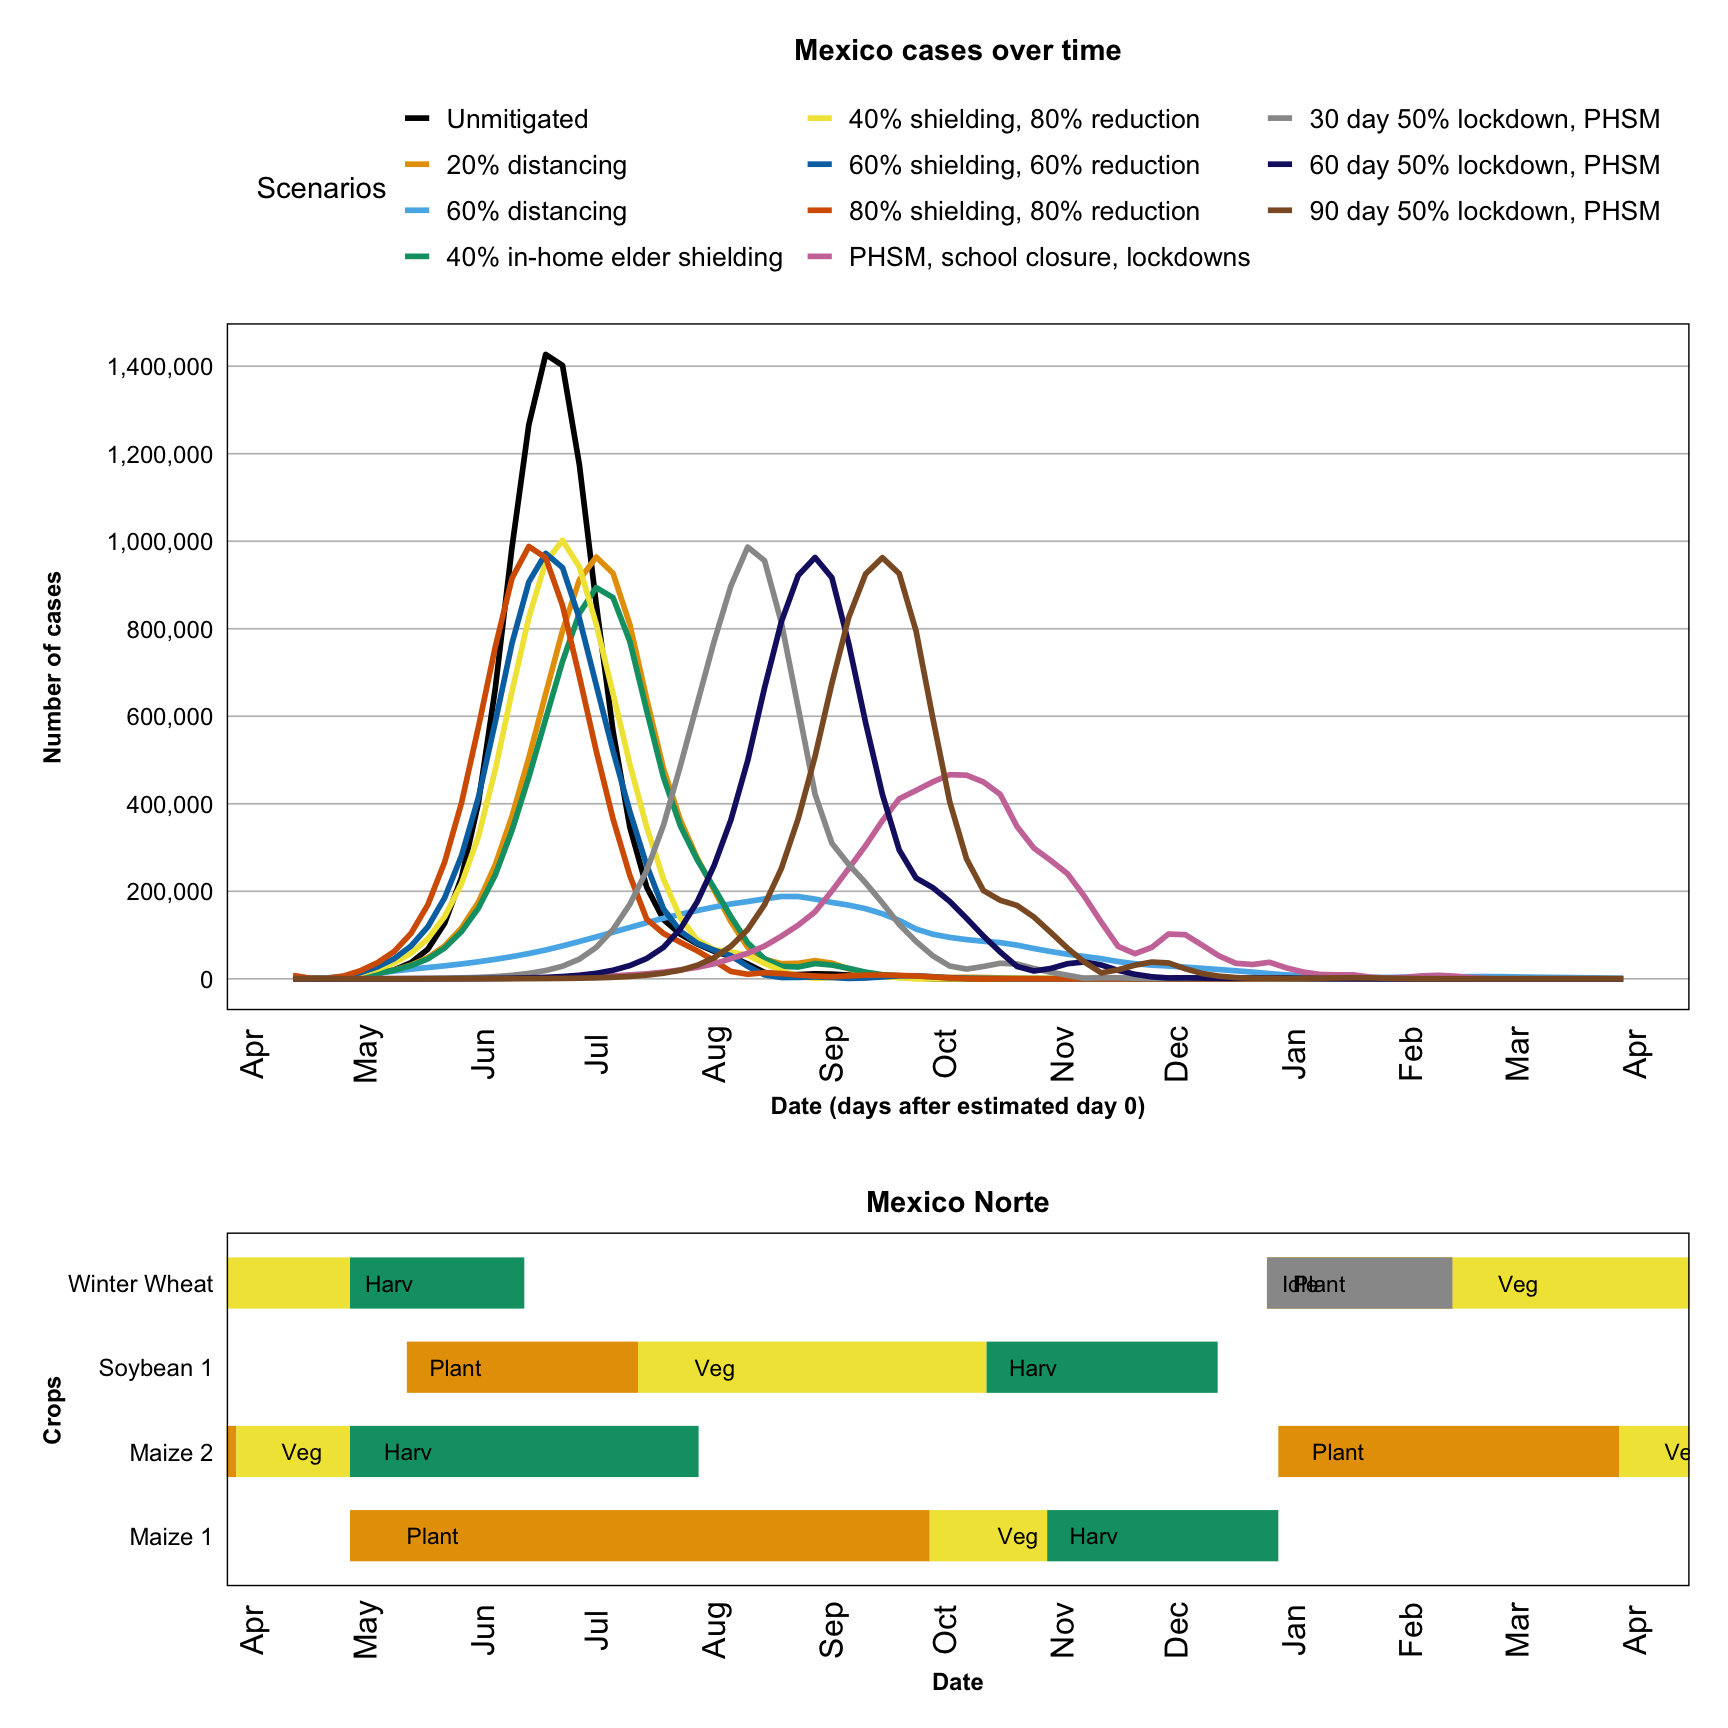
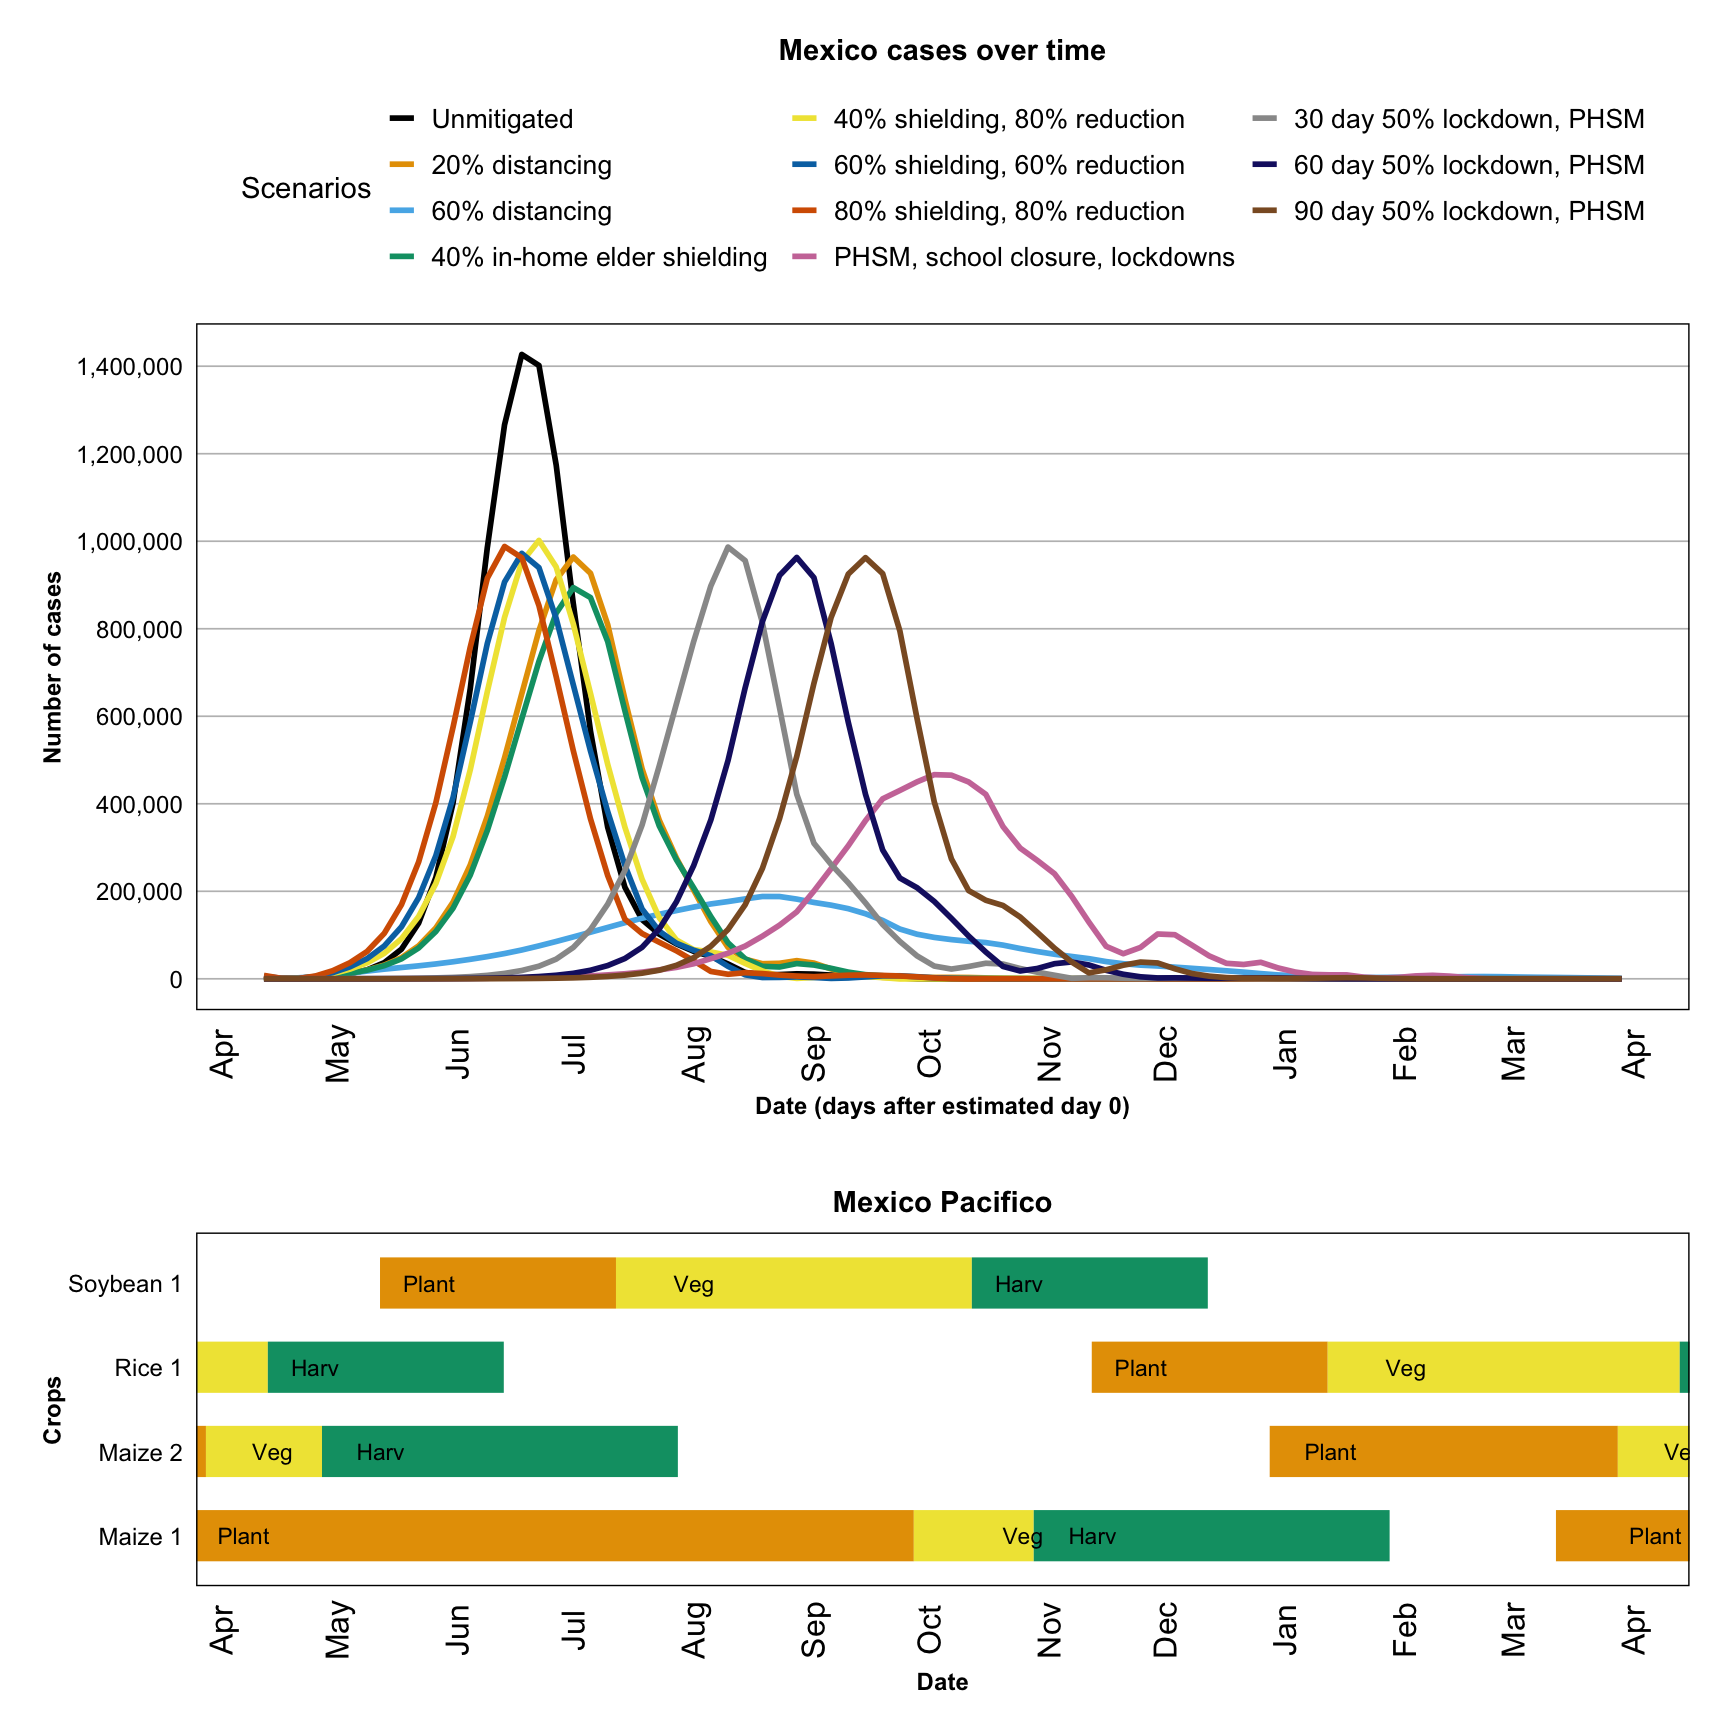
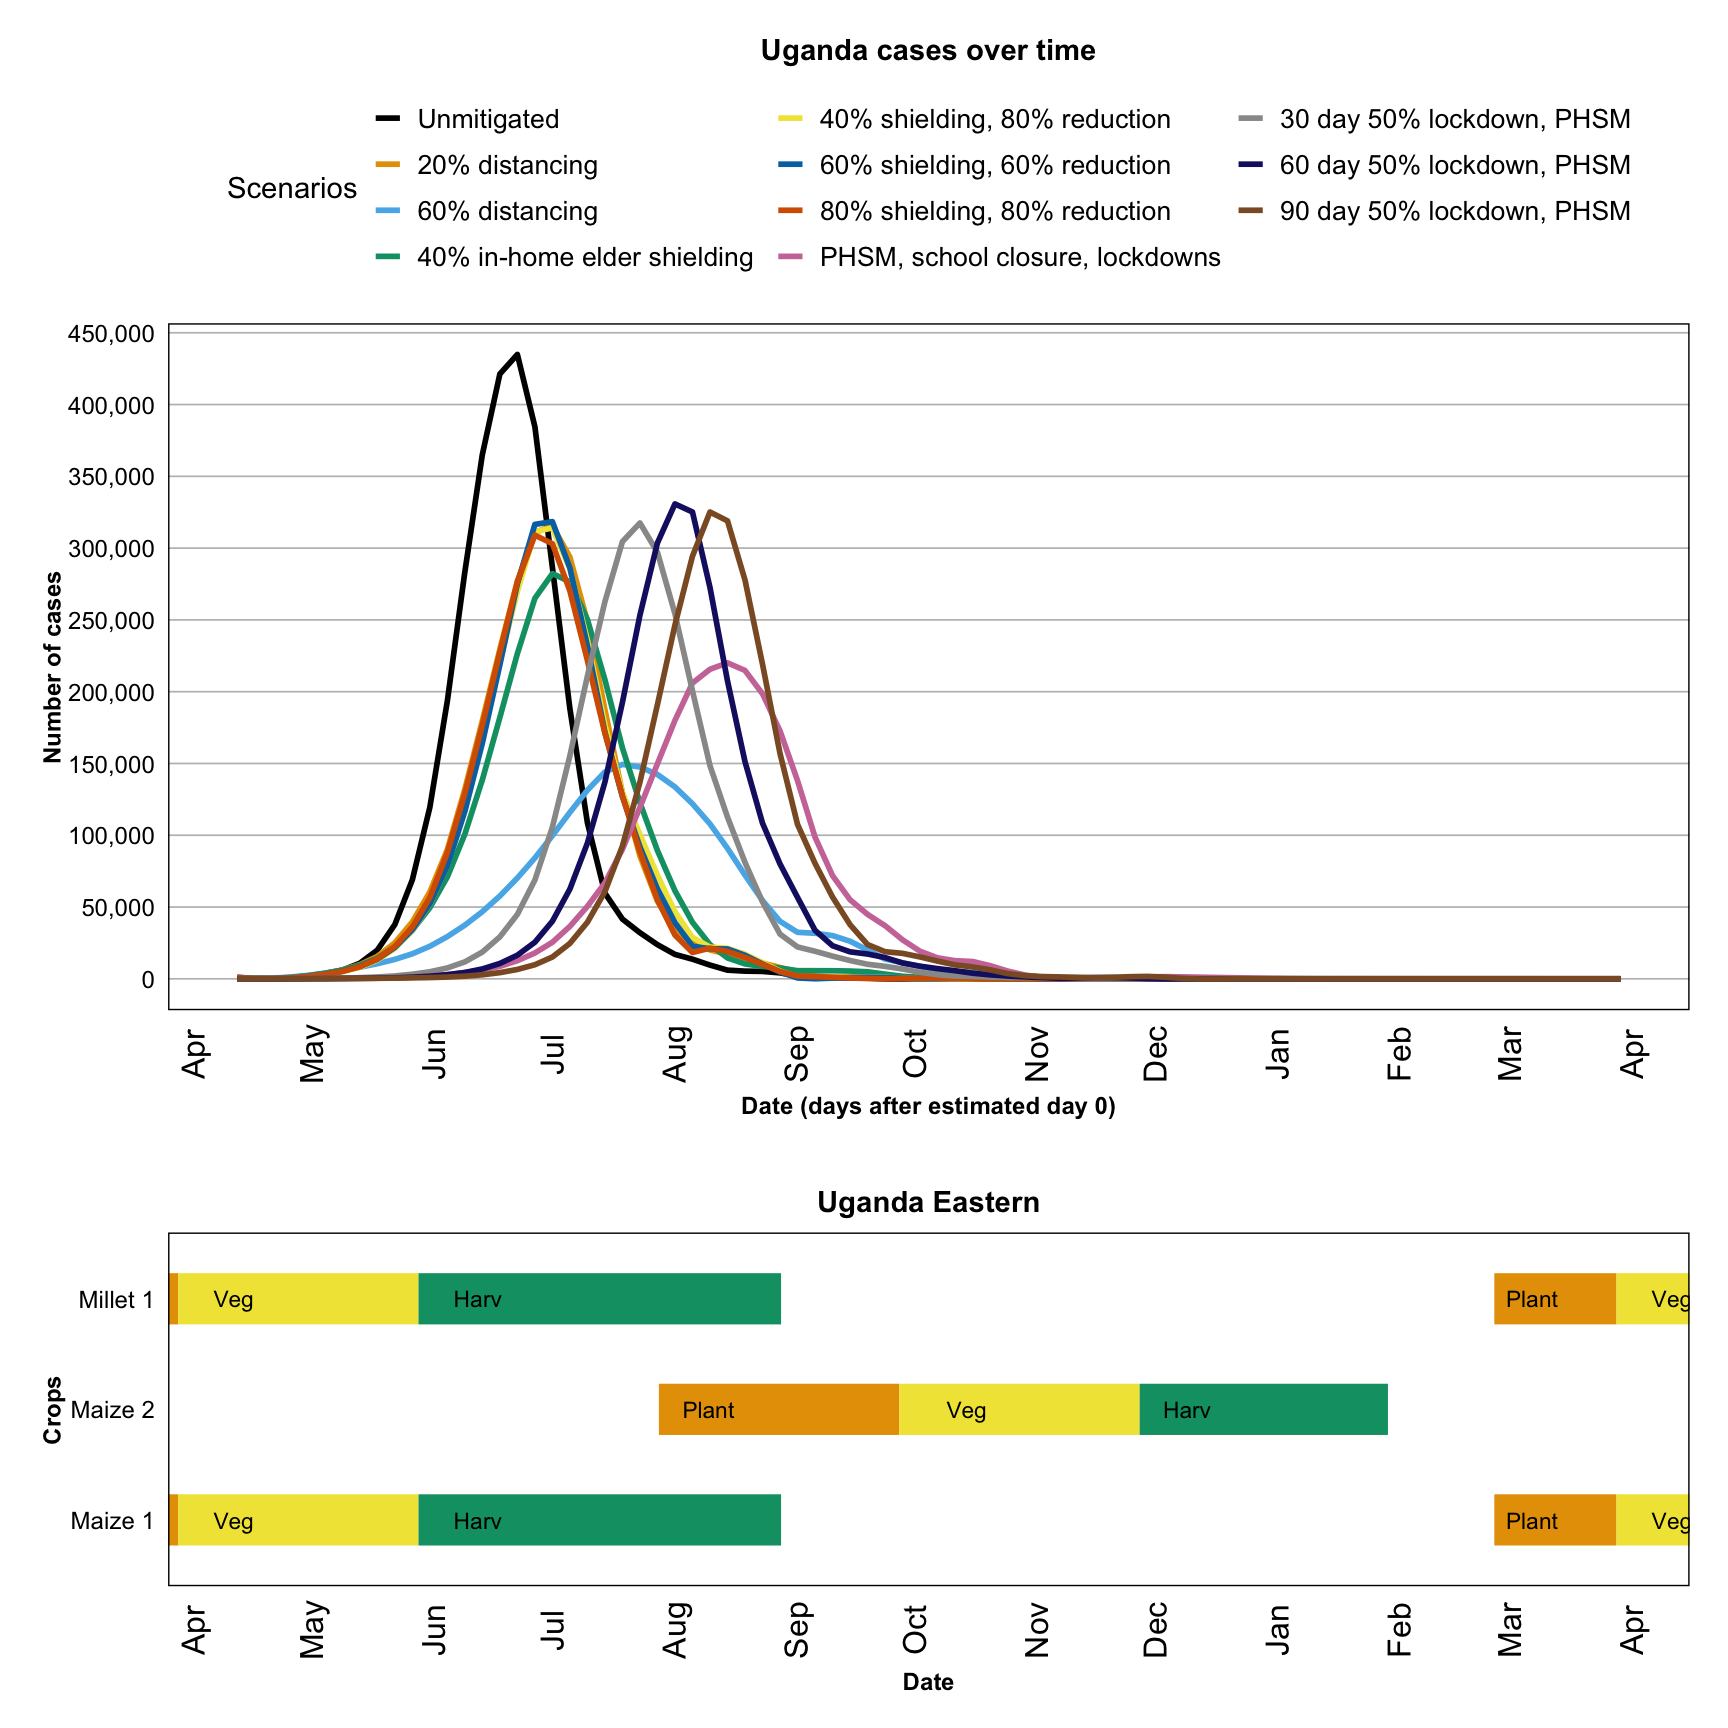
Below, each country’s analysis contains:
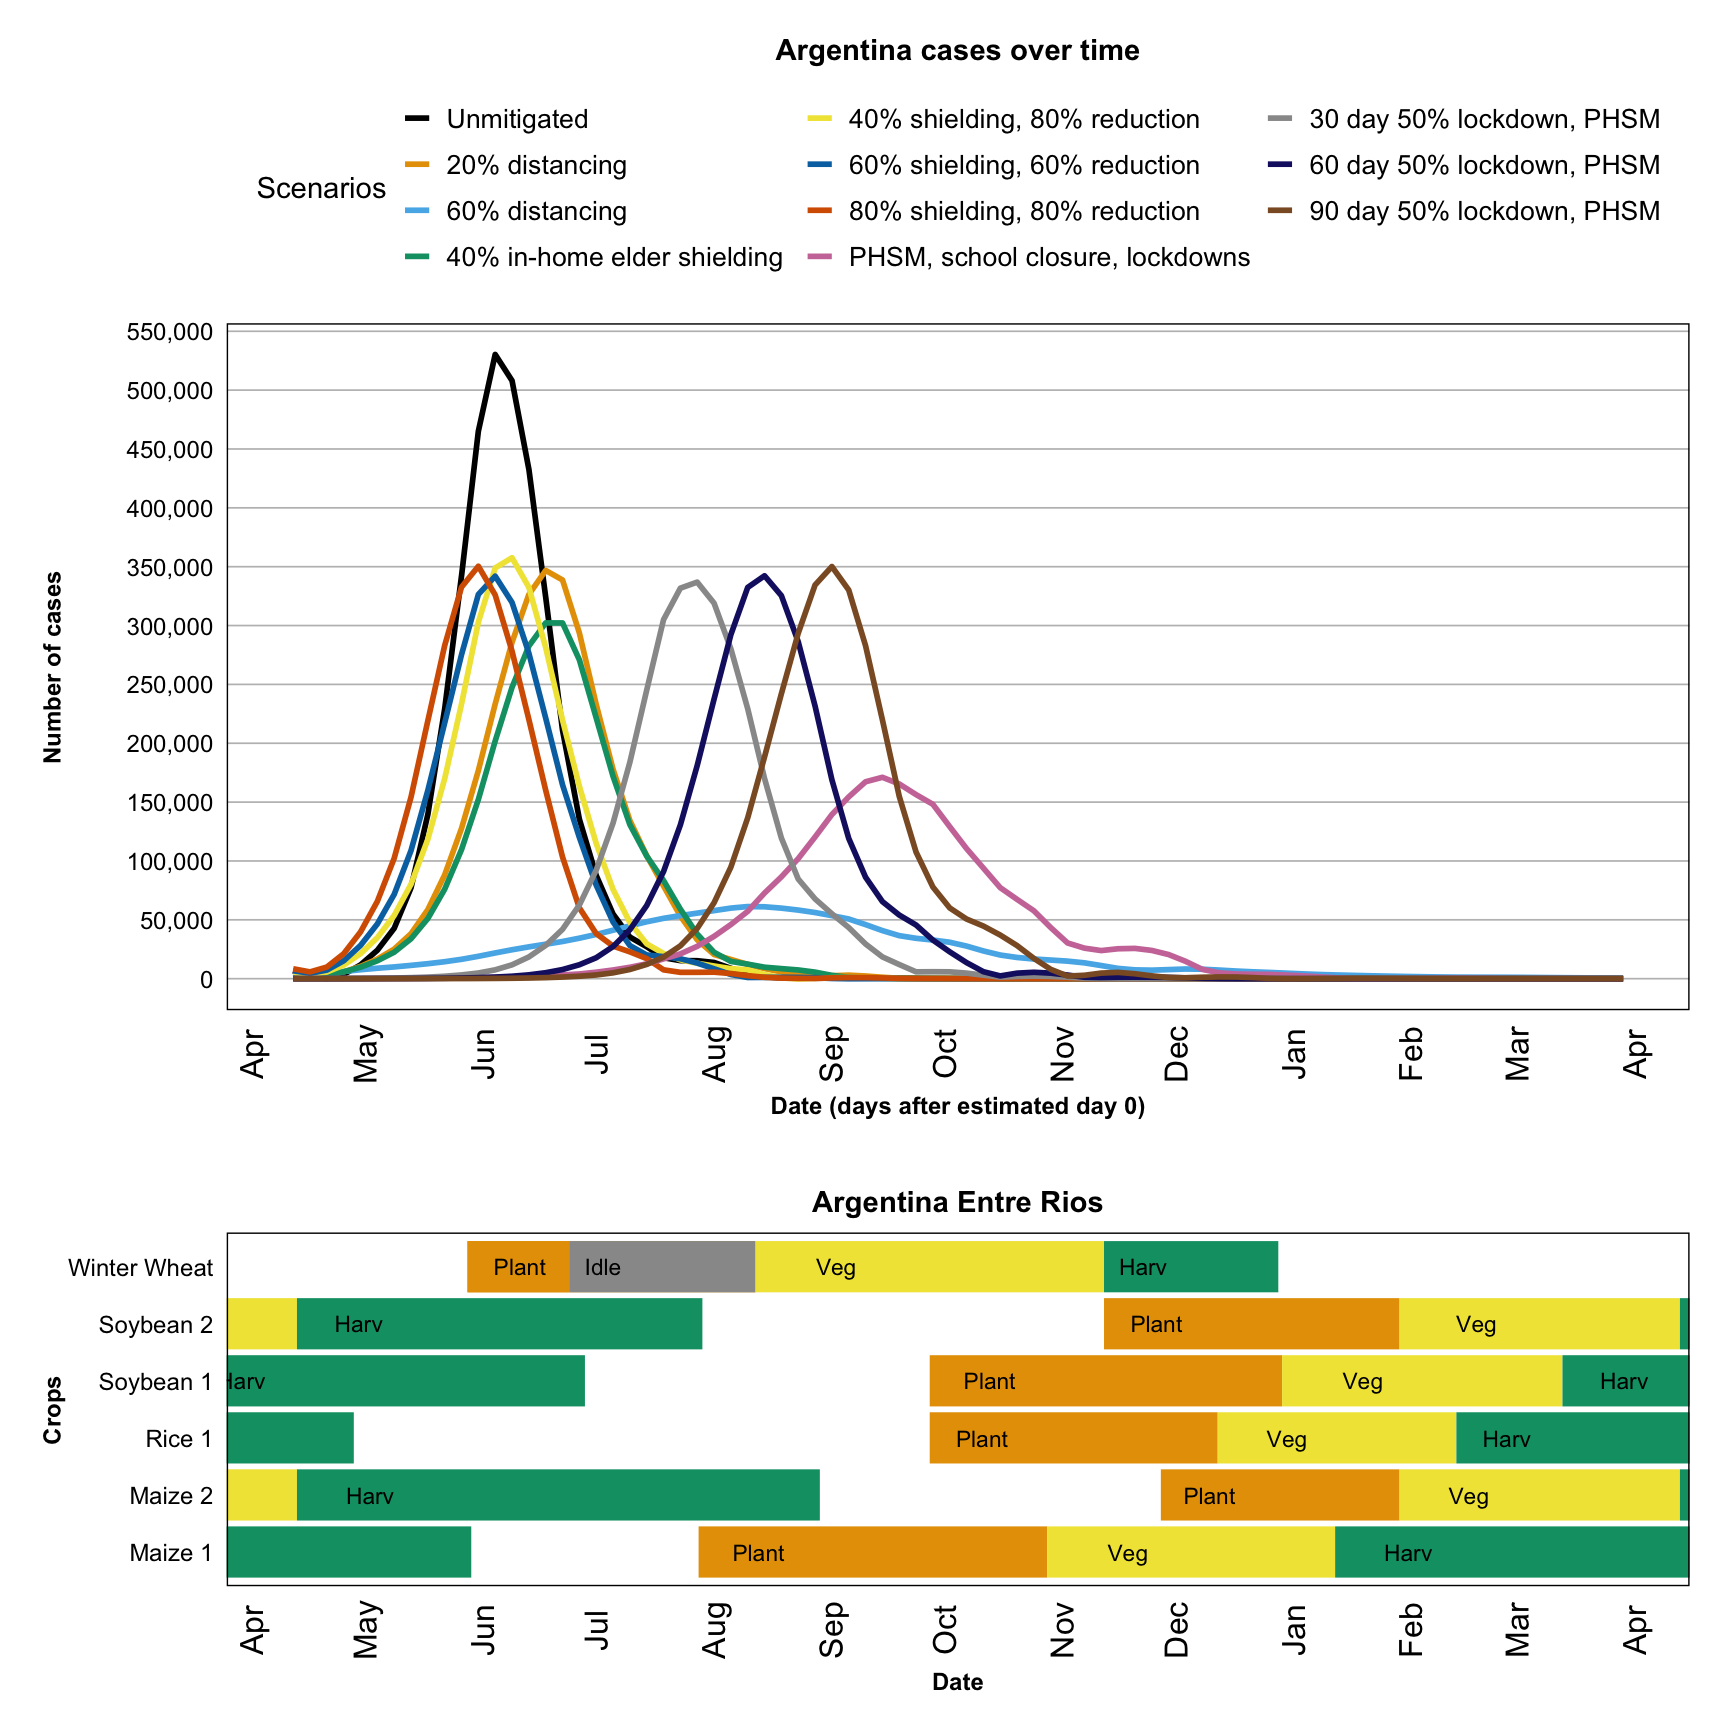
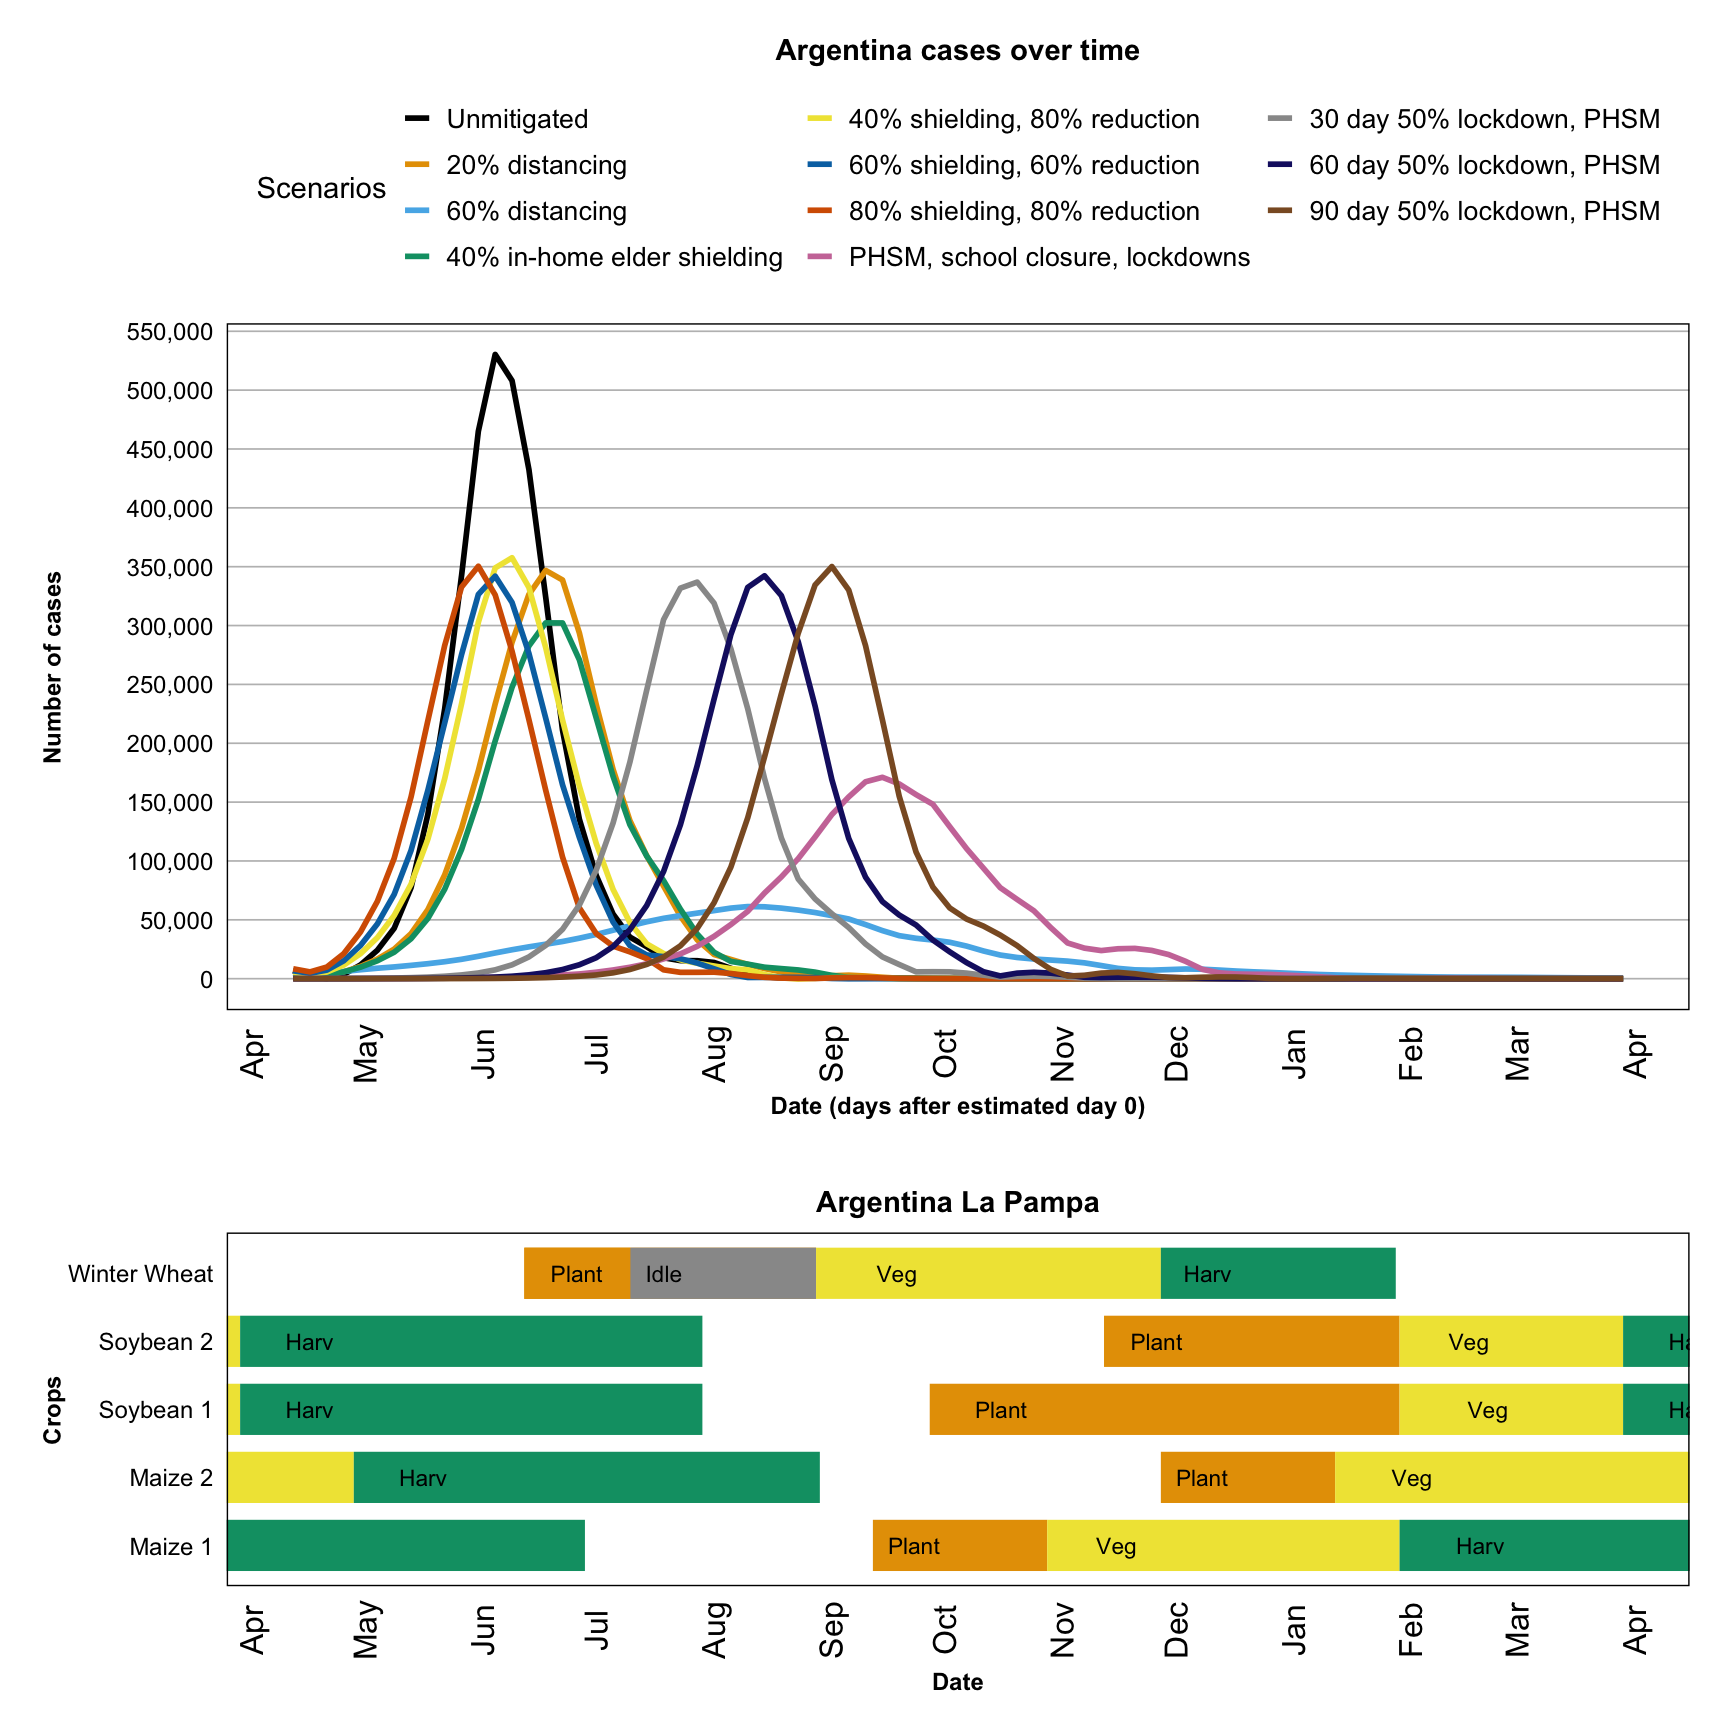
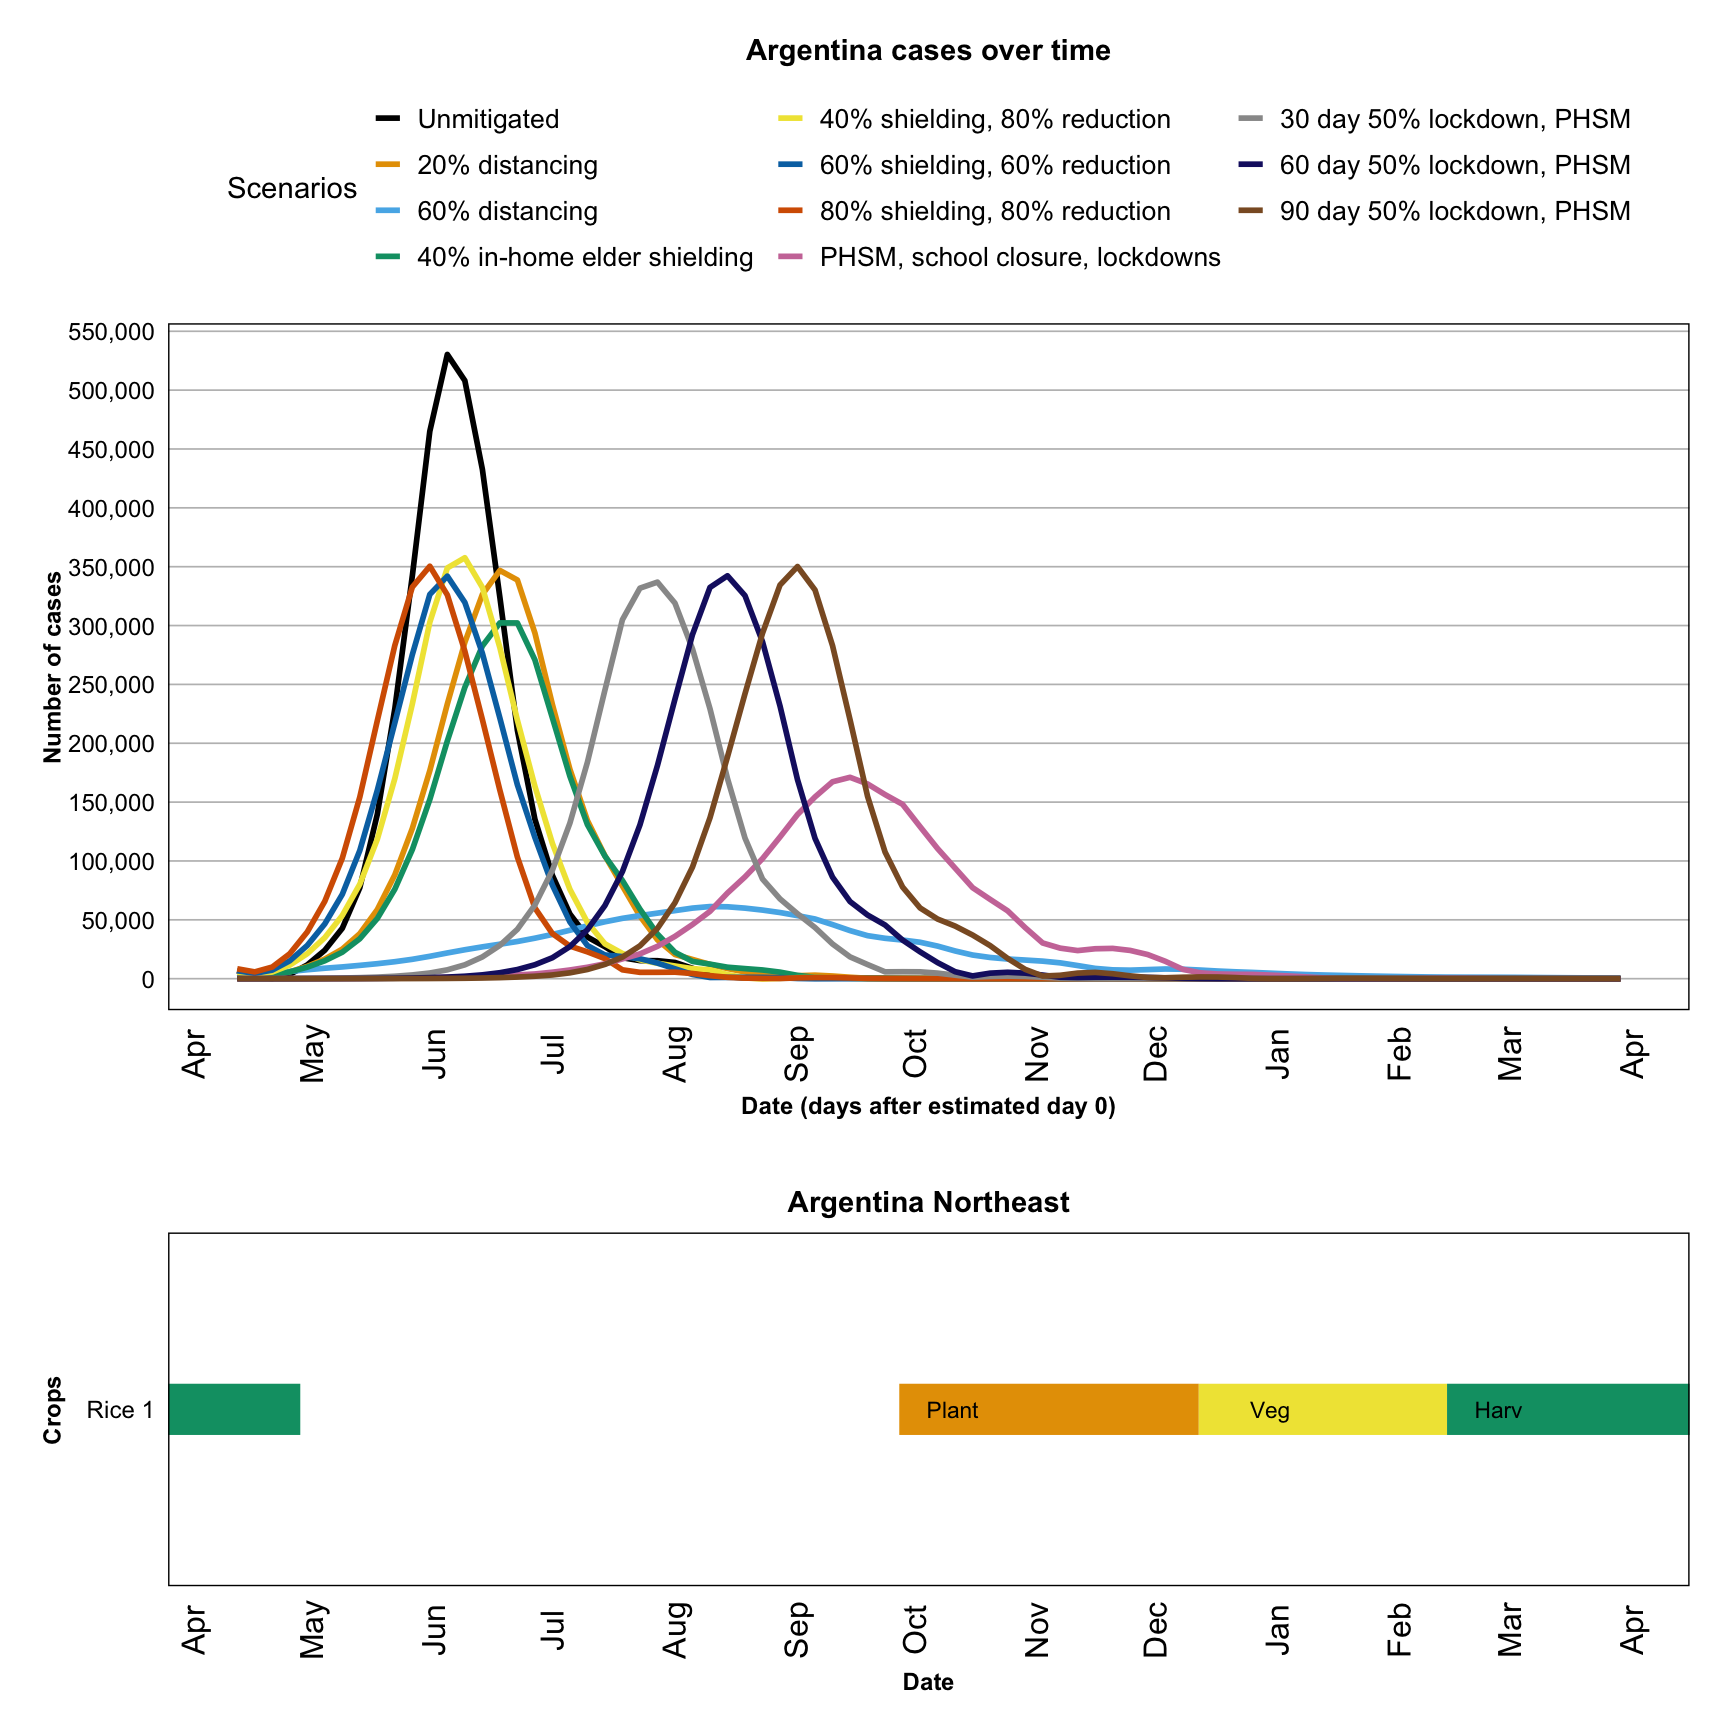
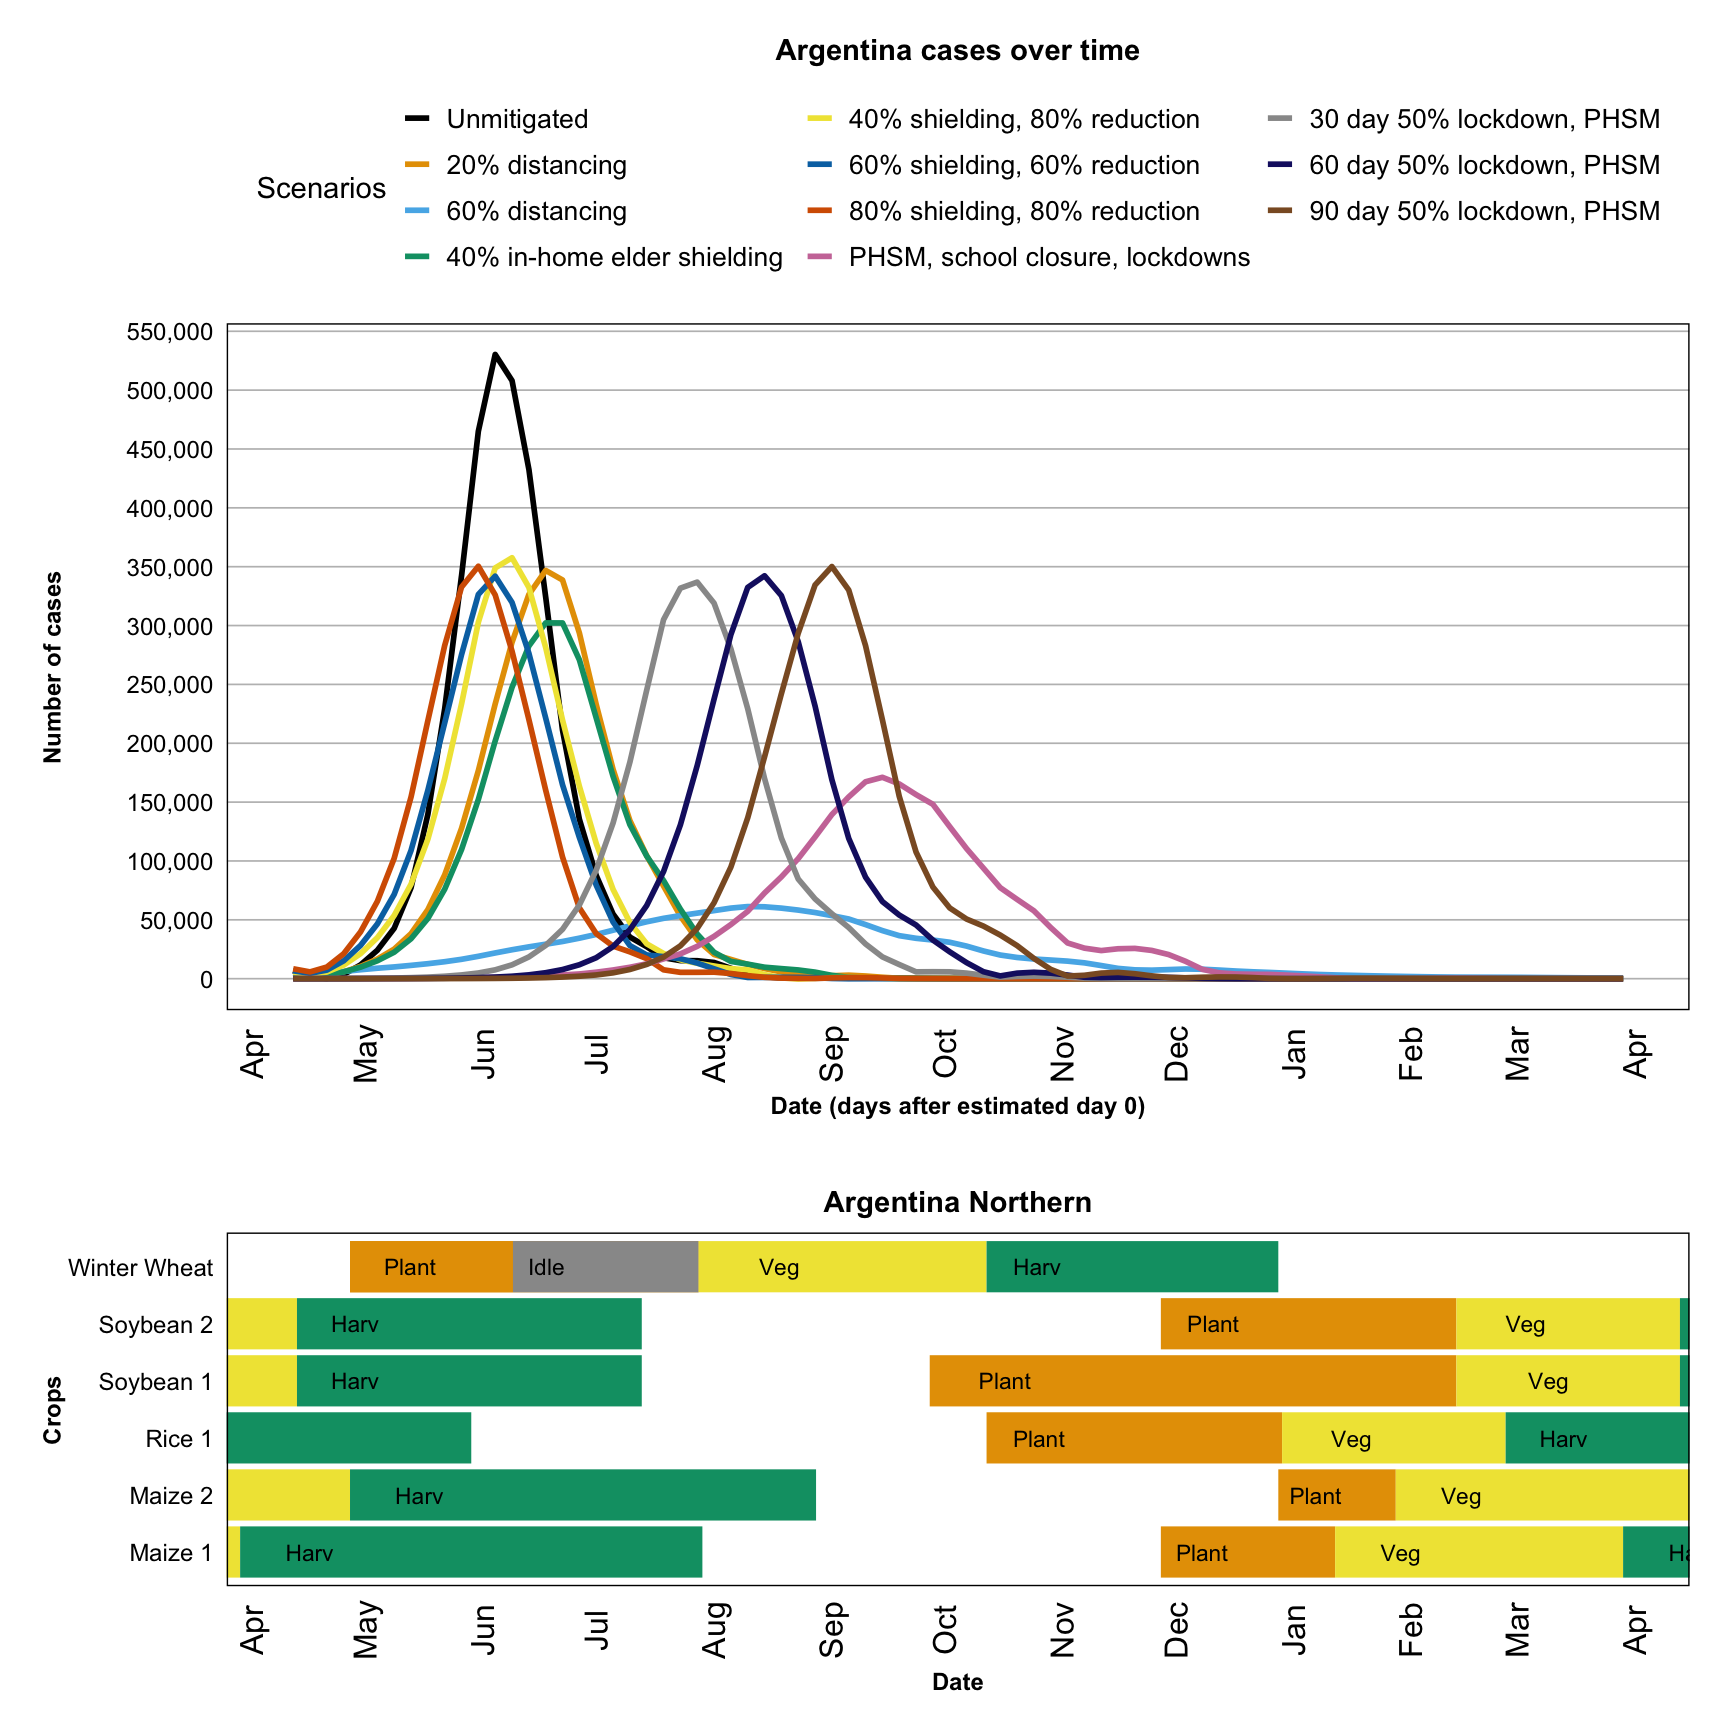
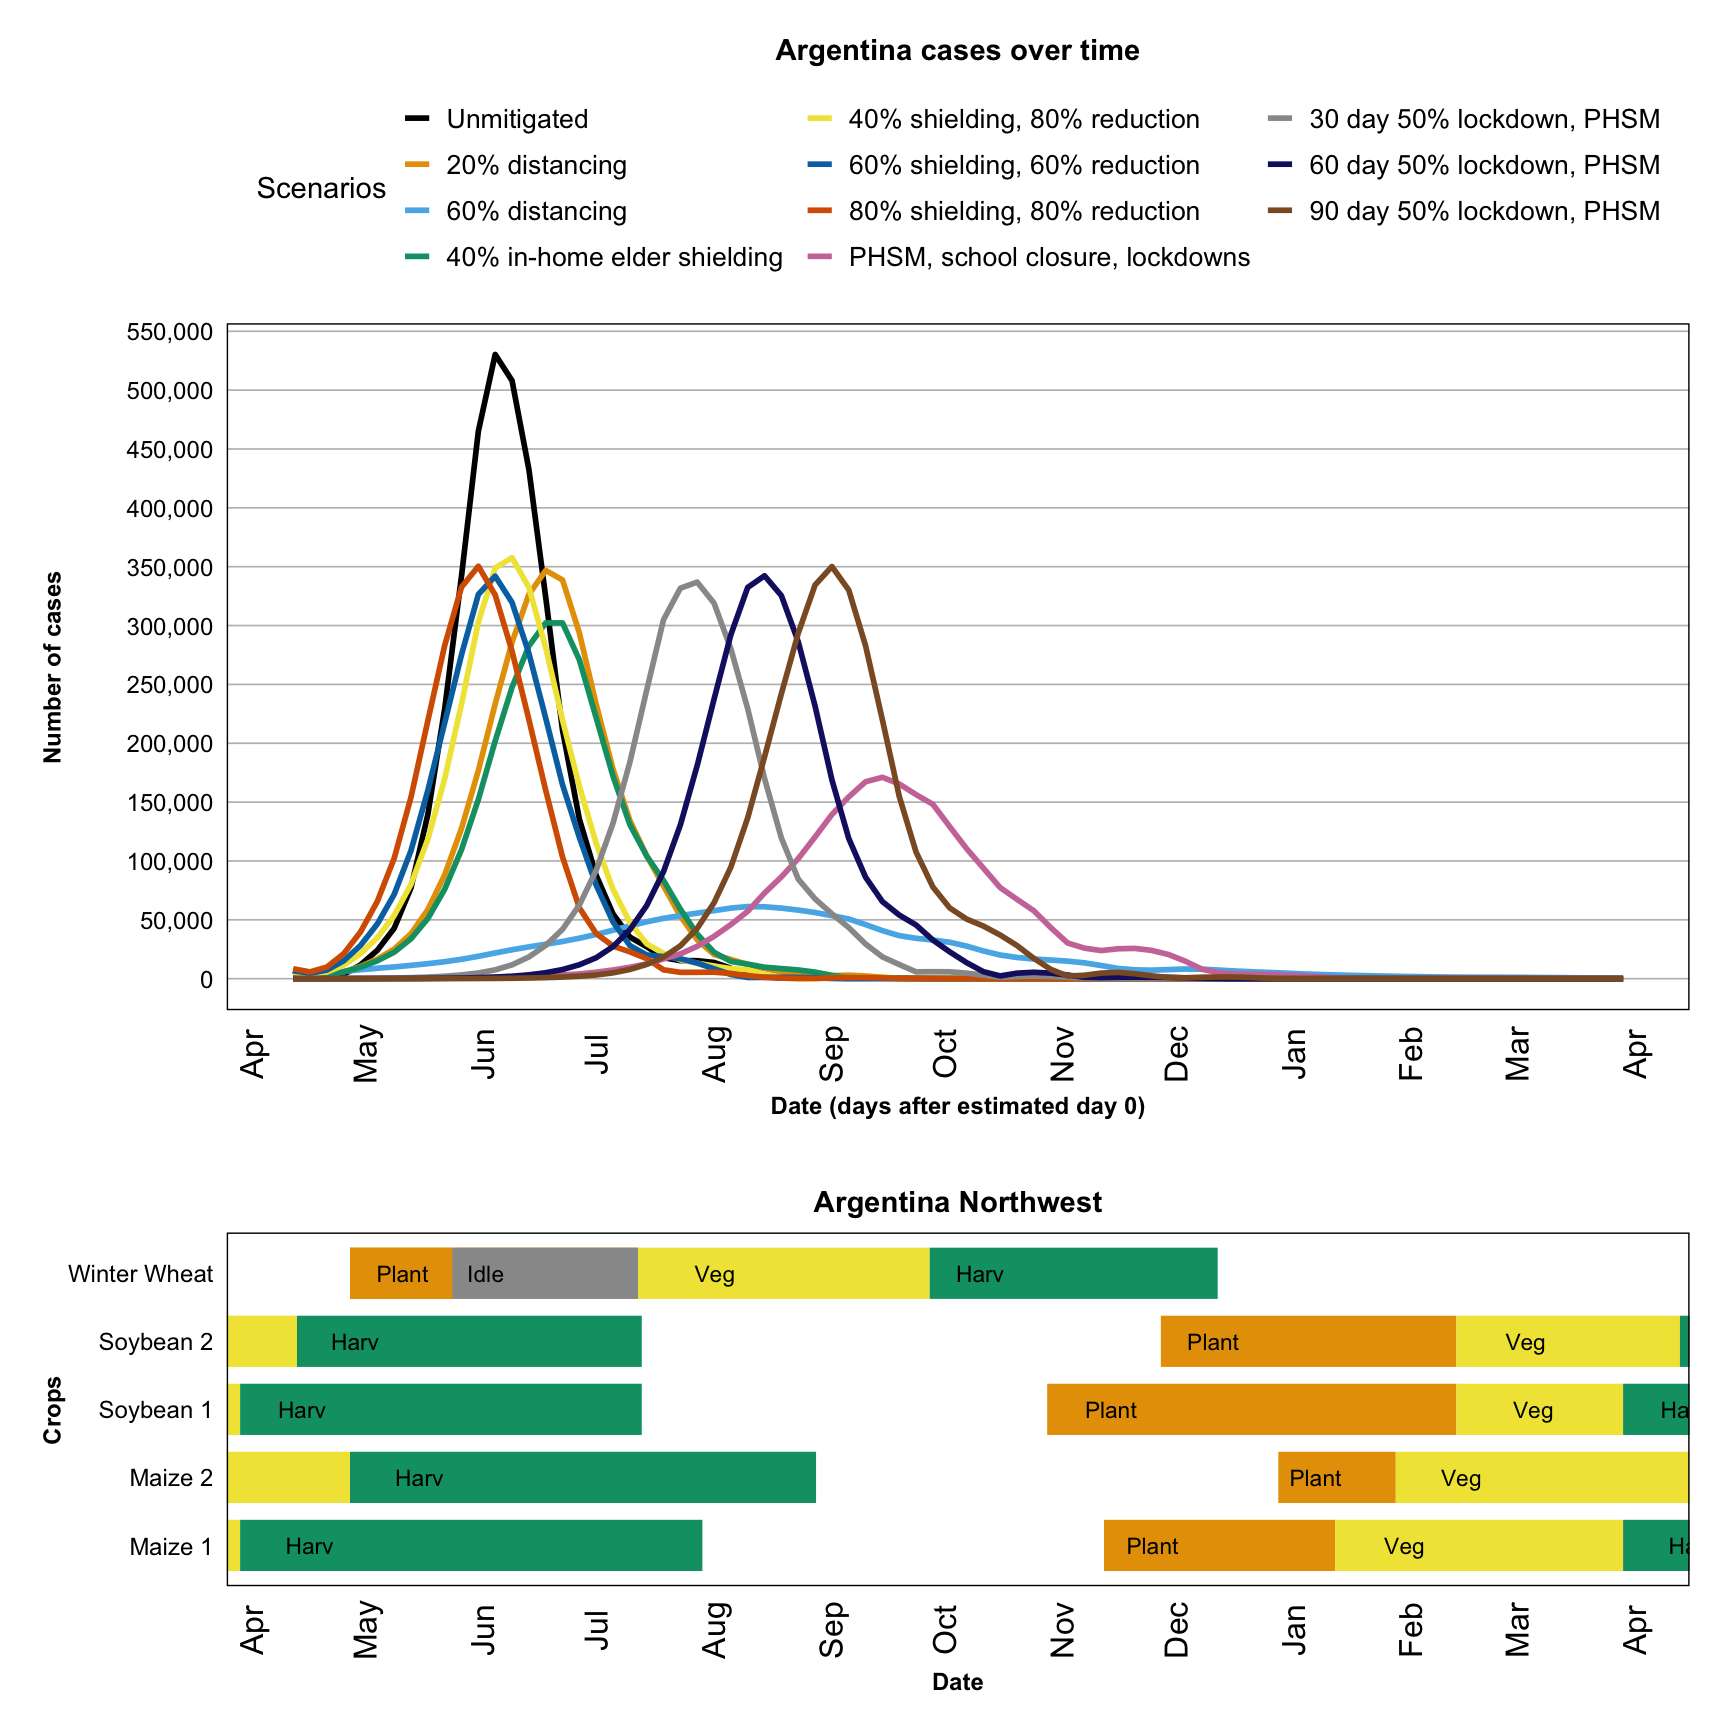
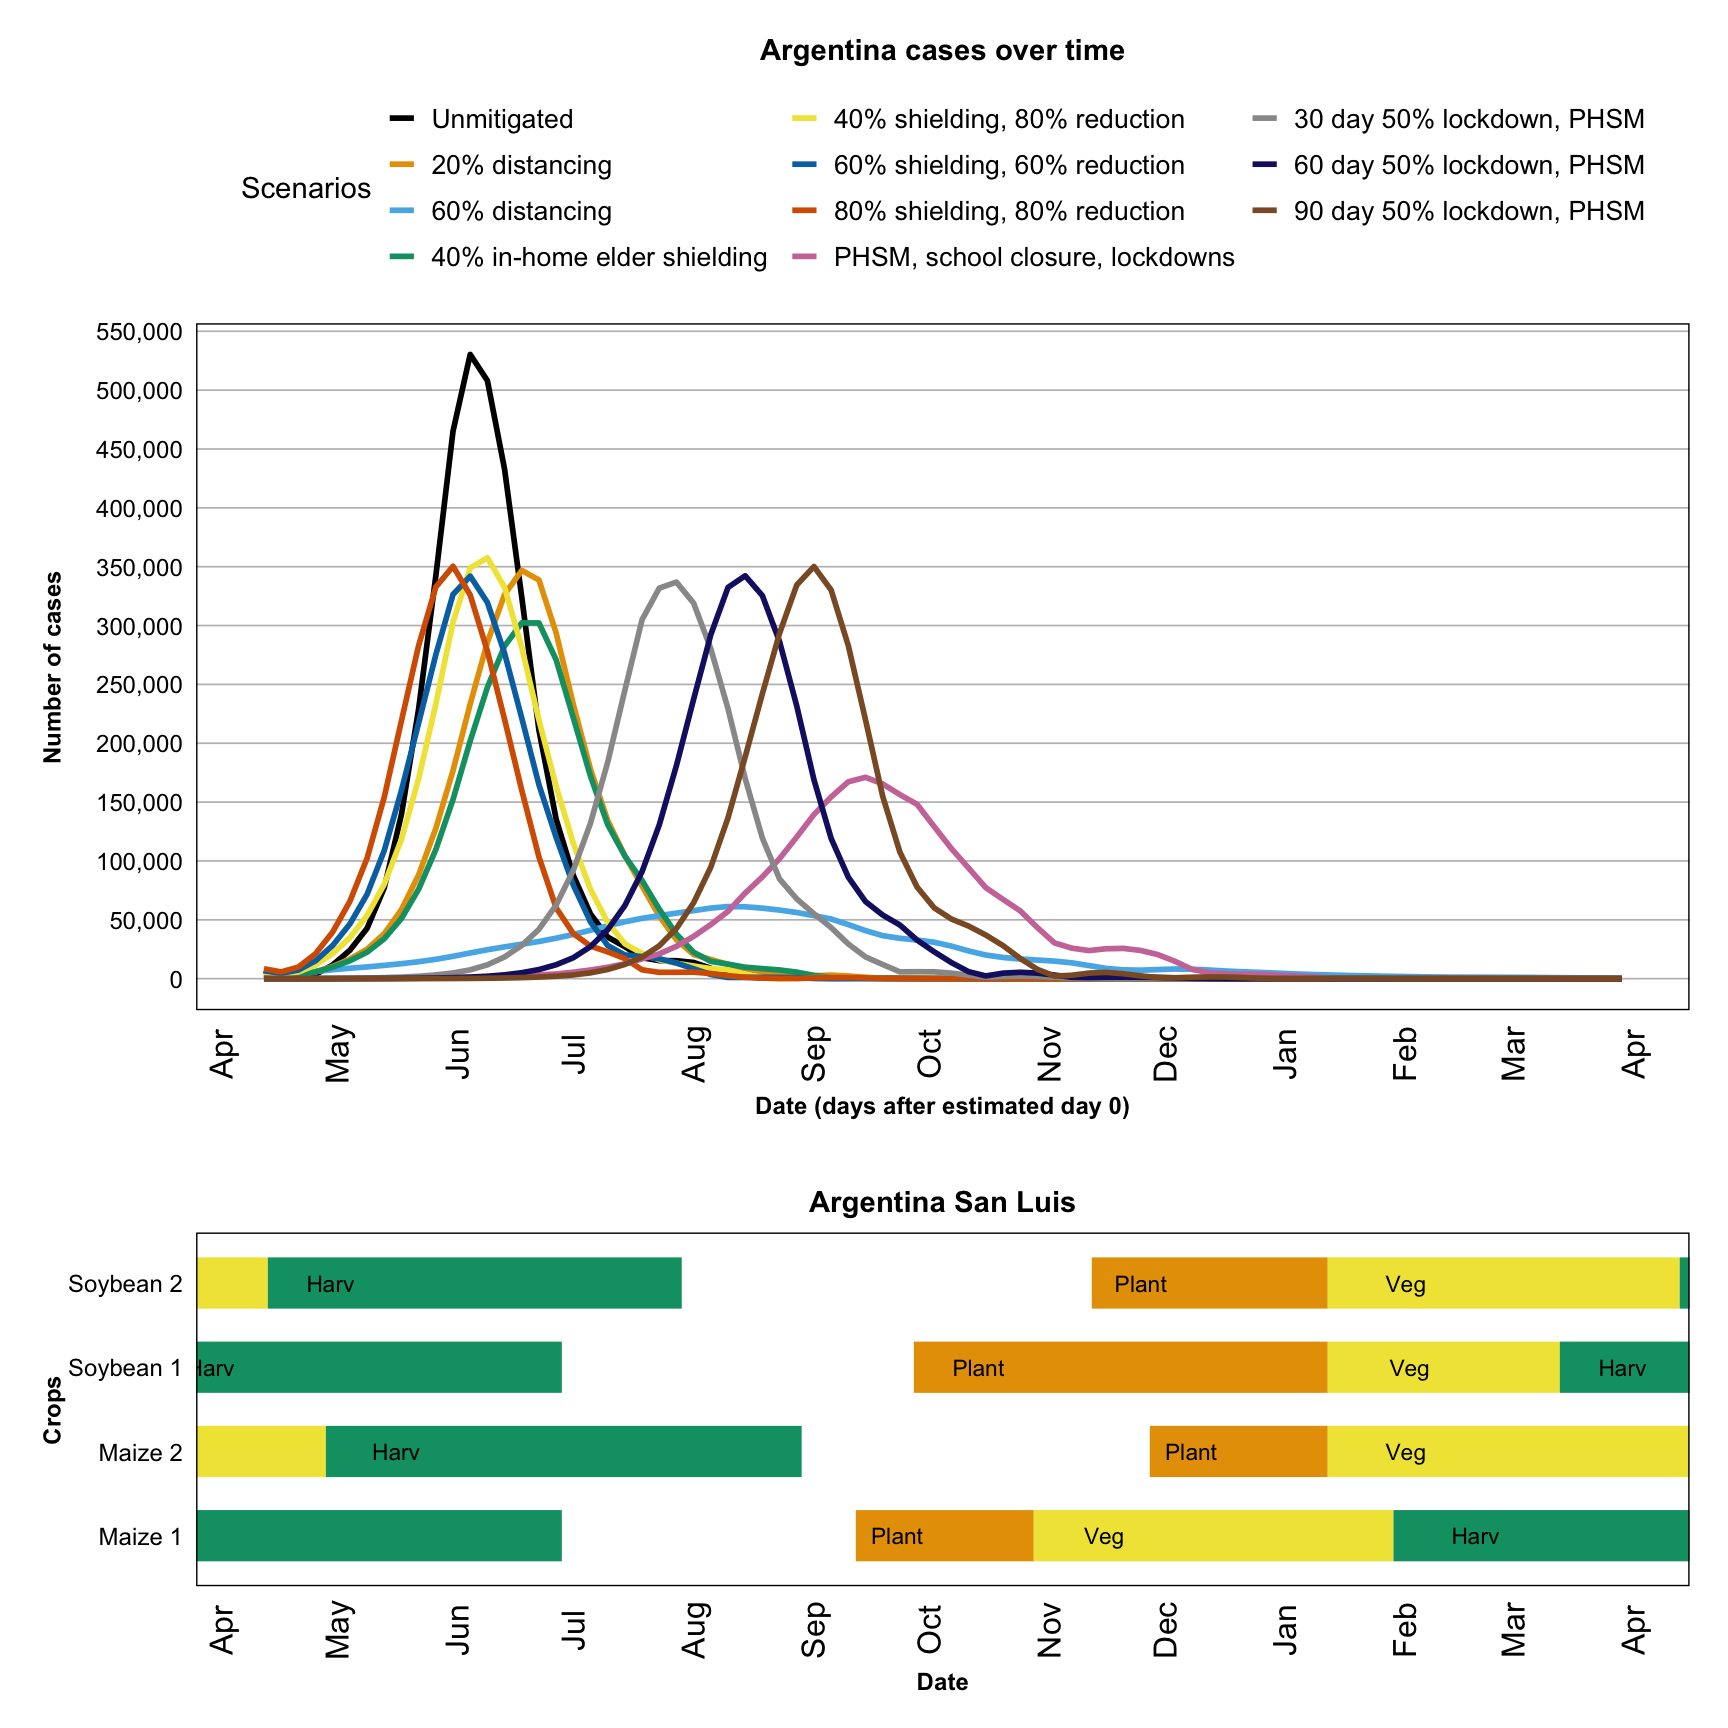
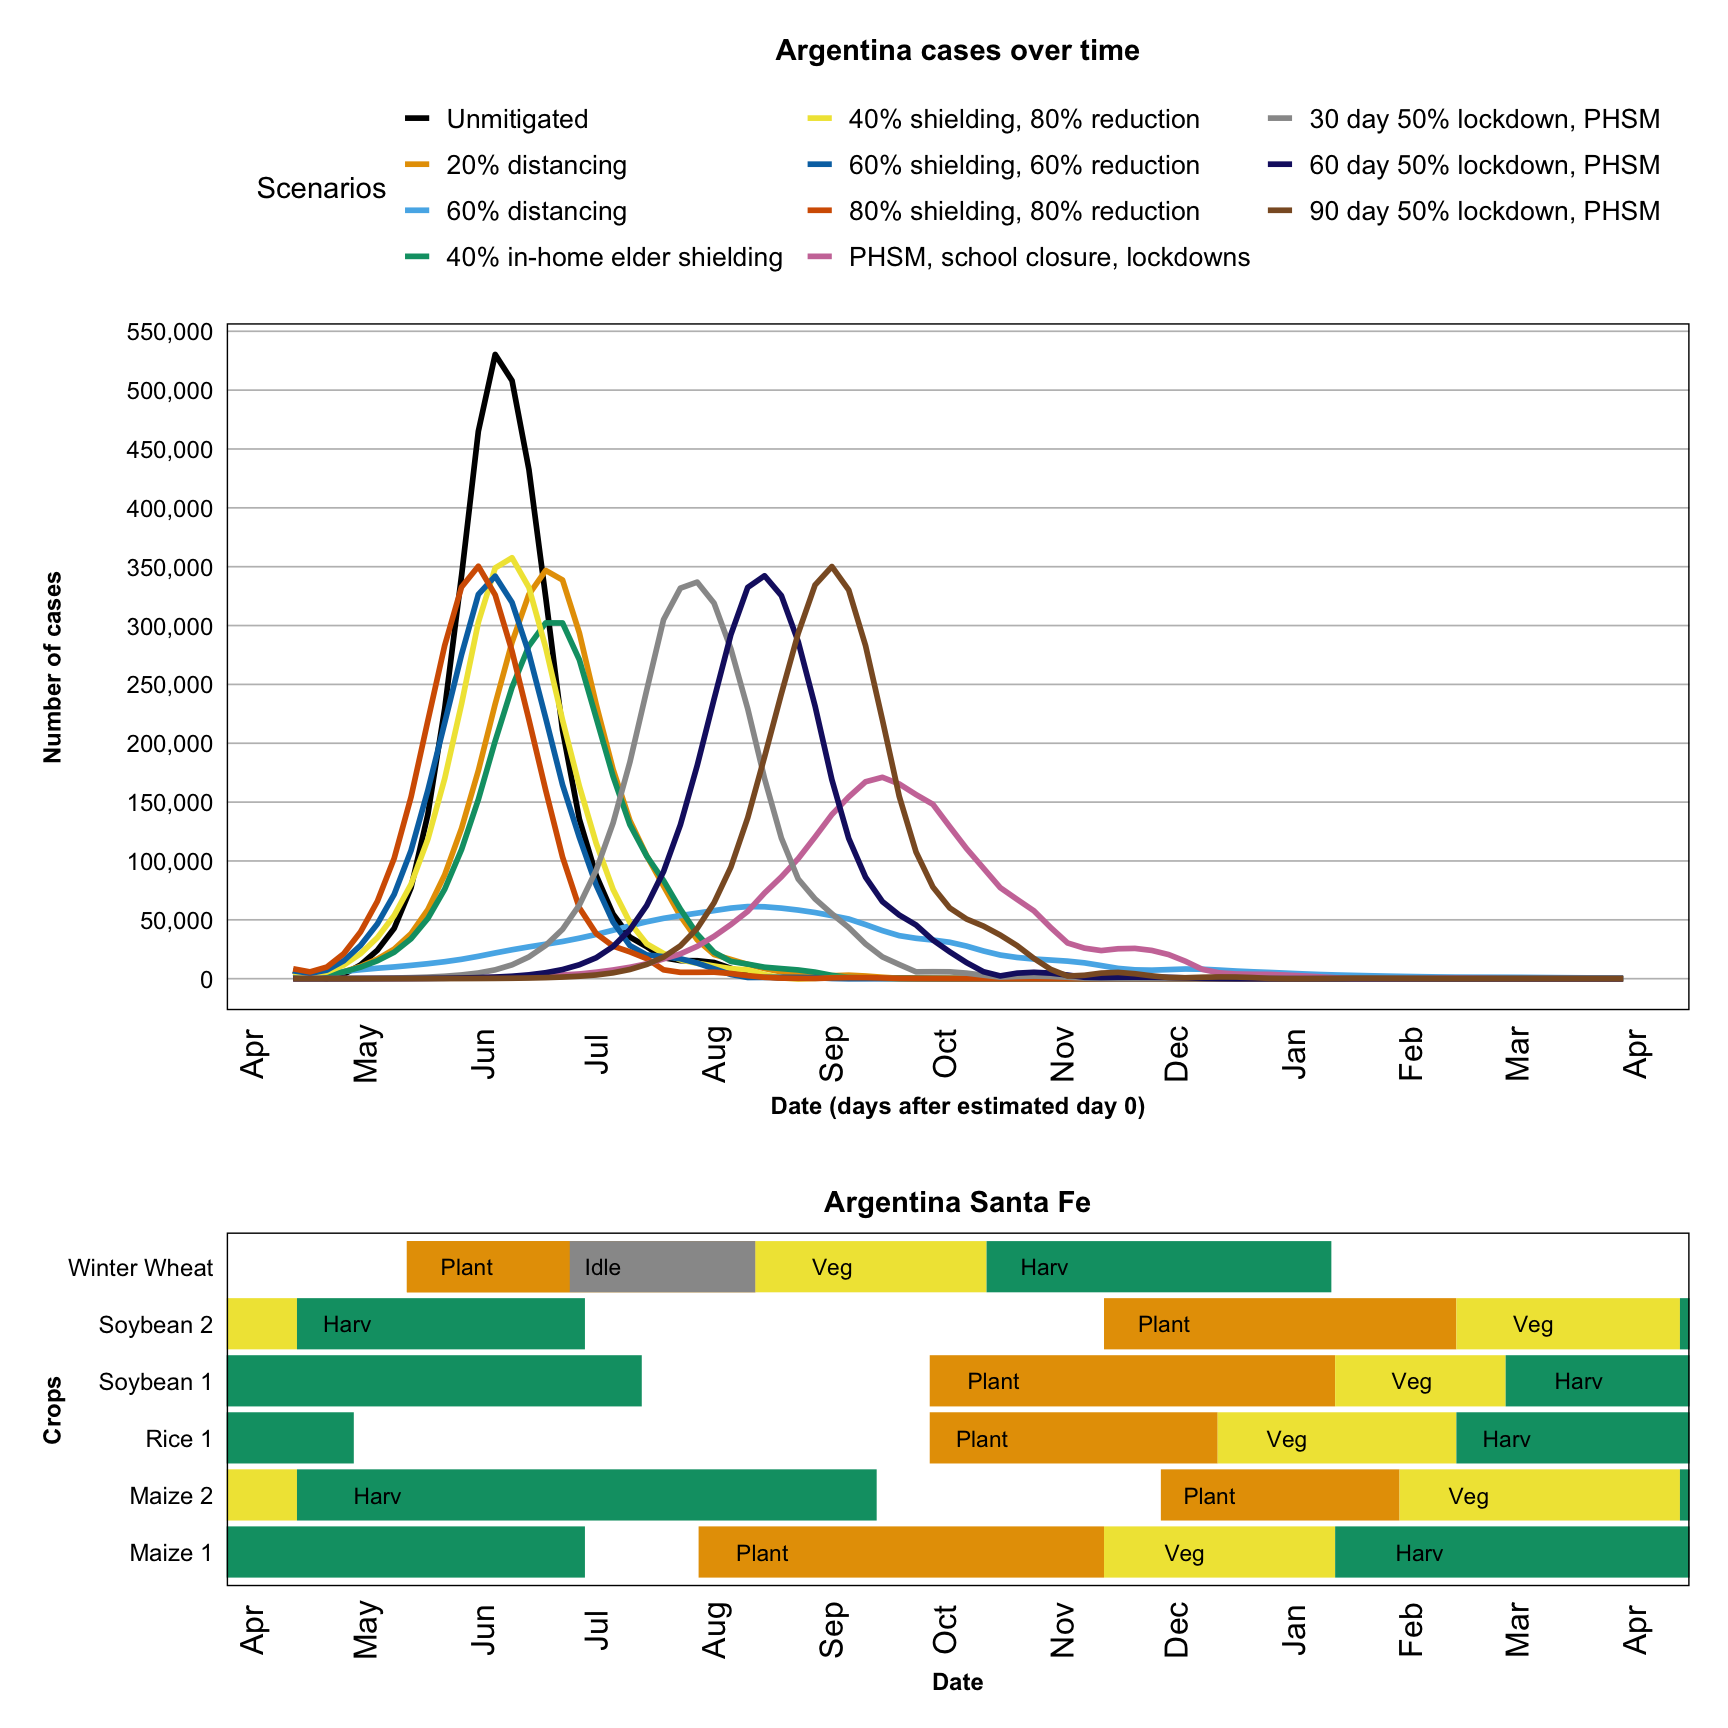
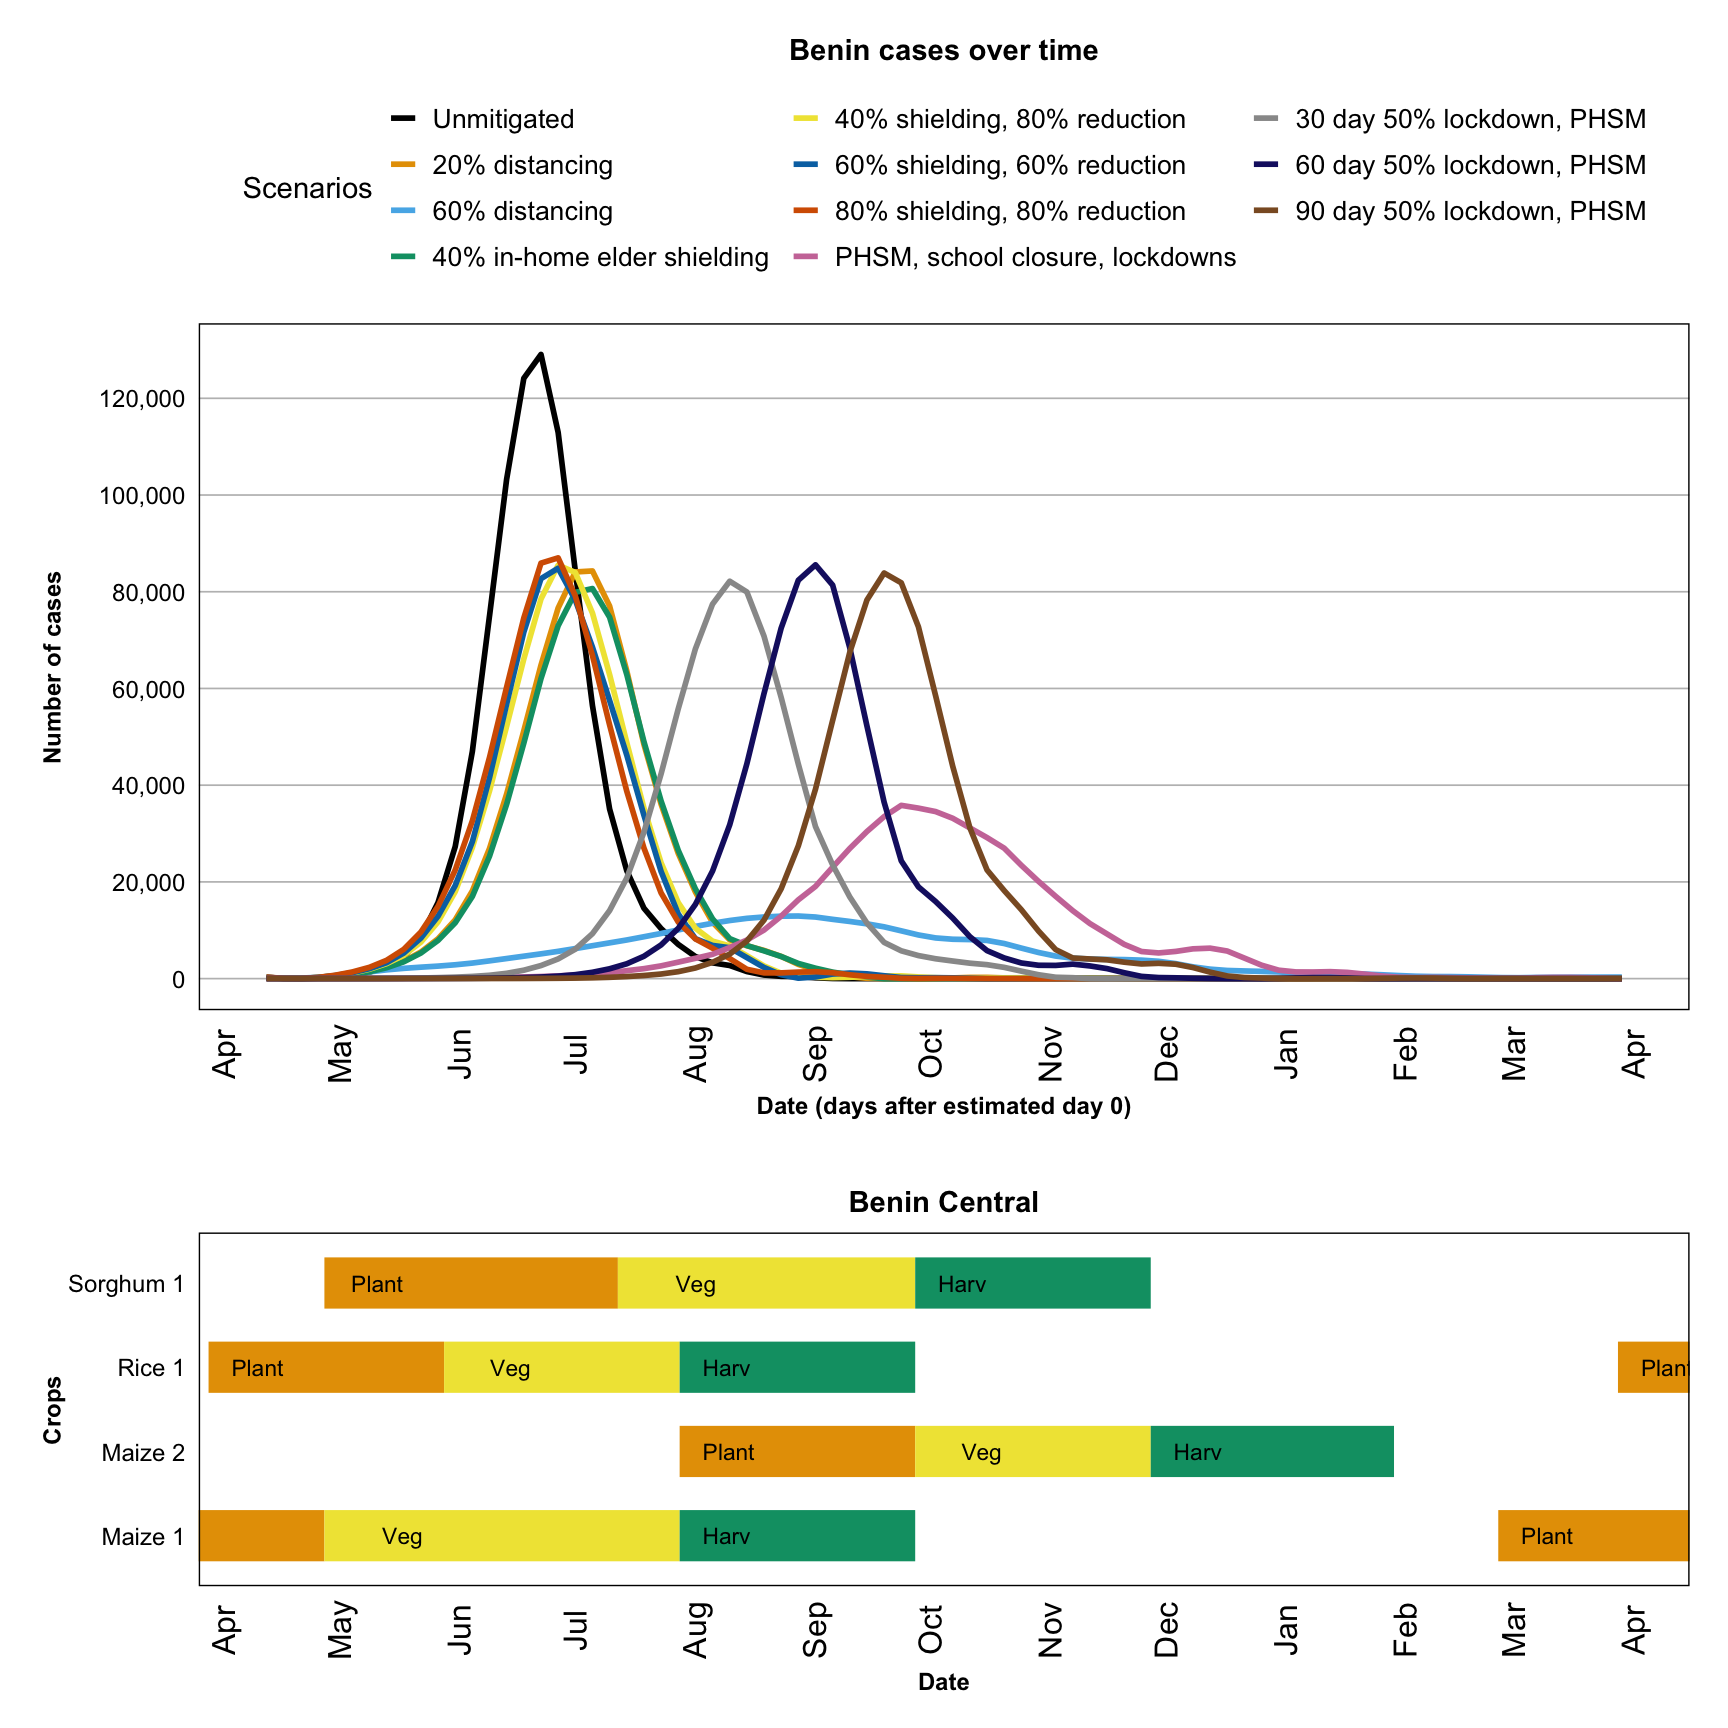
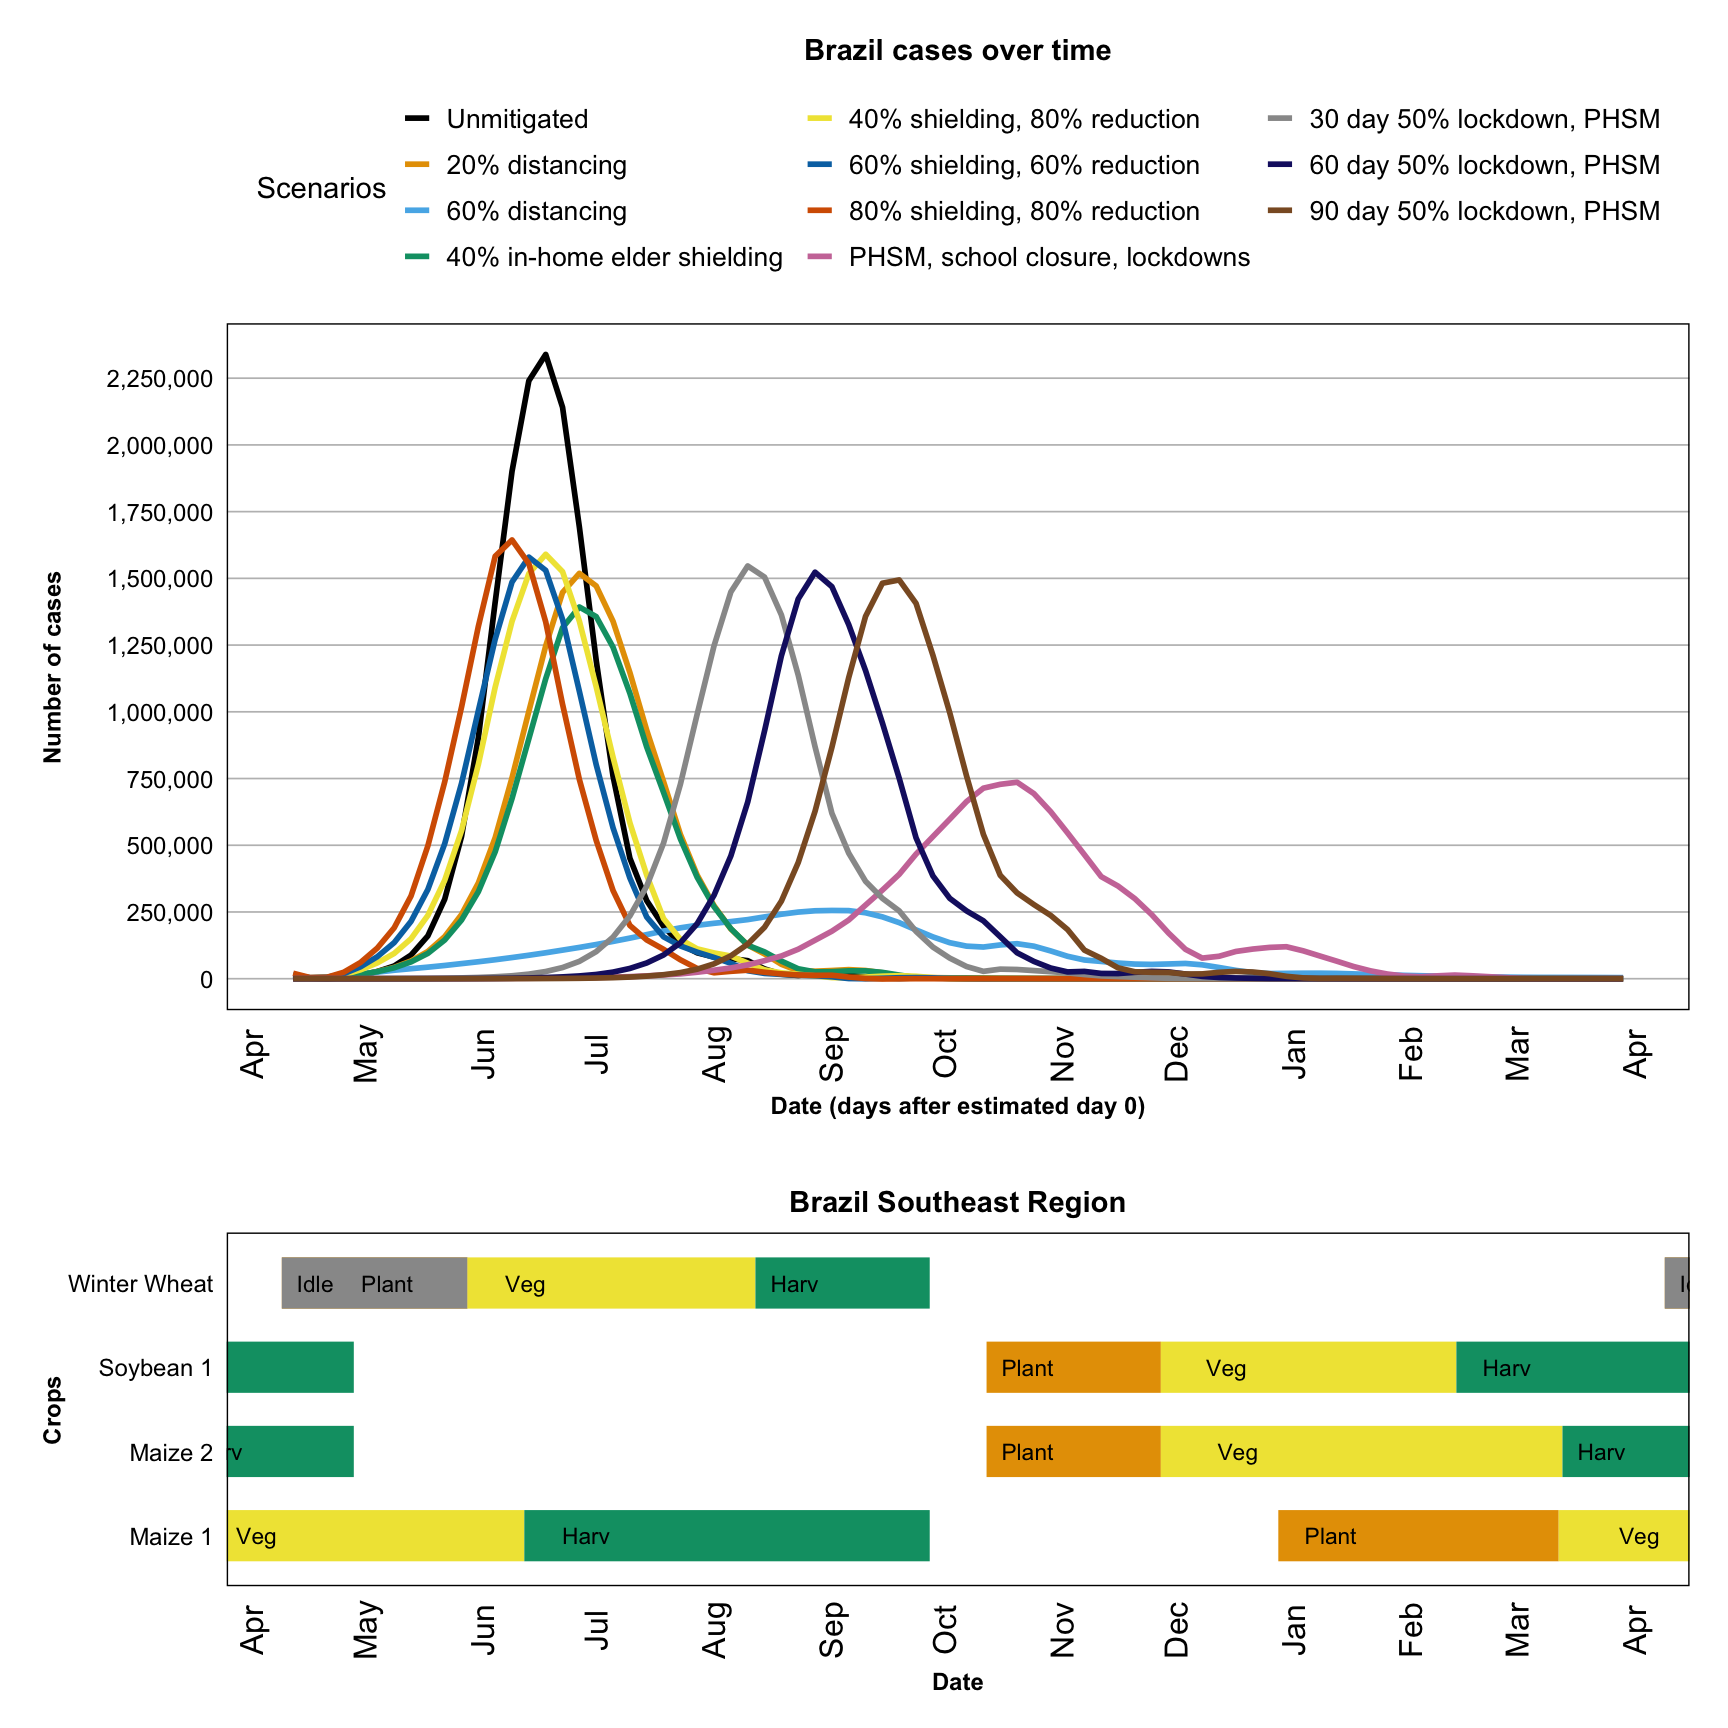
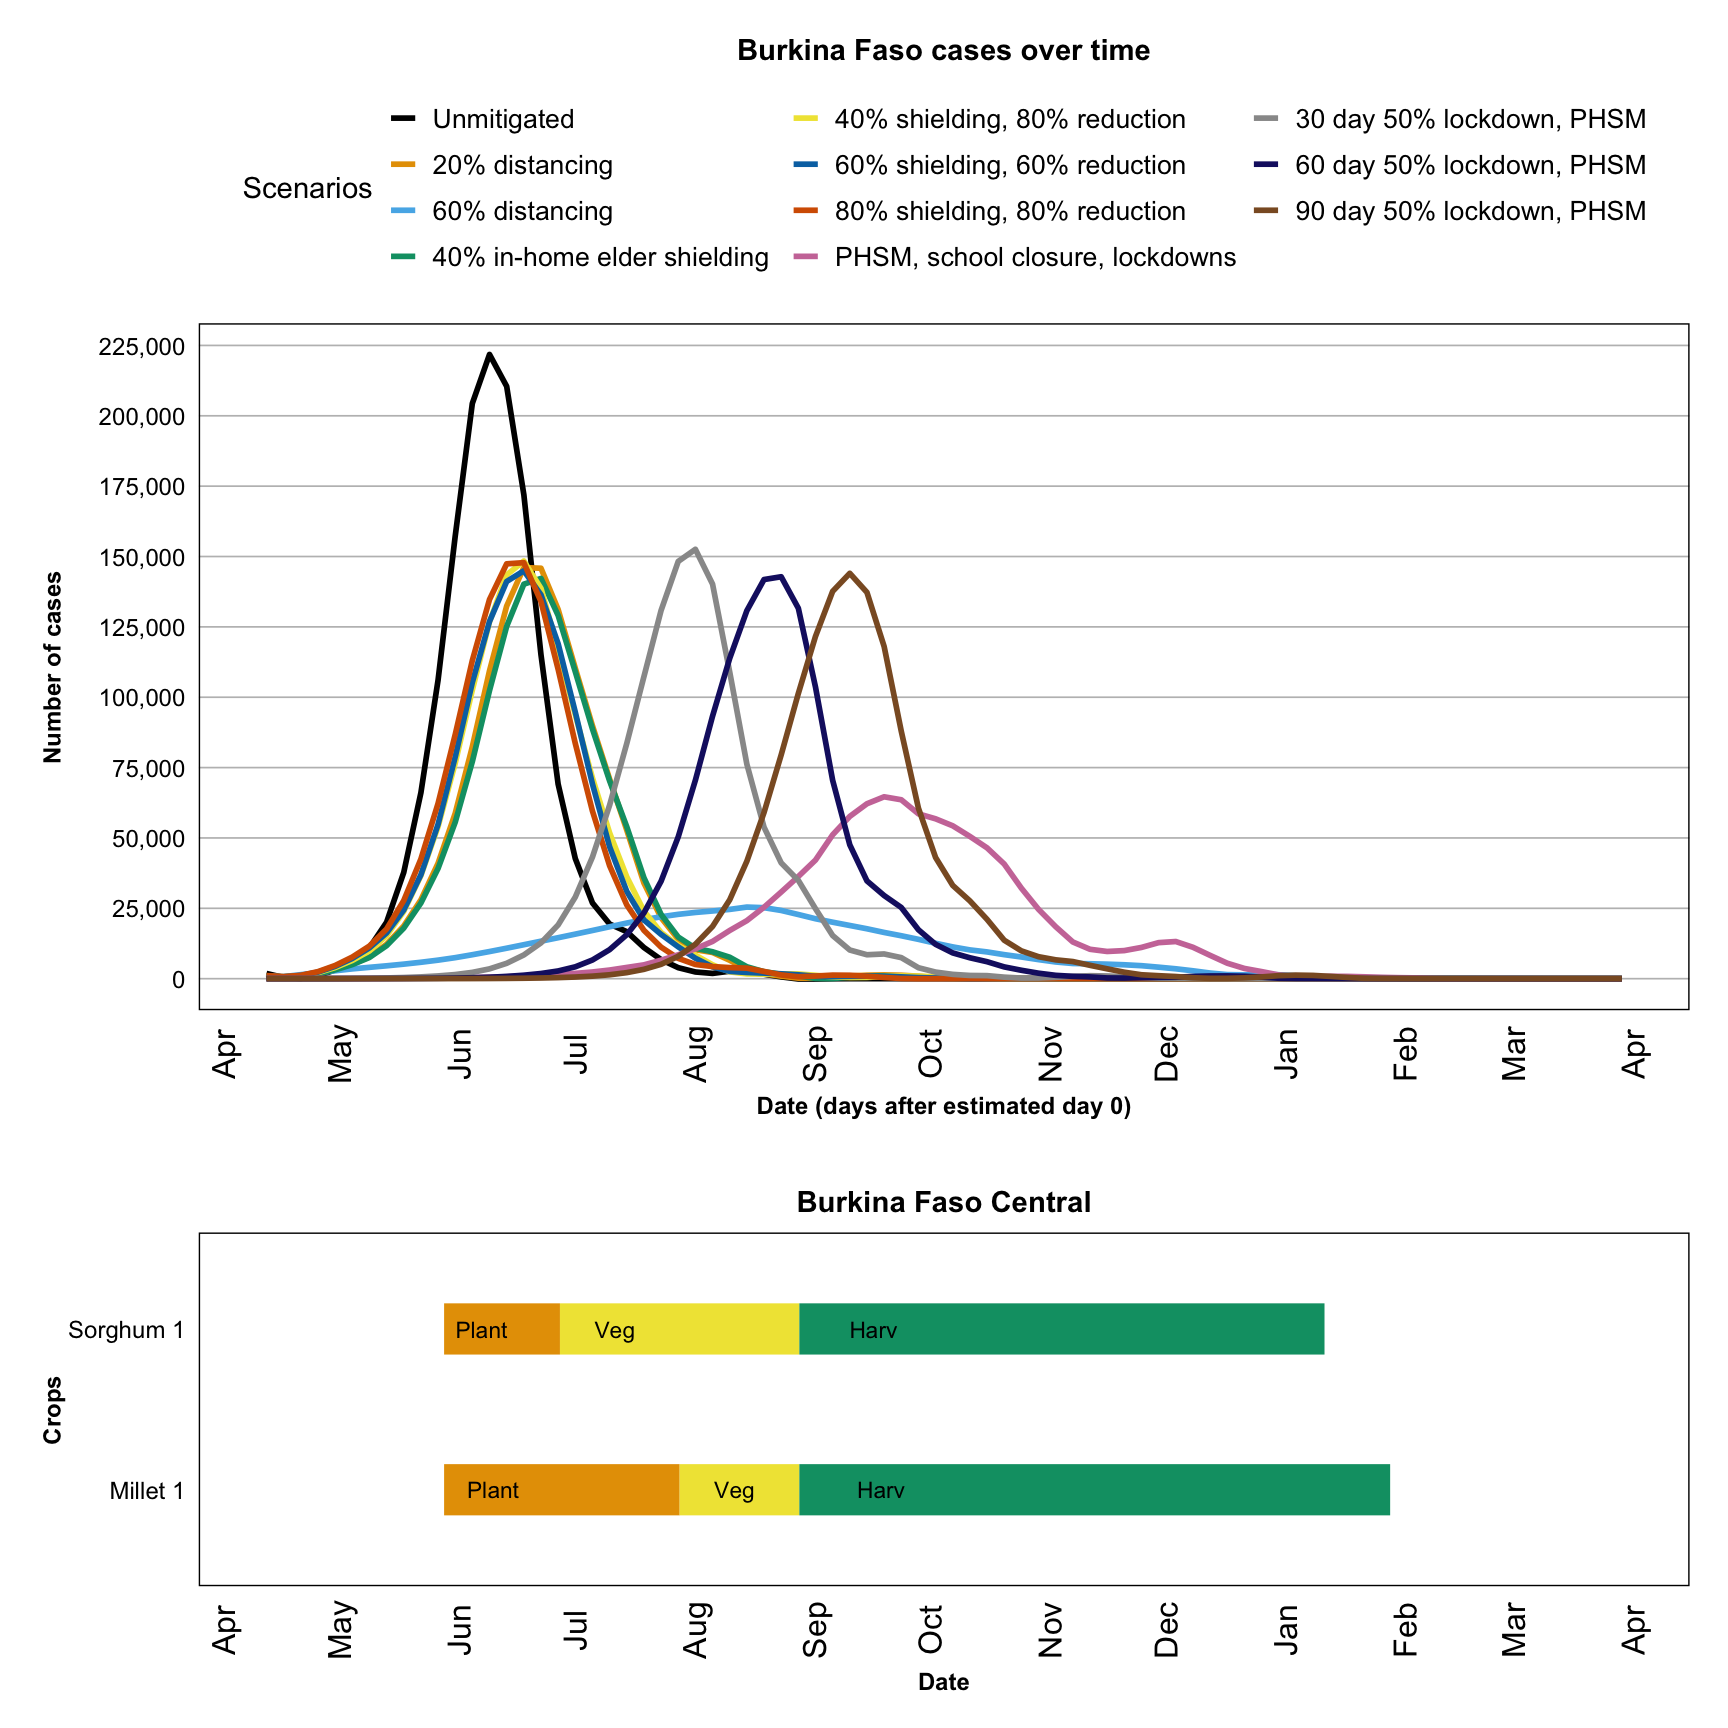
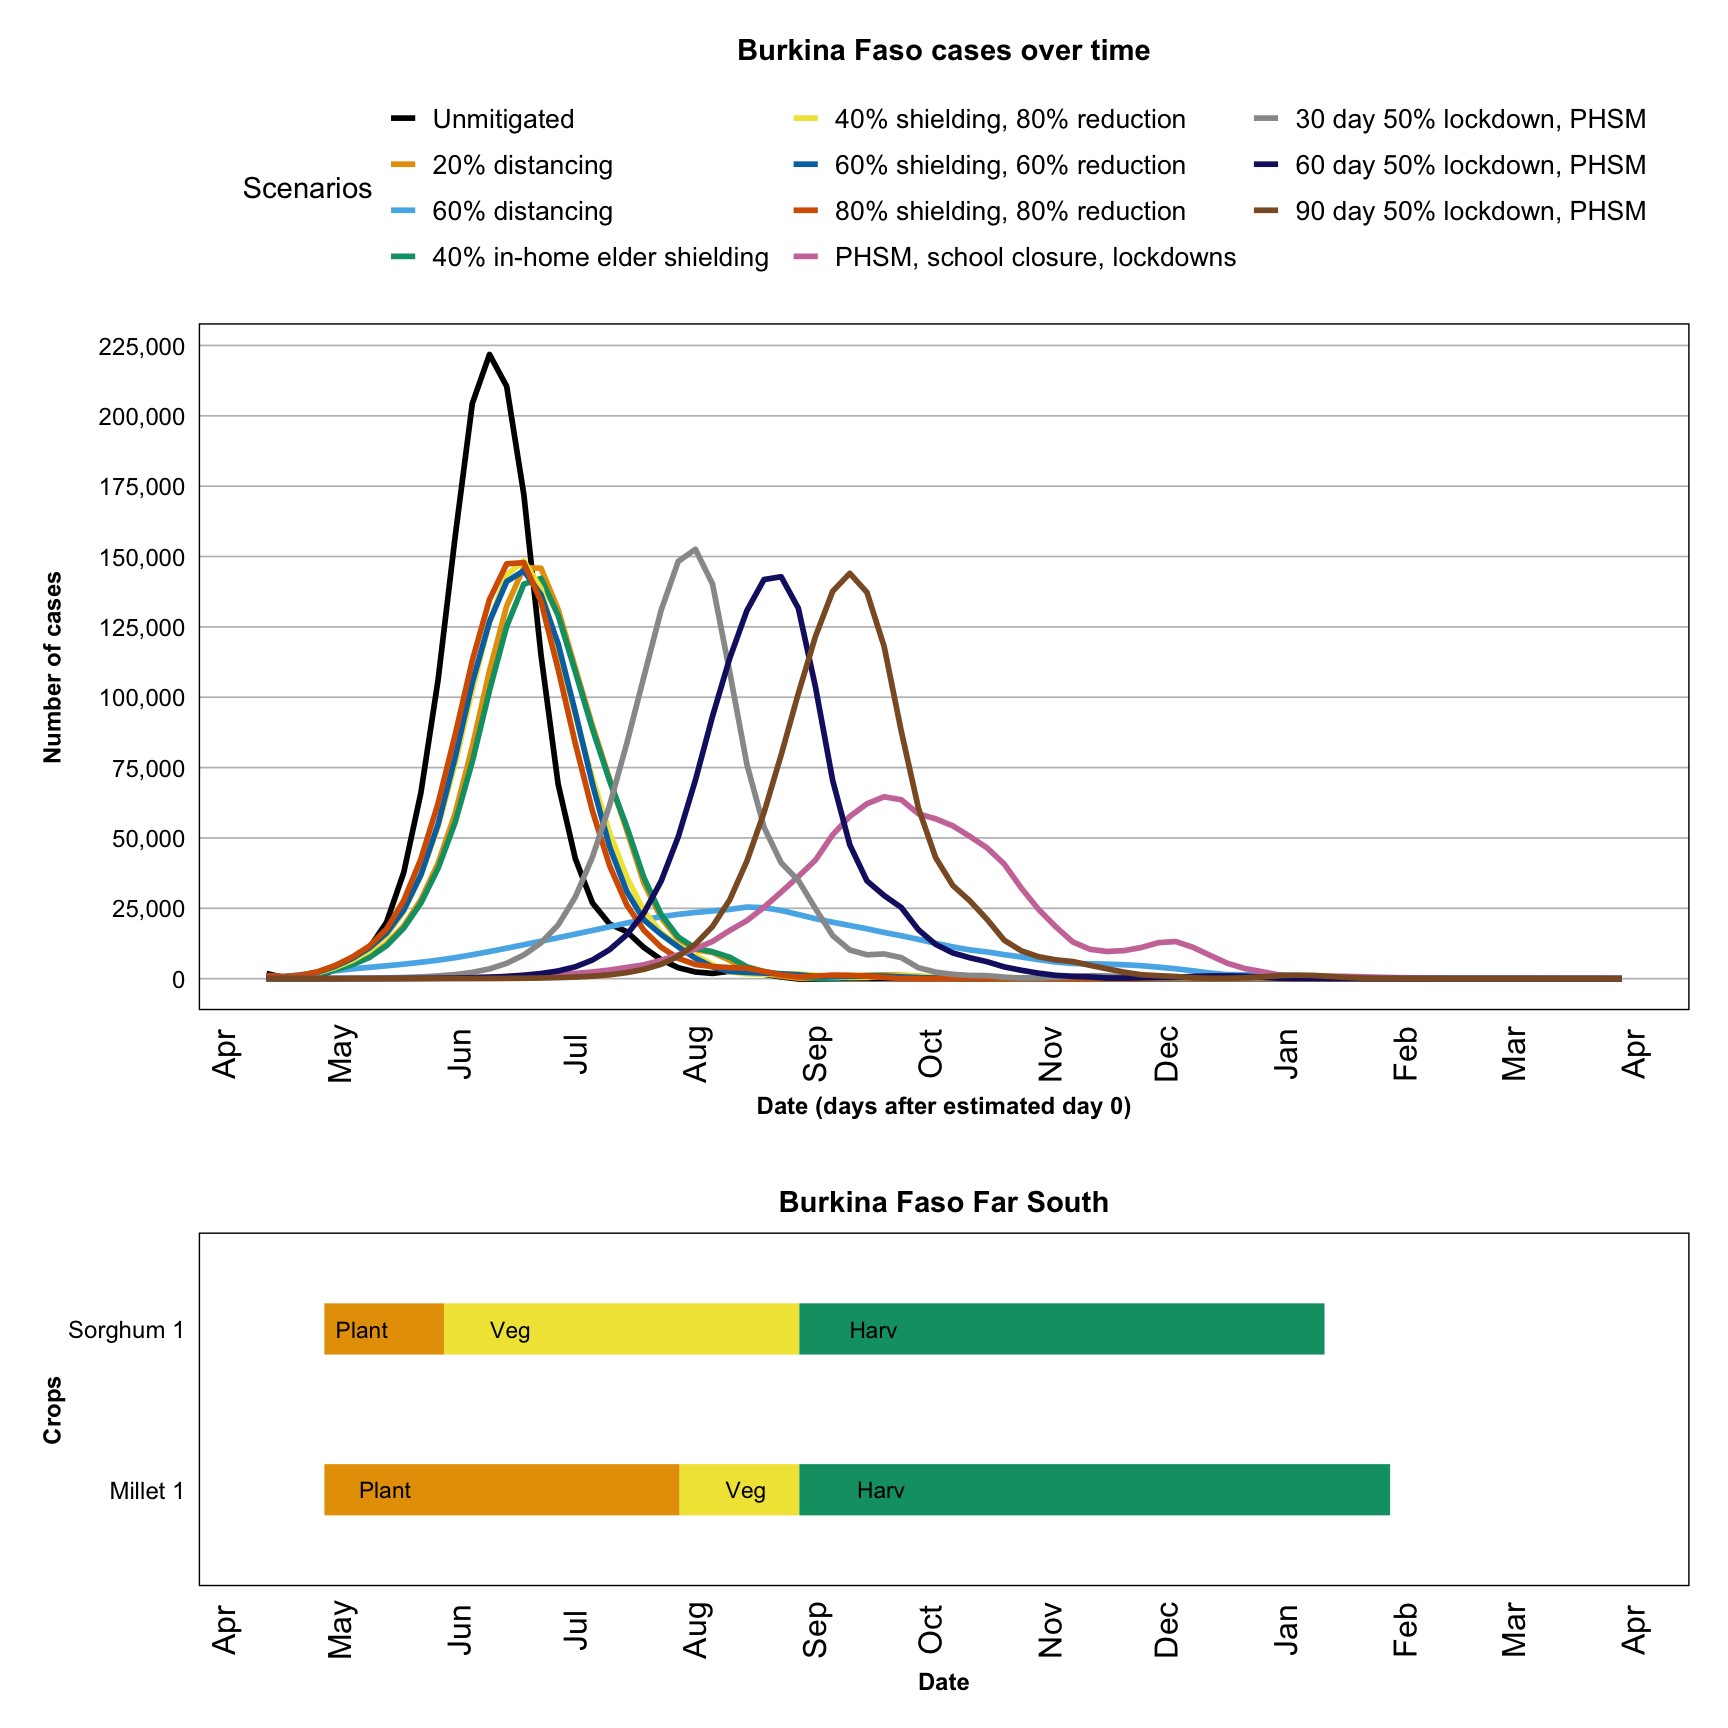
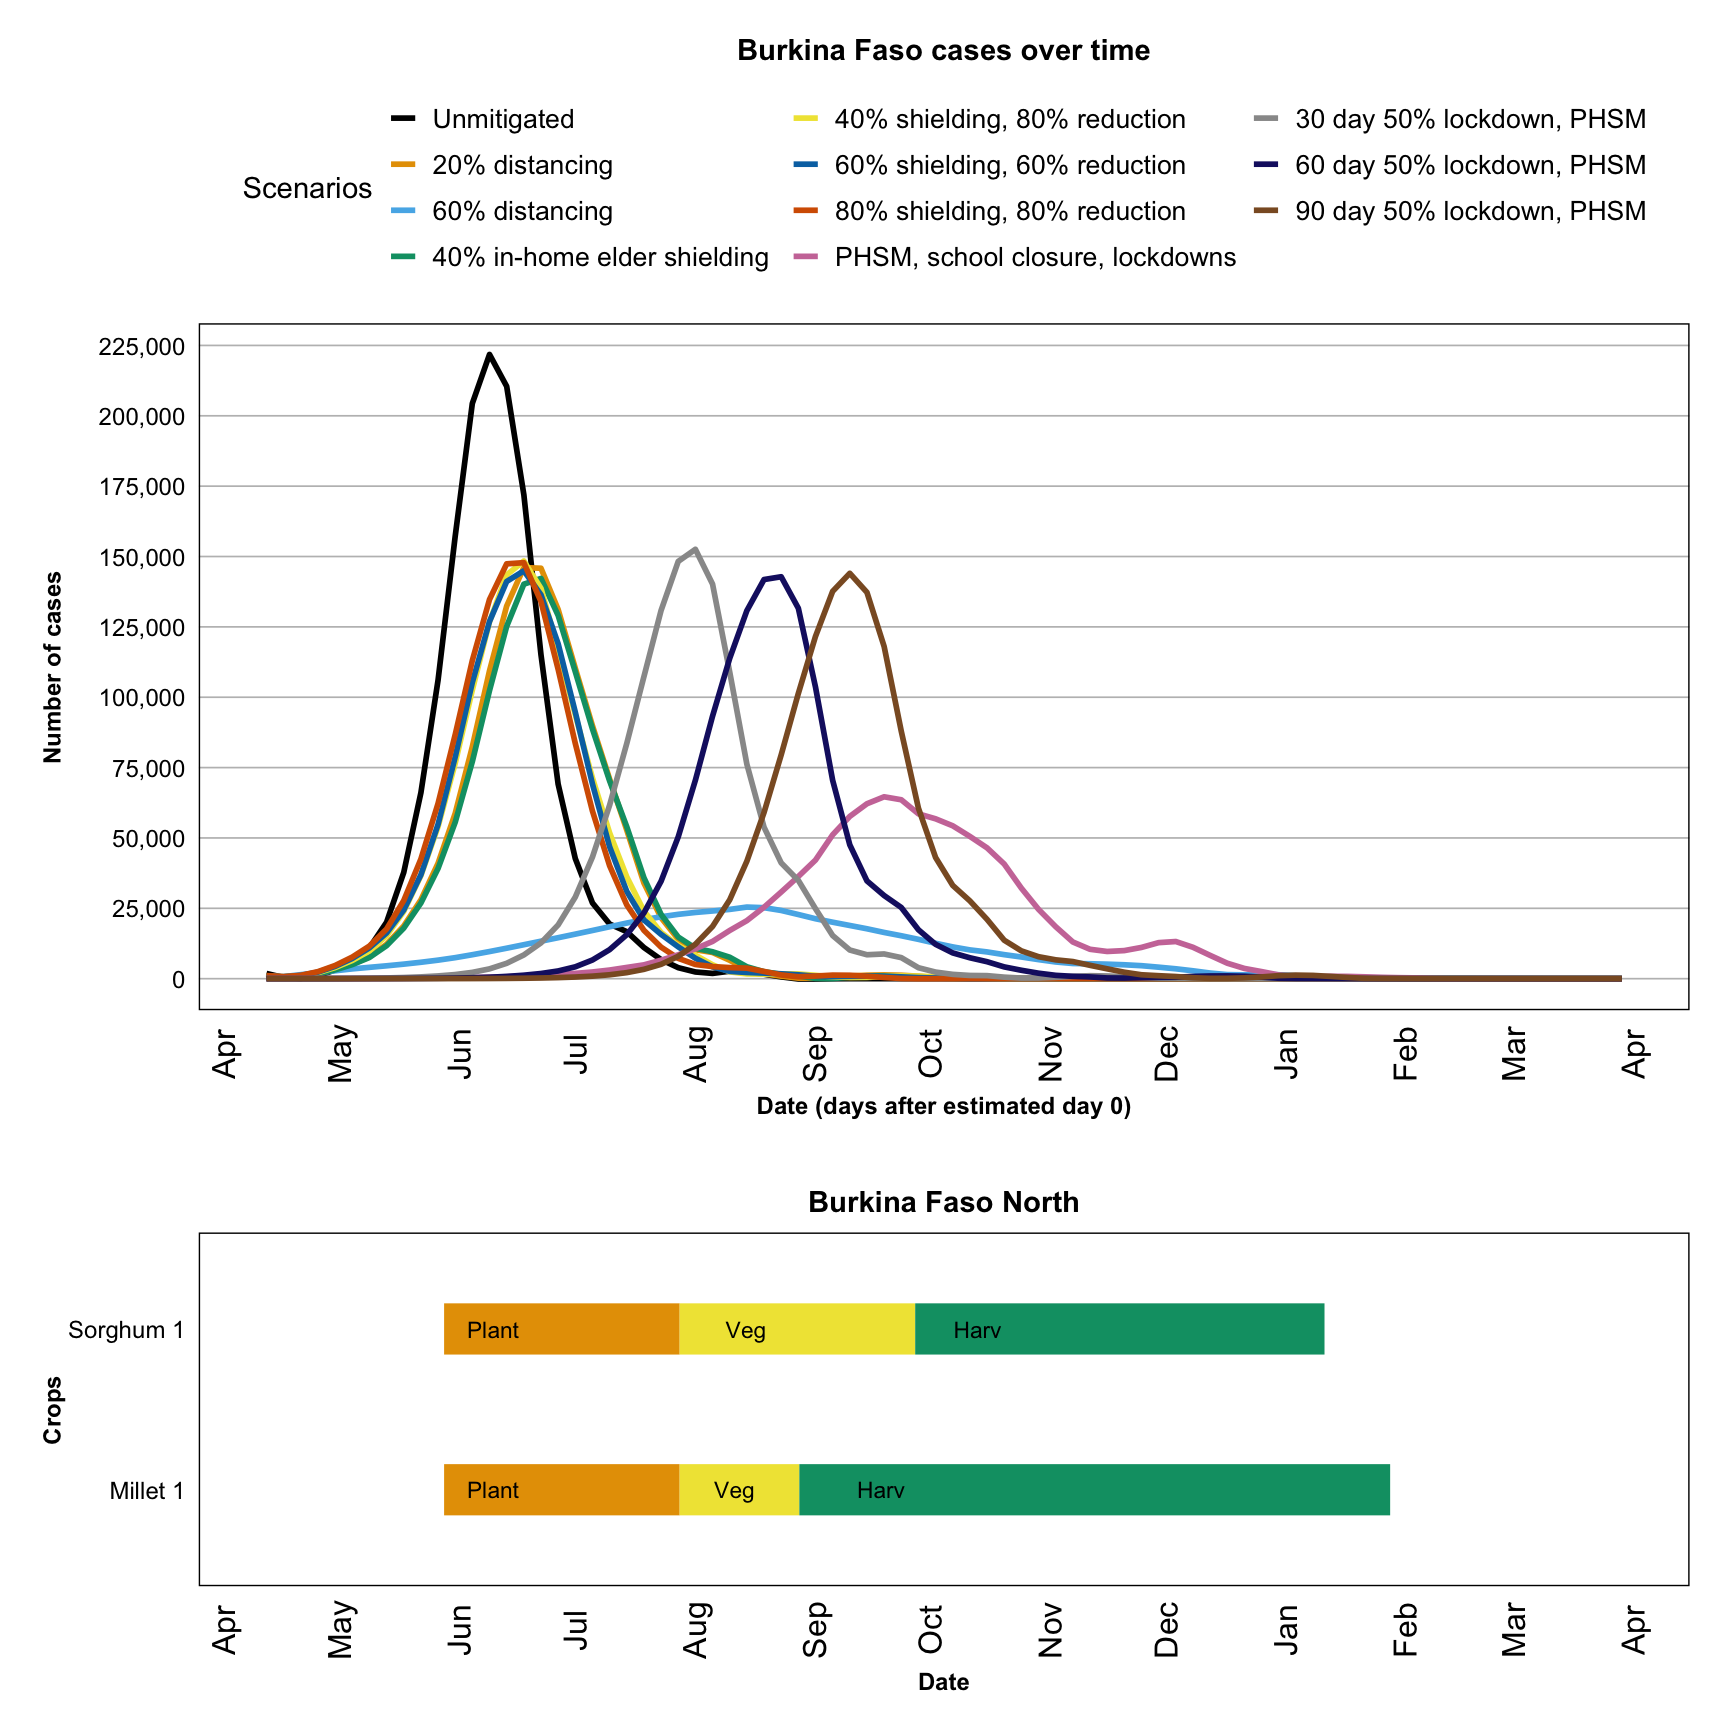
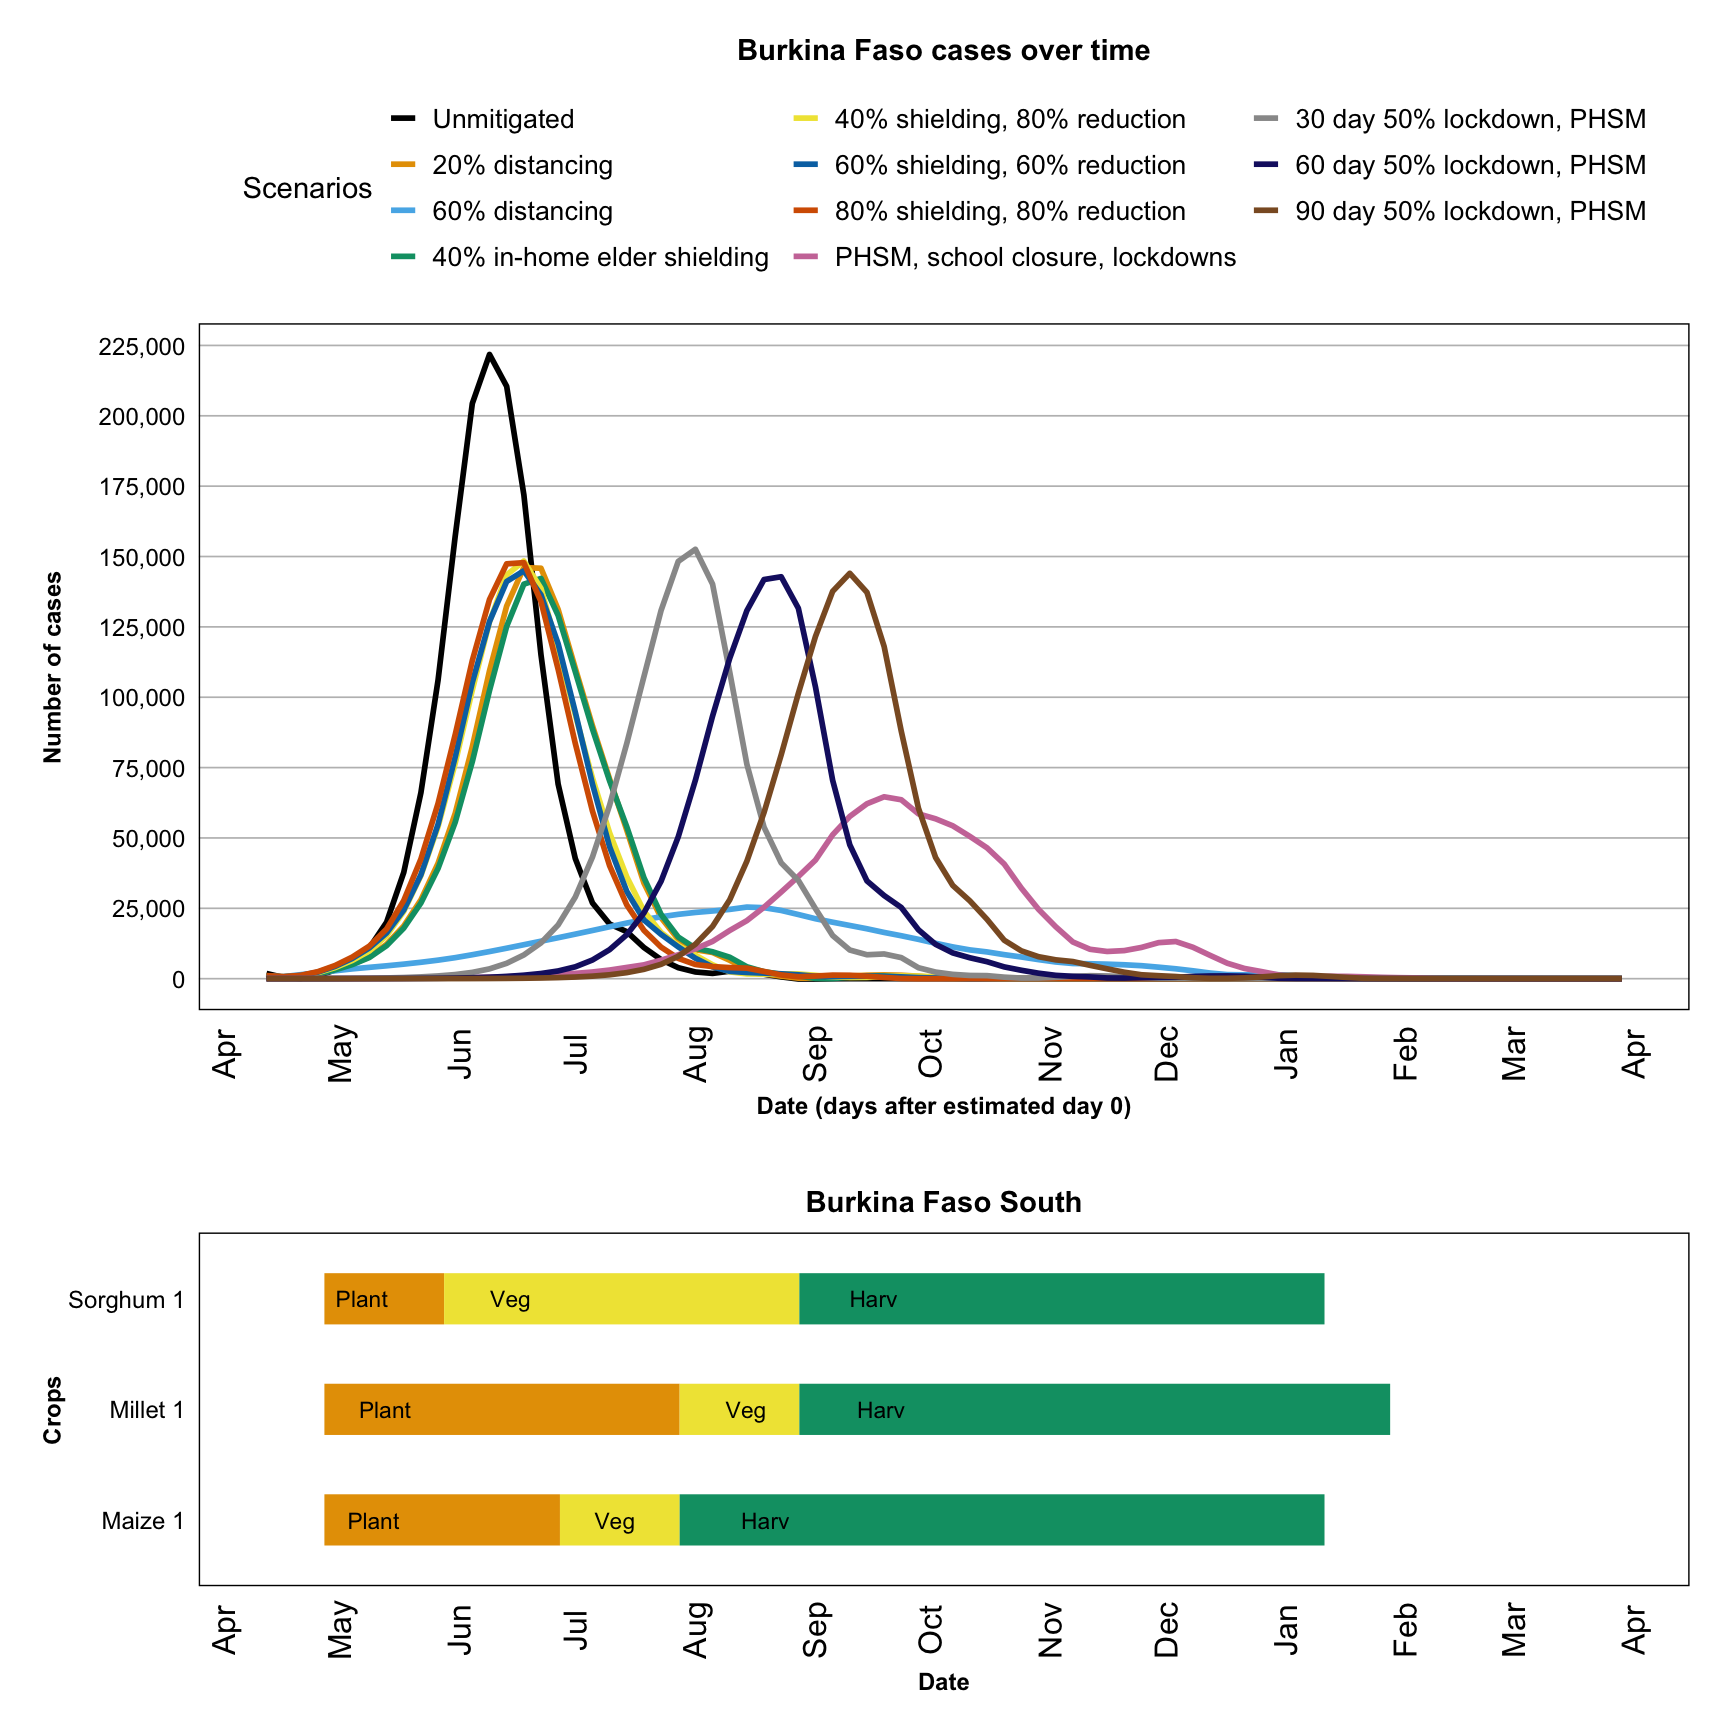
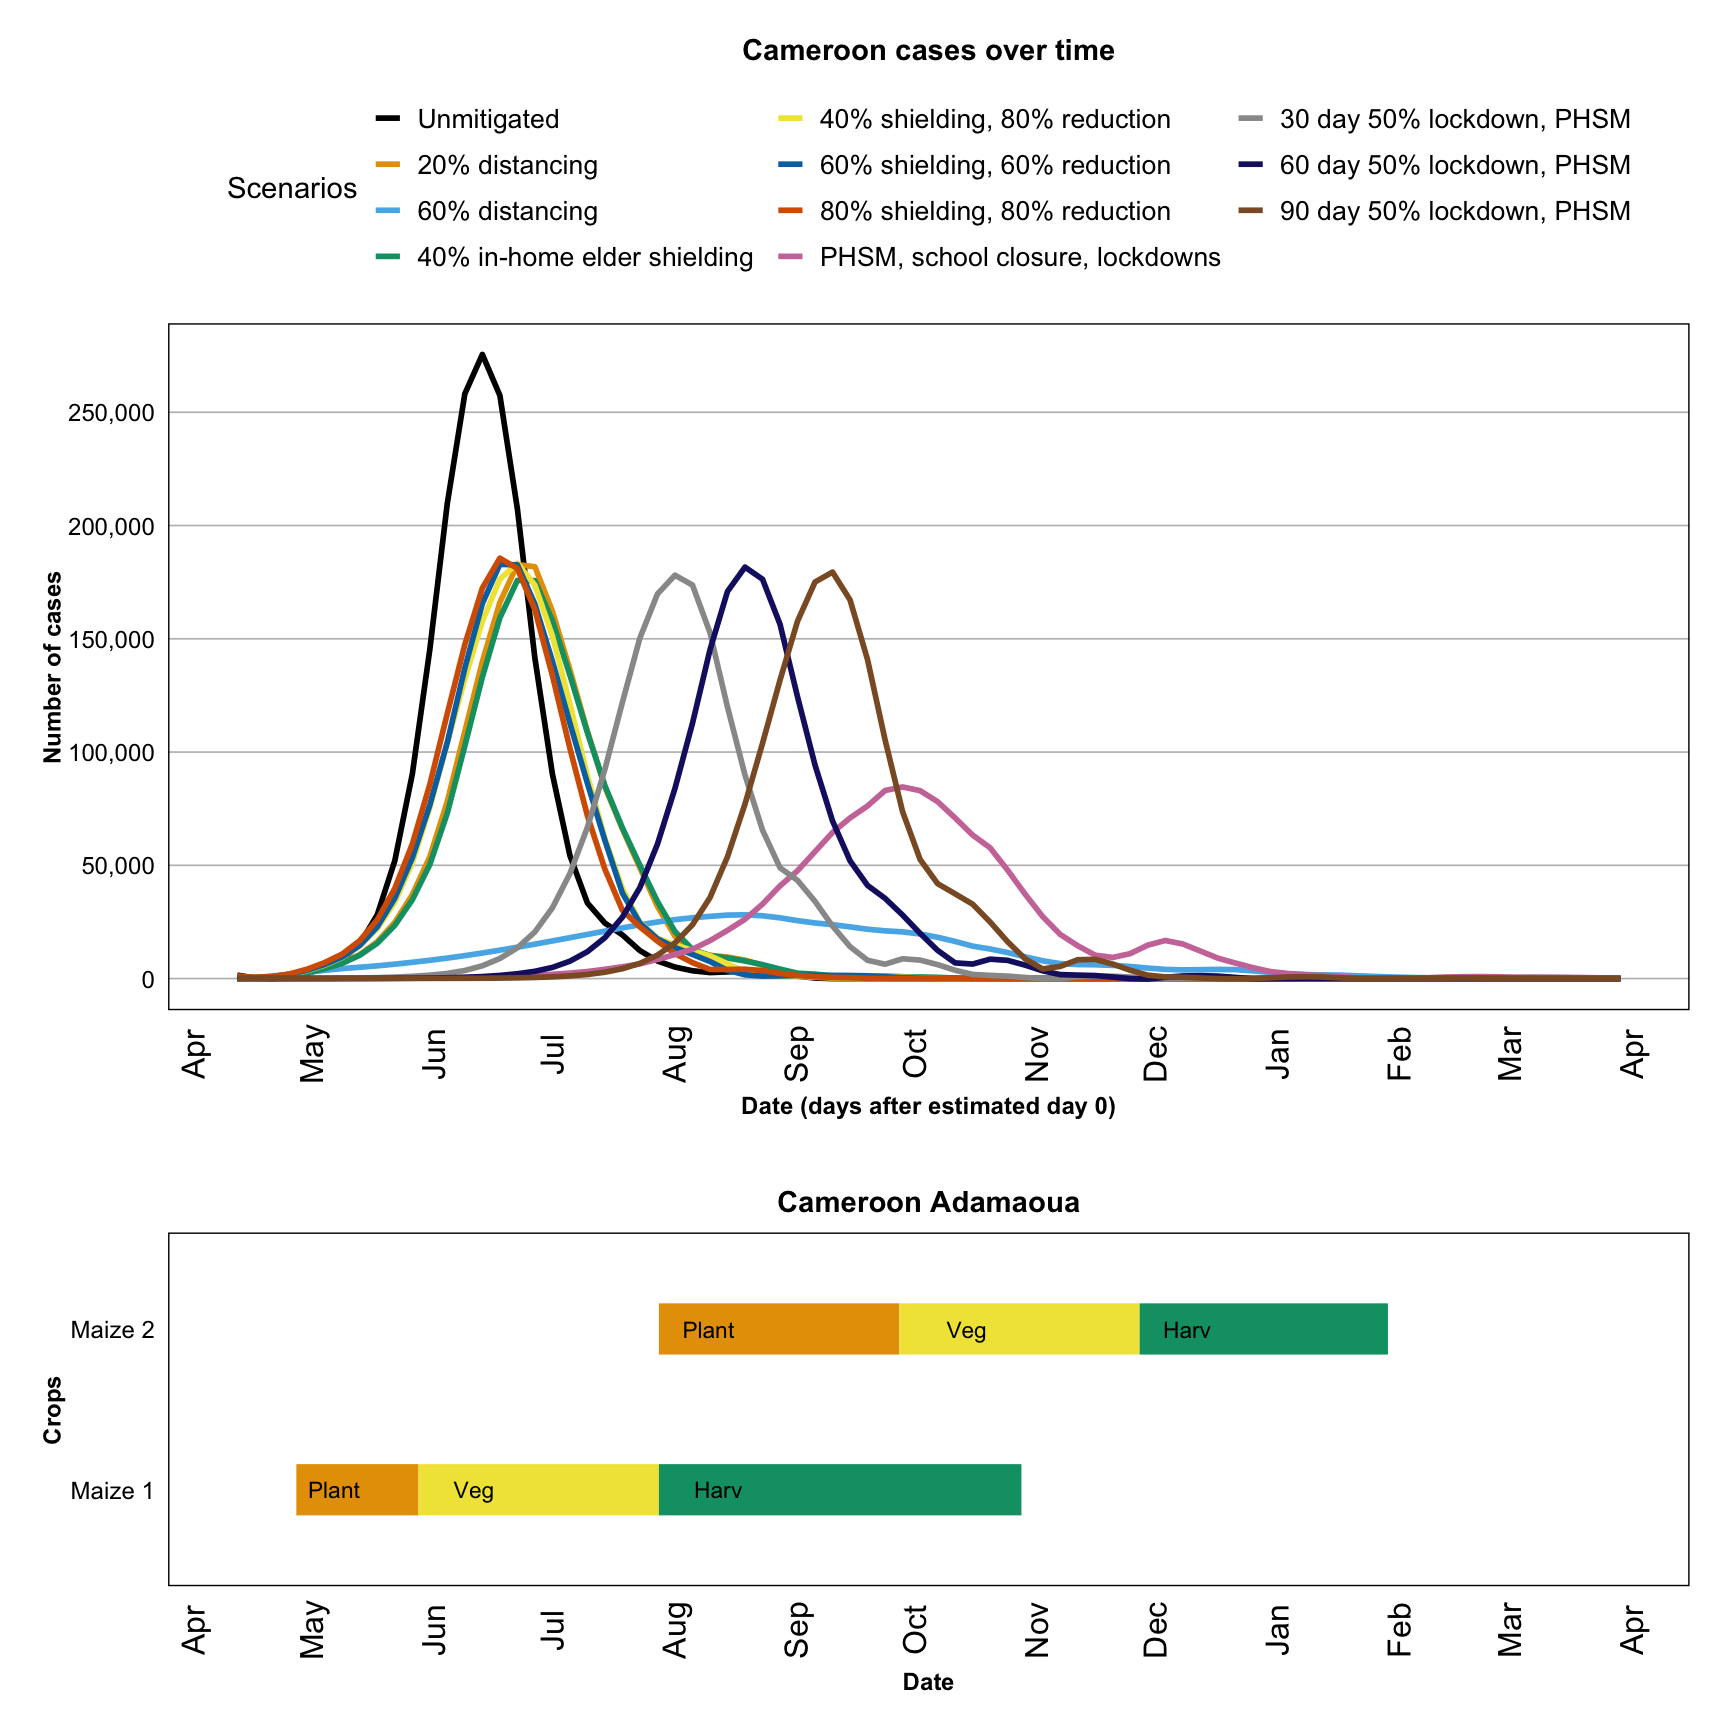
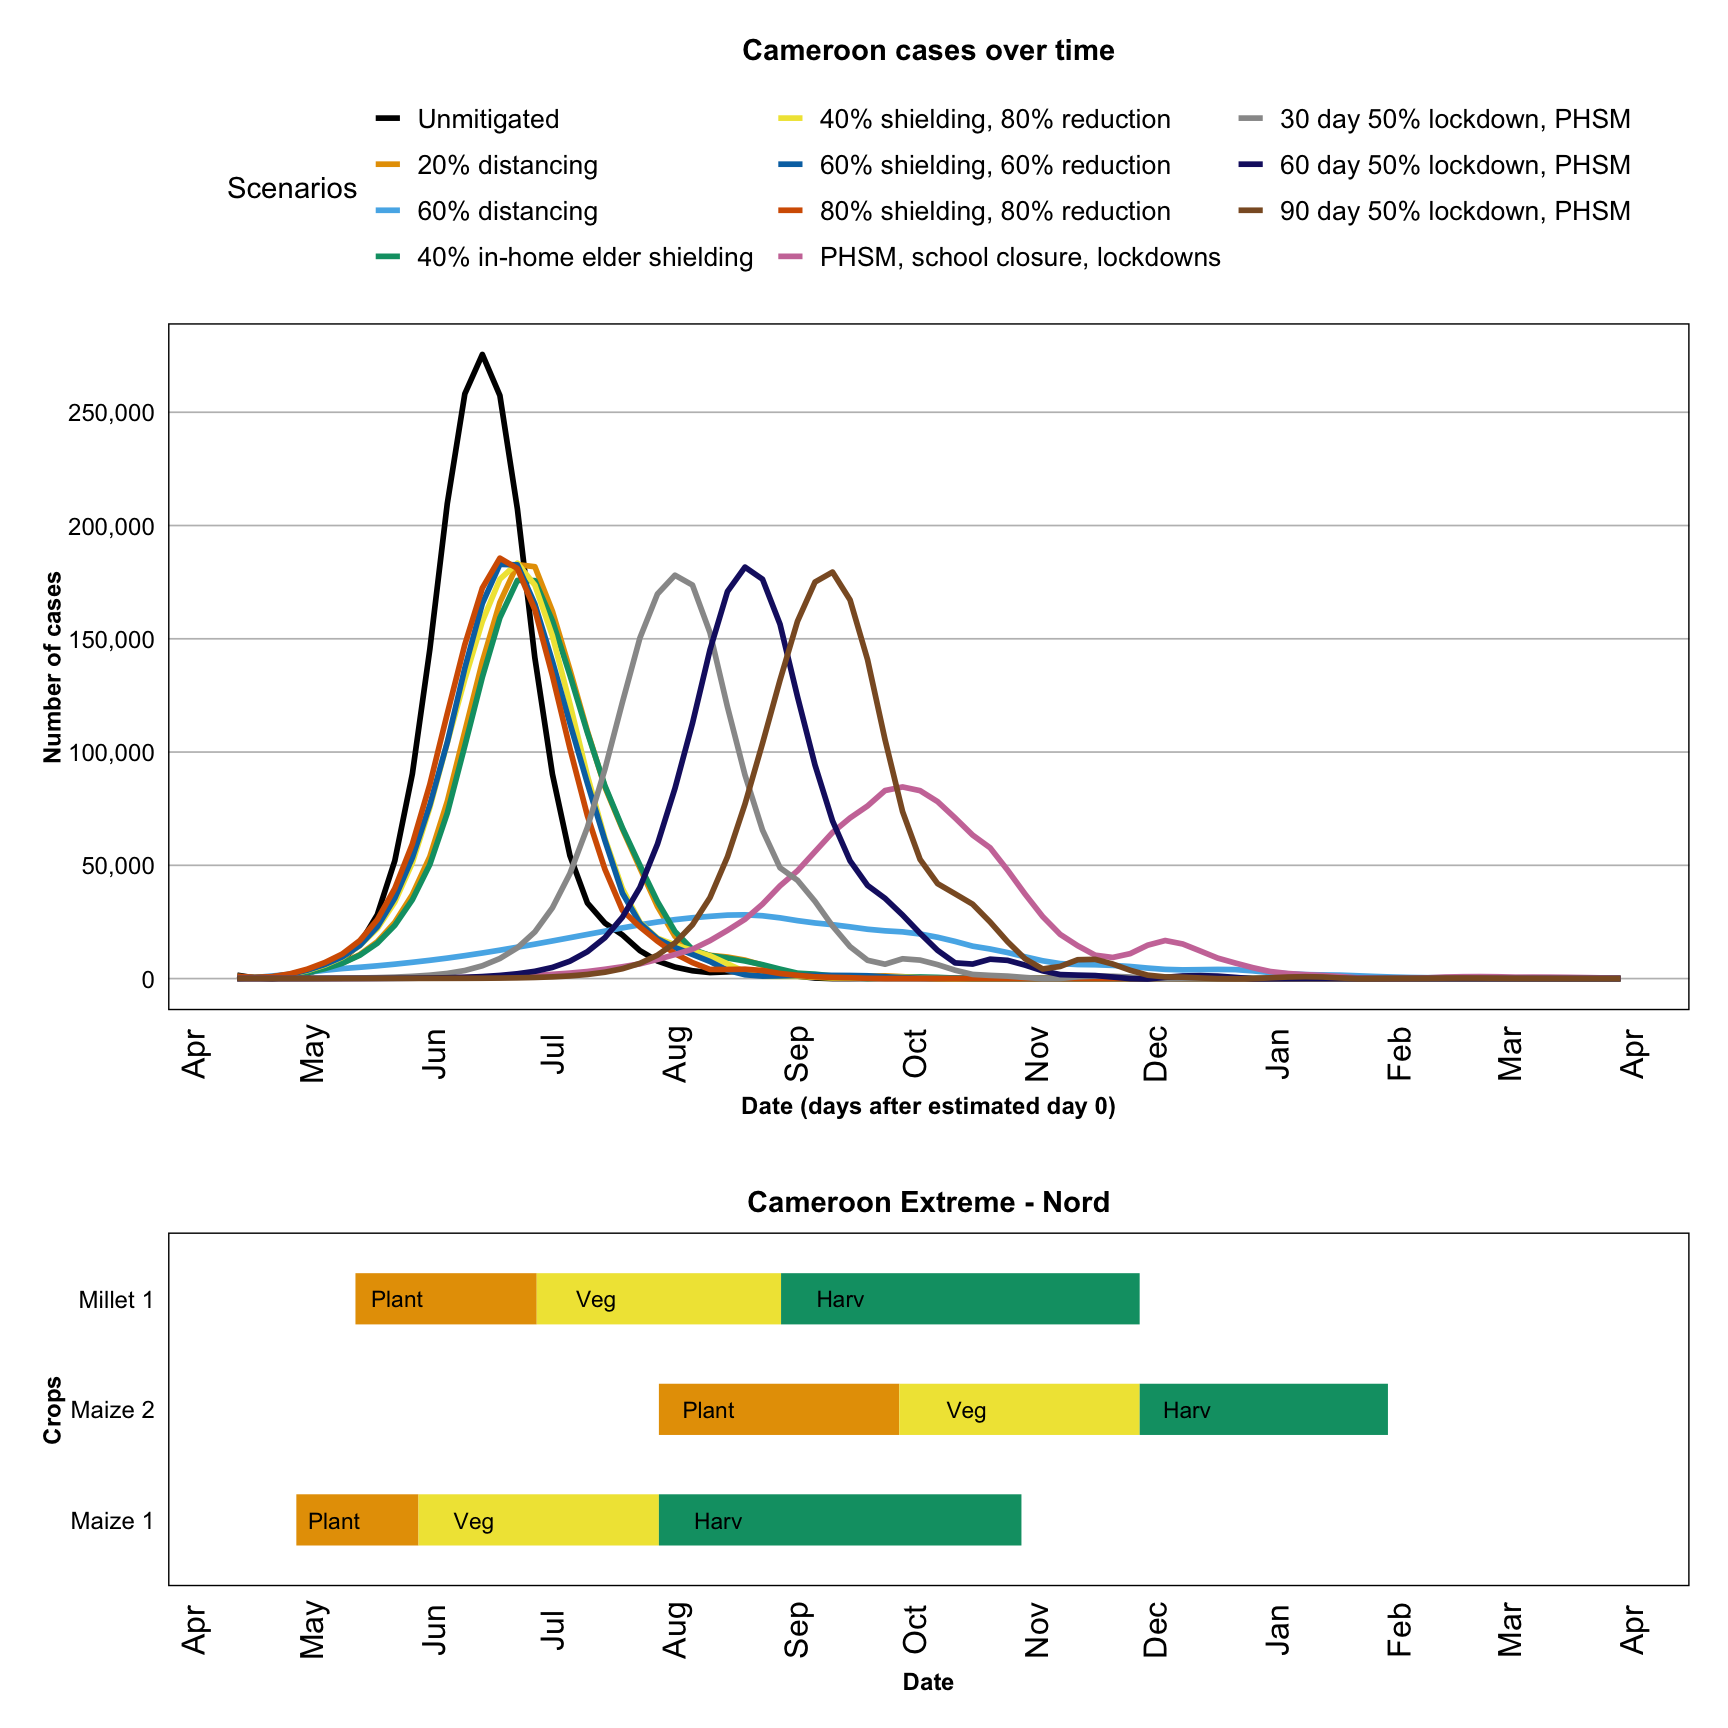
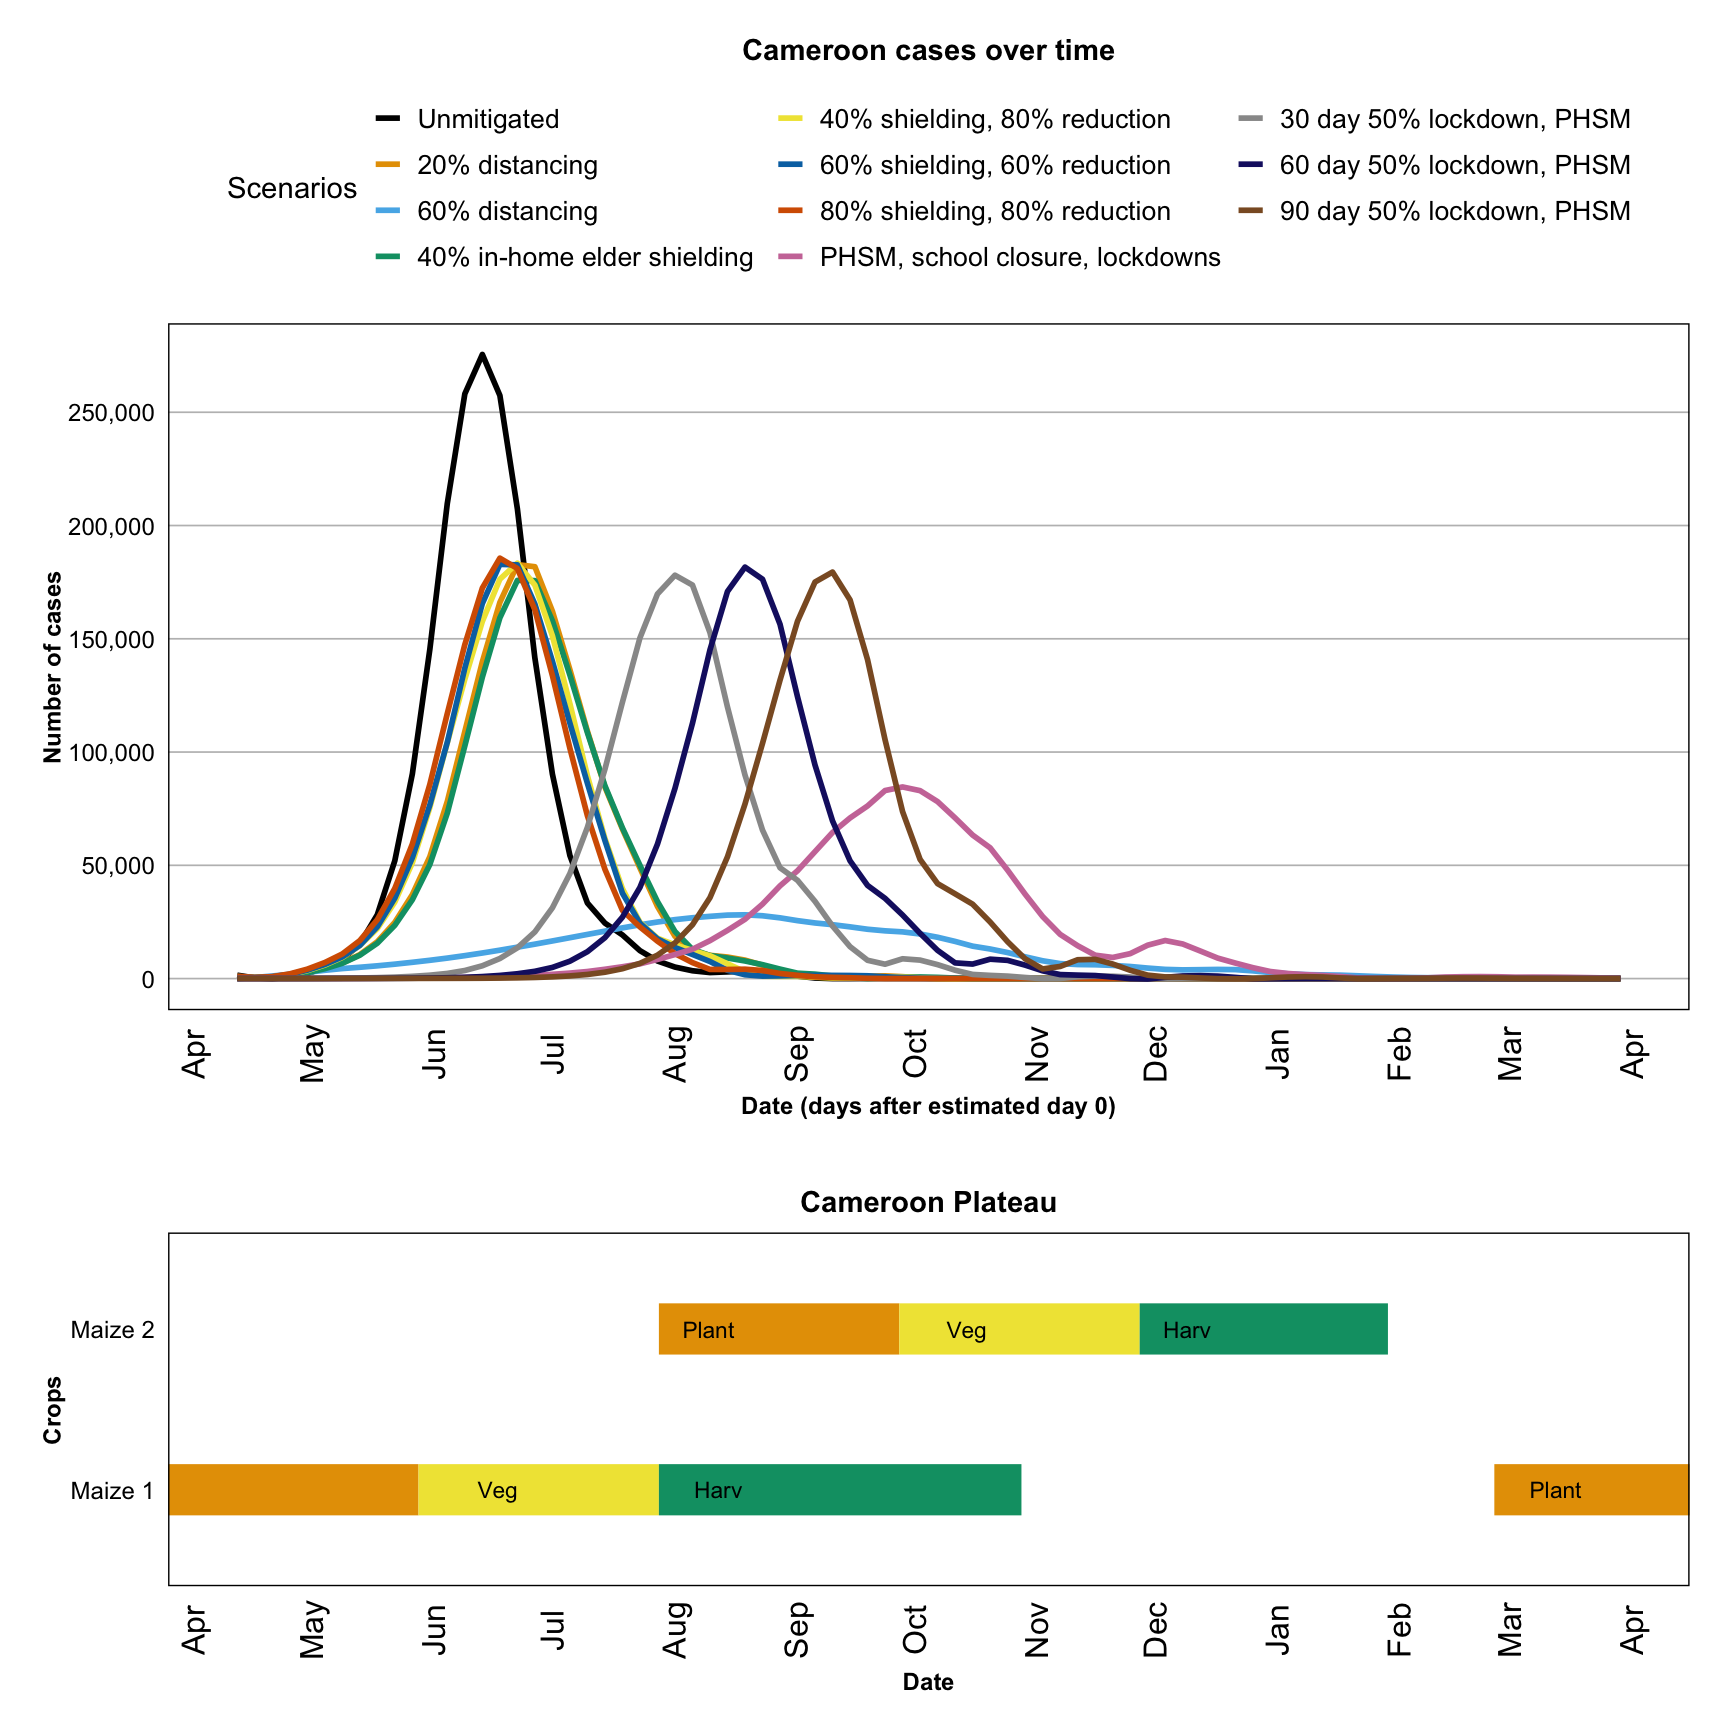
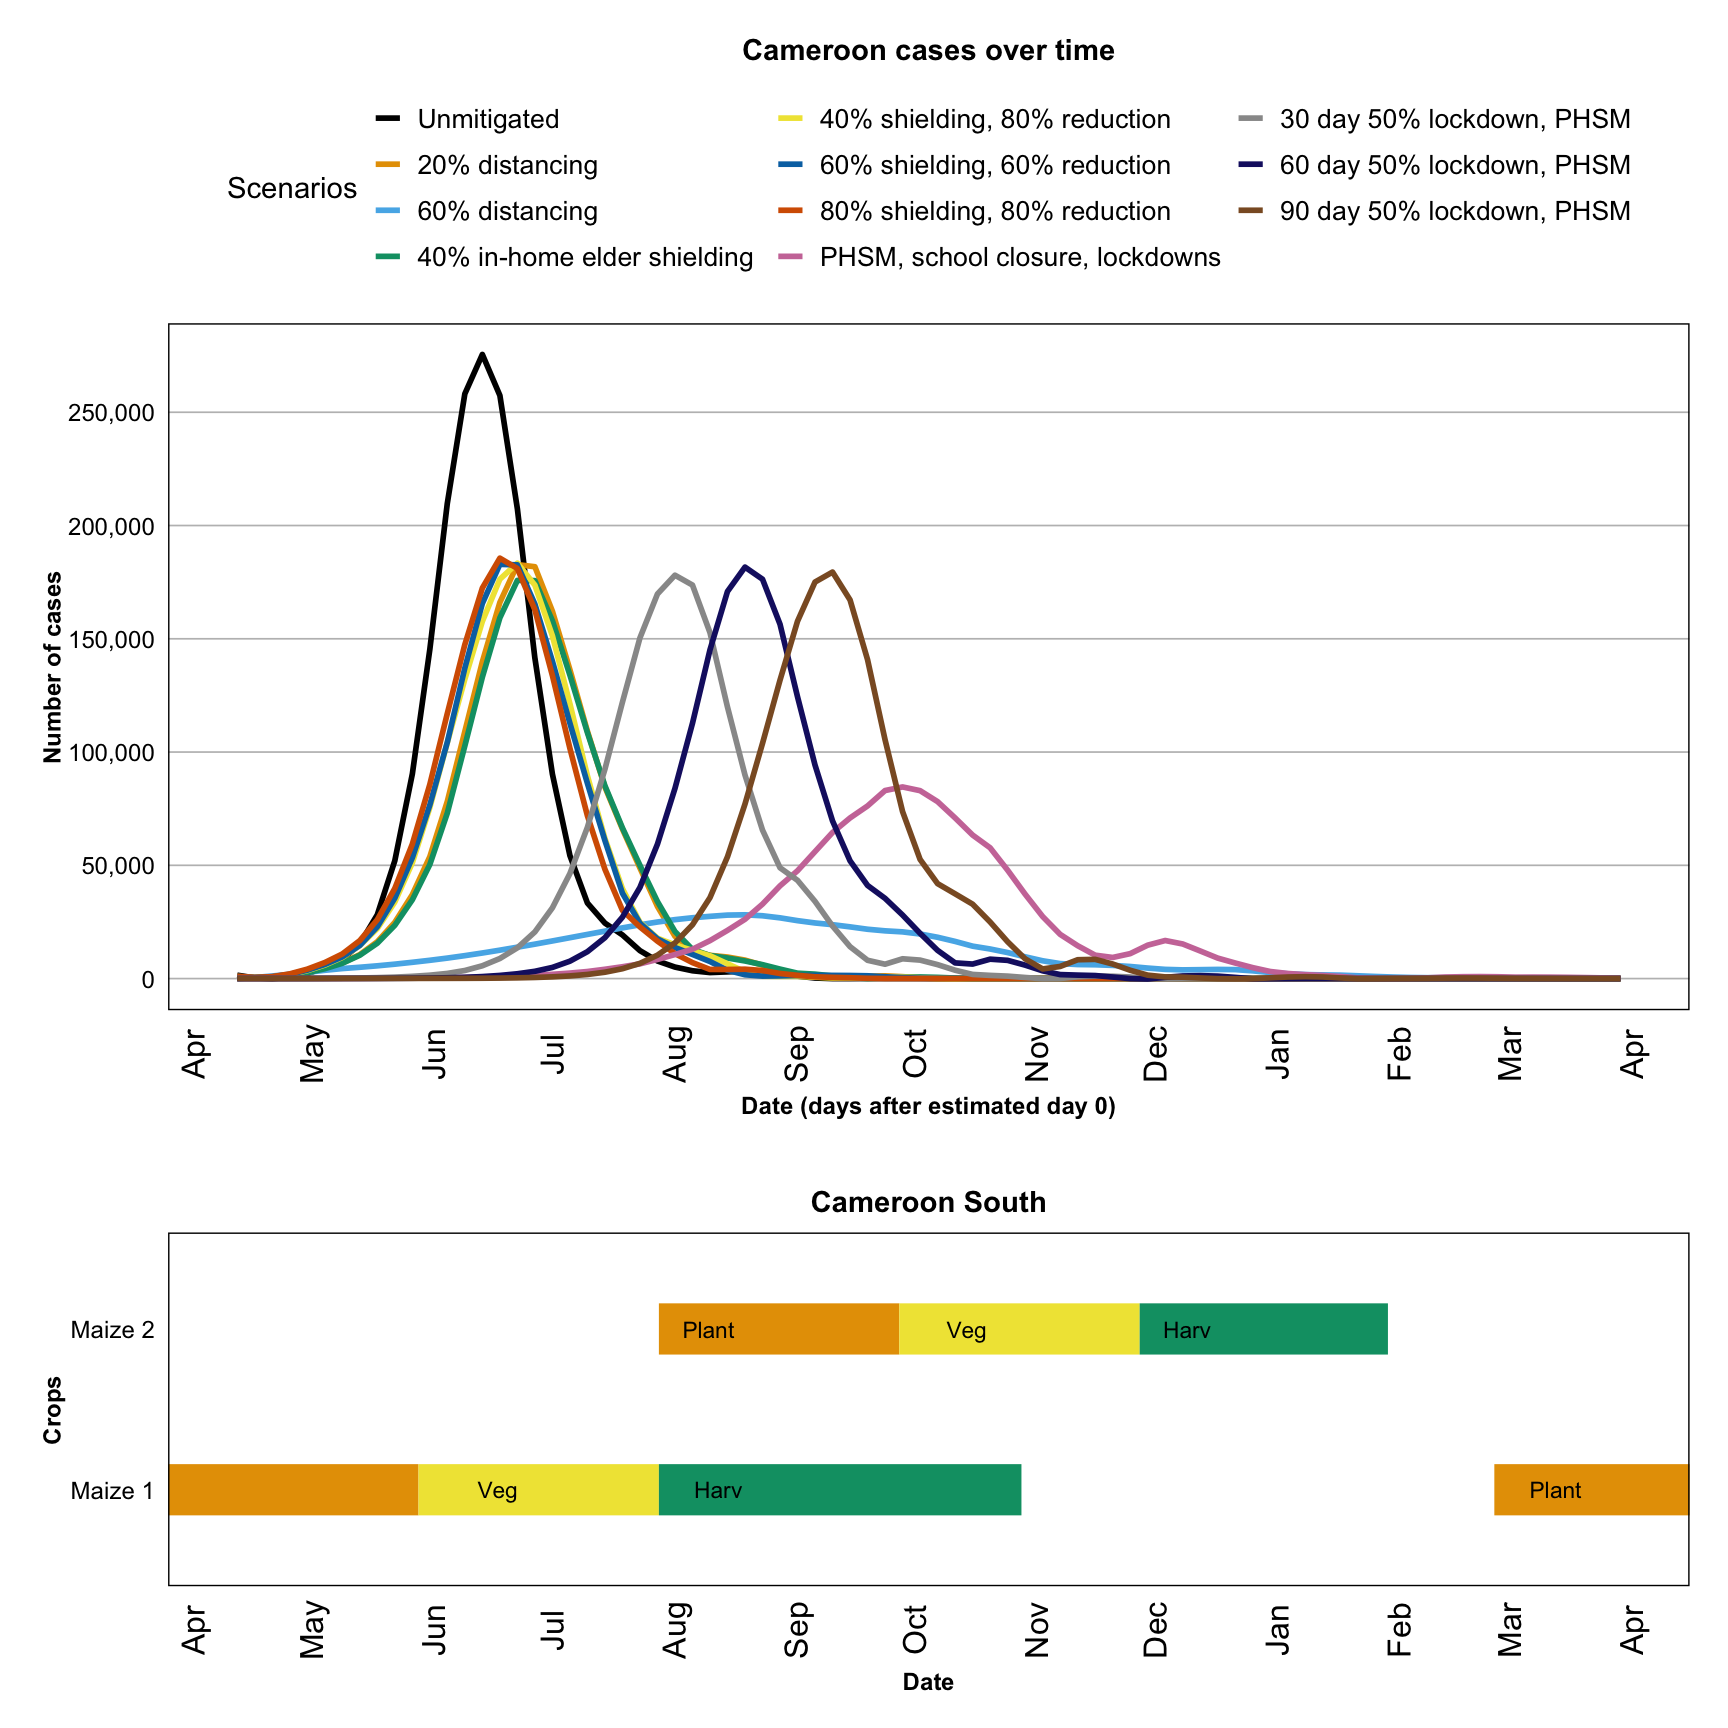
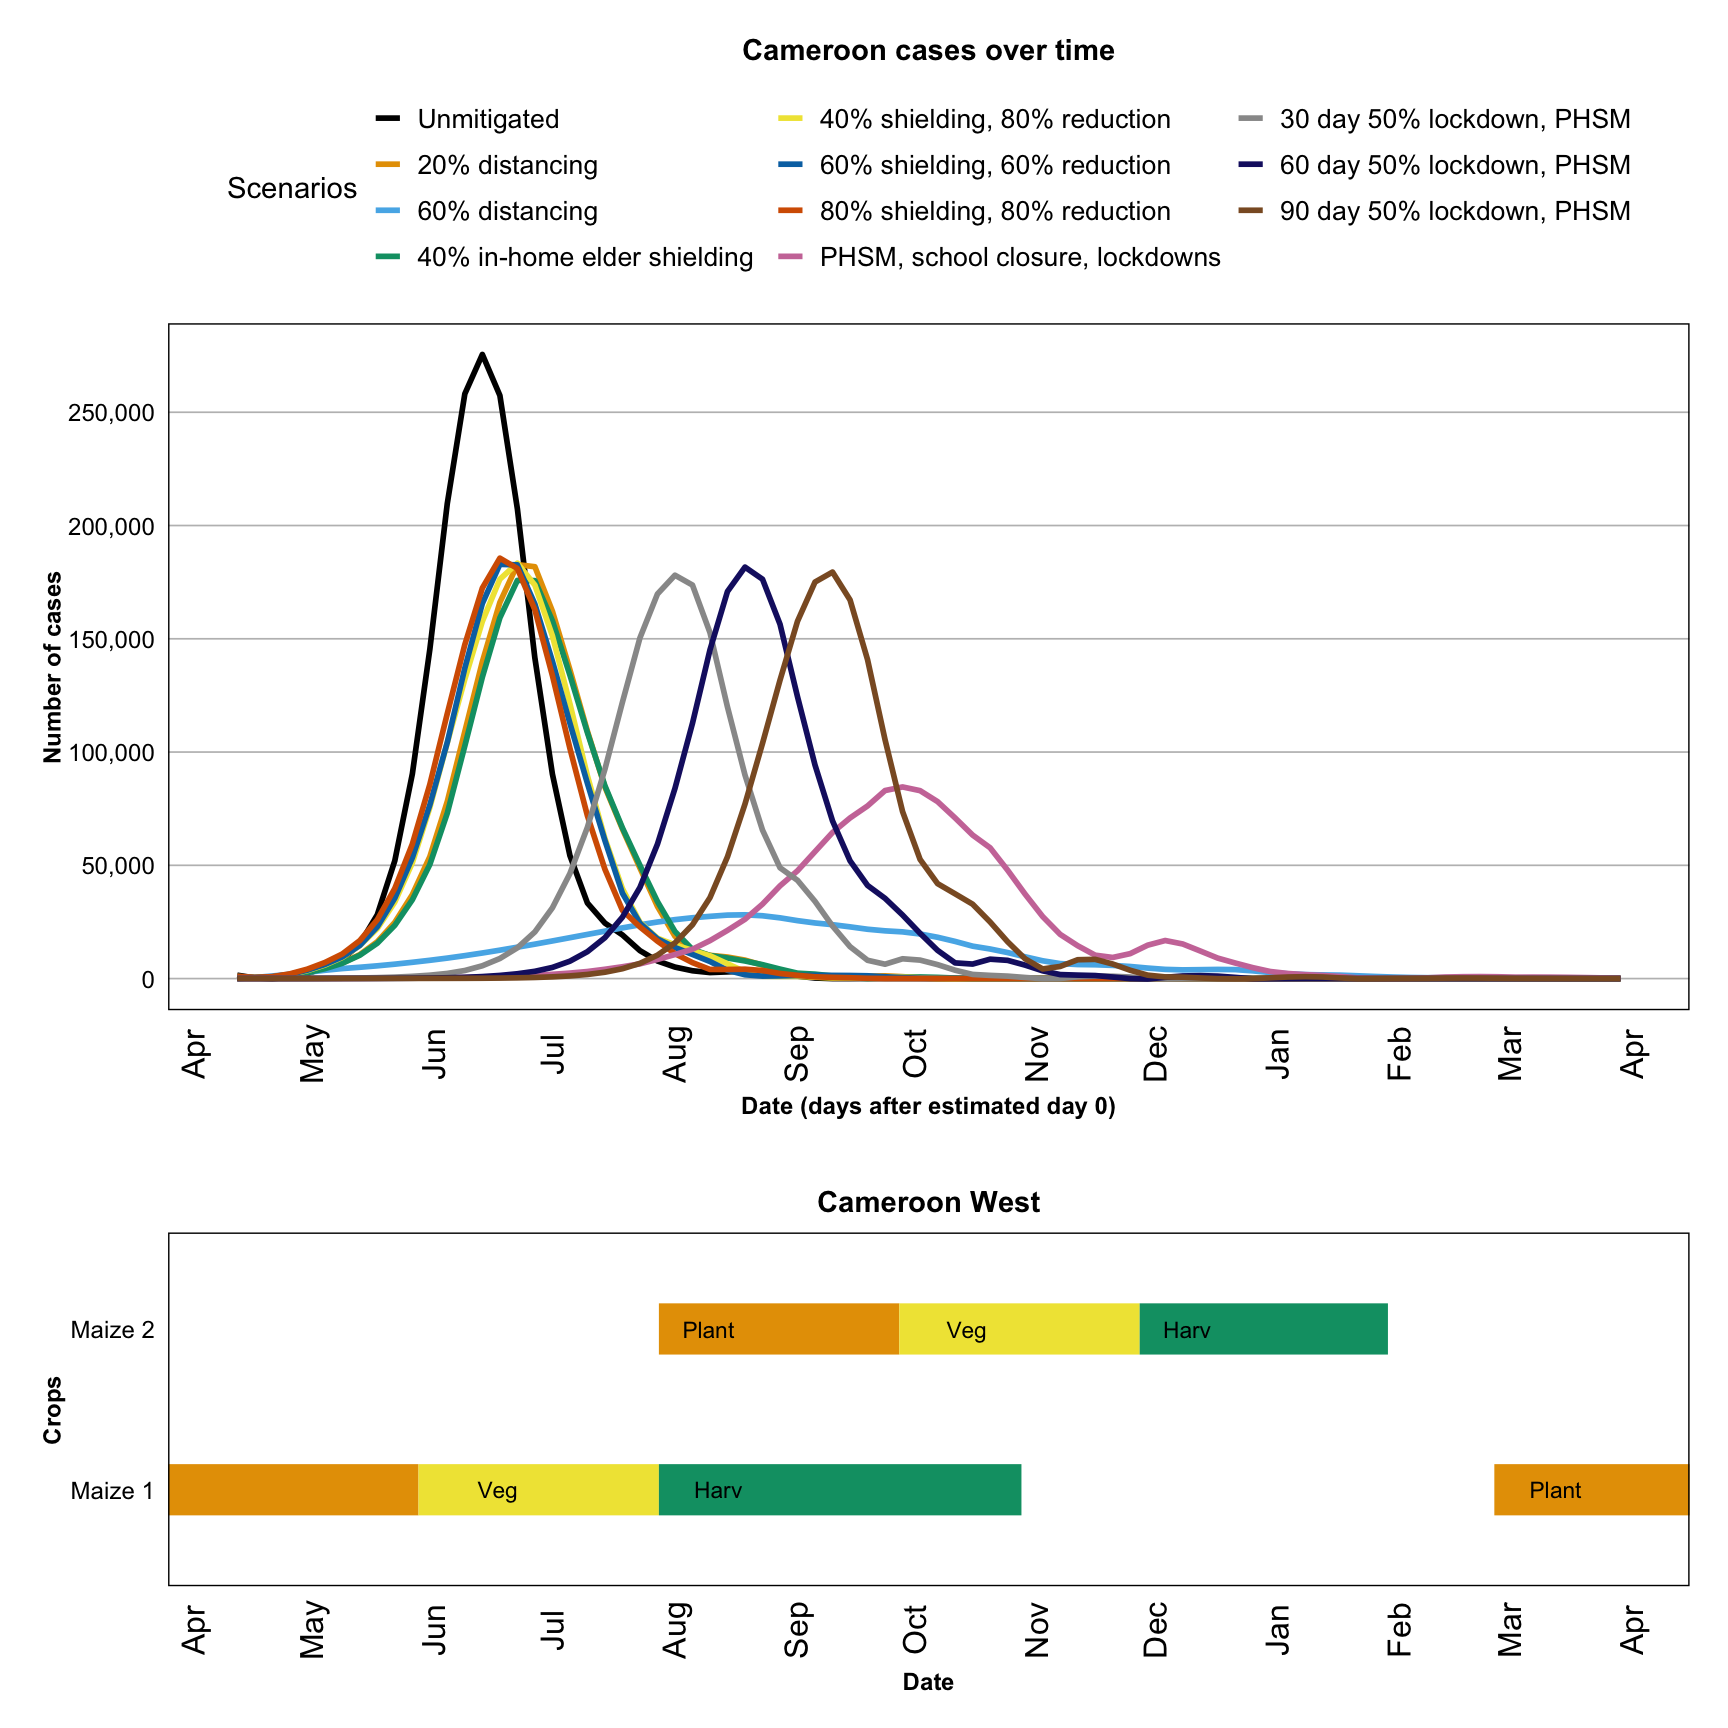
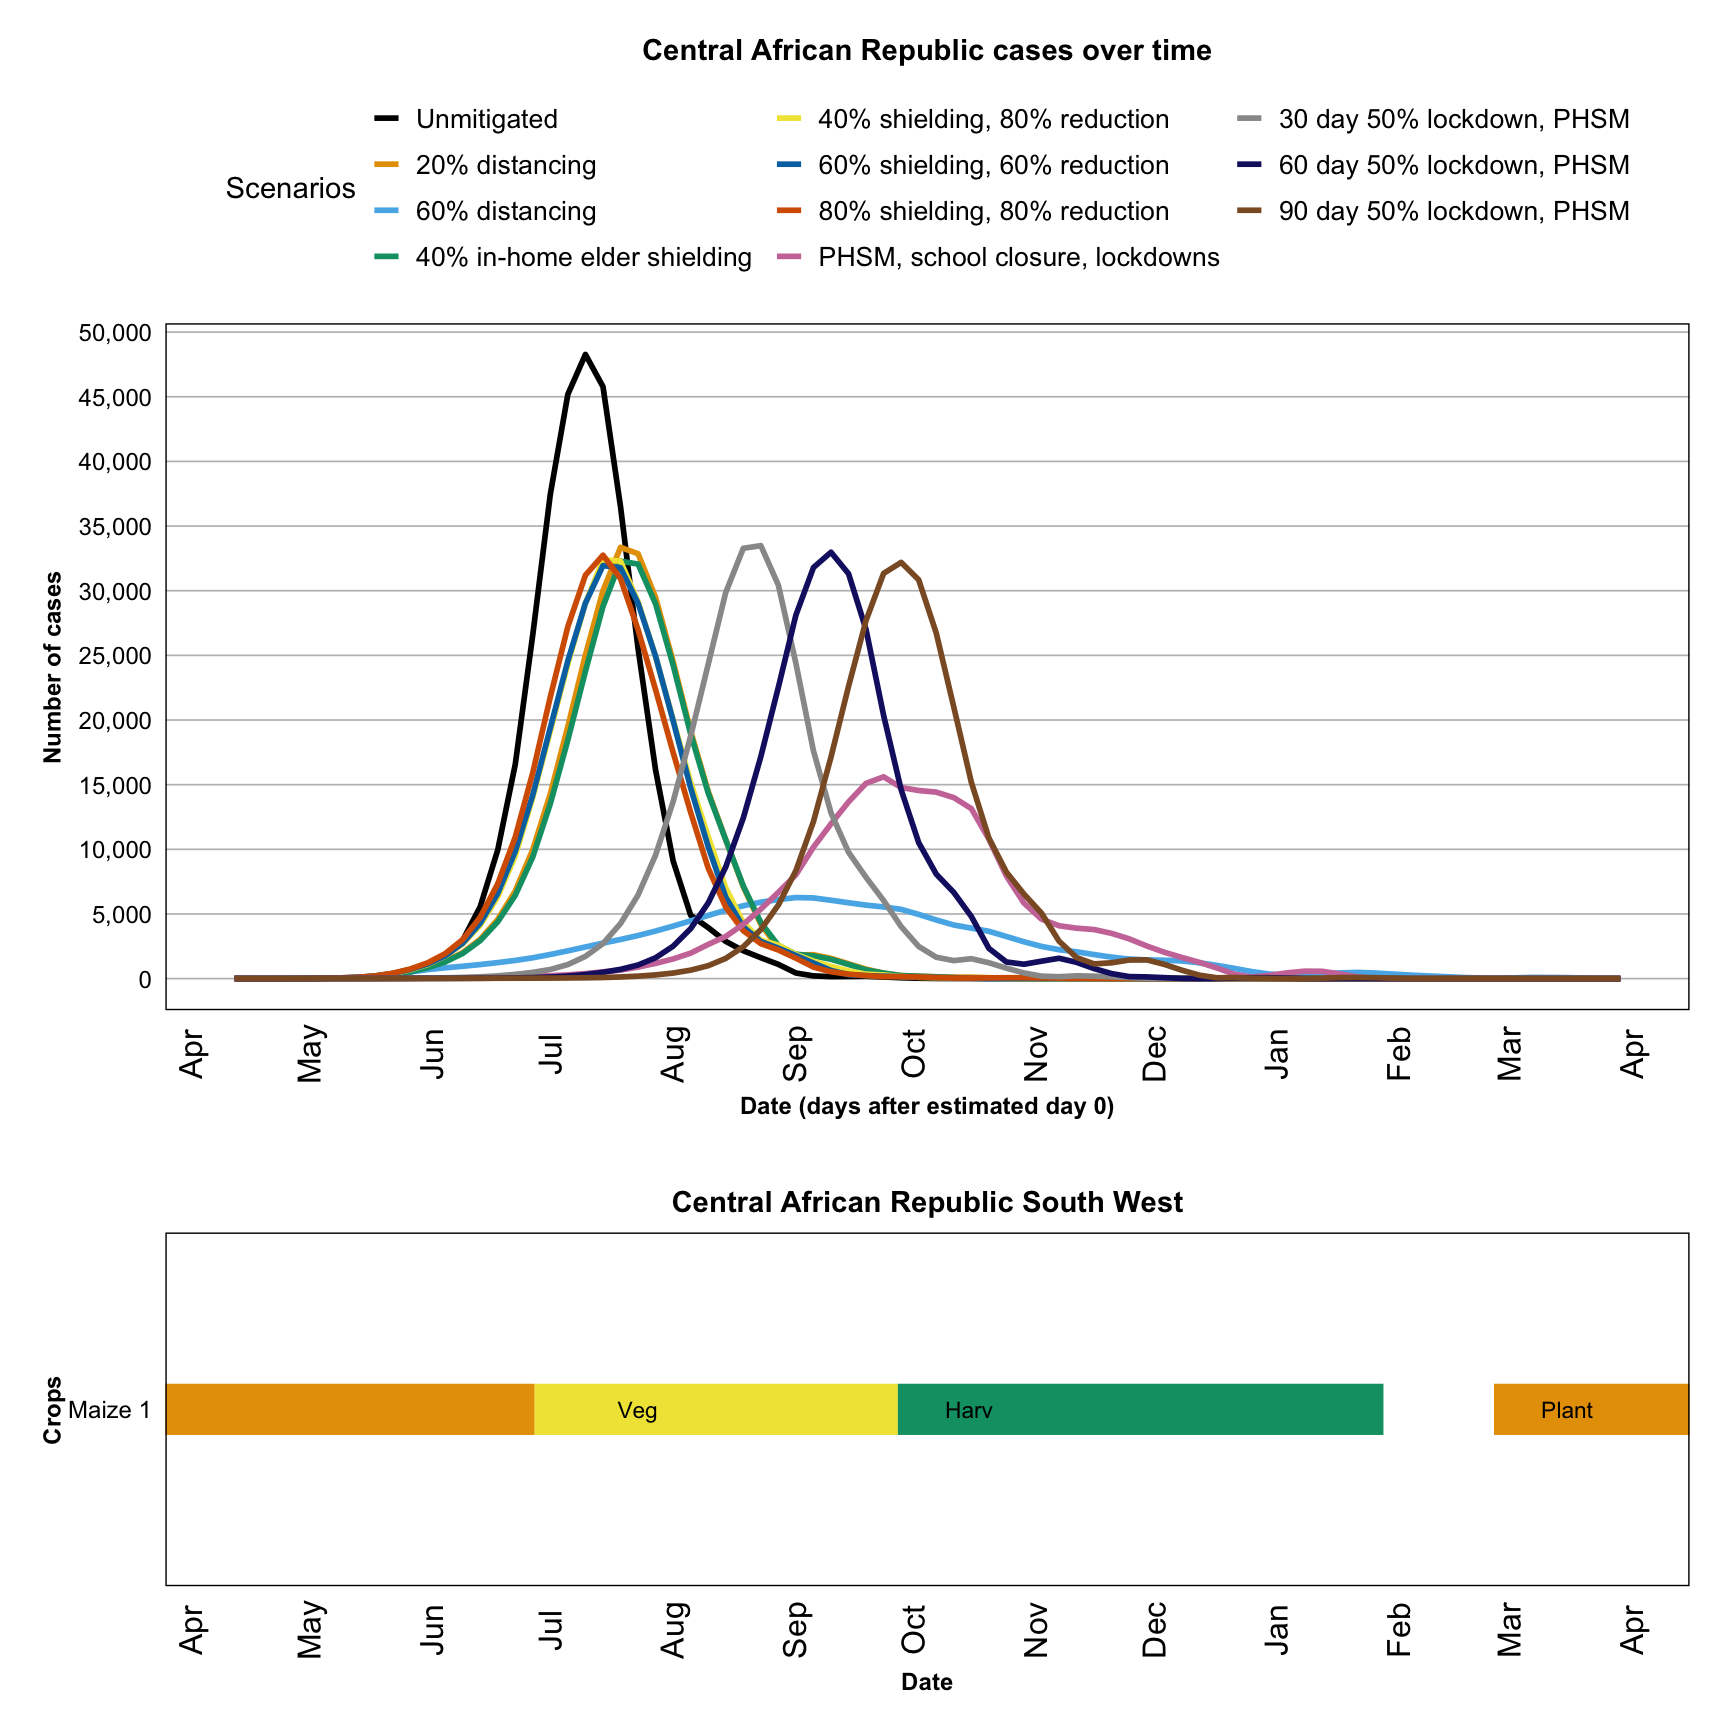
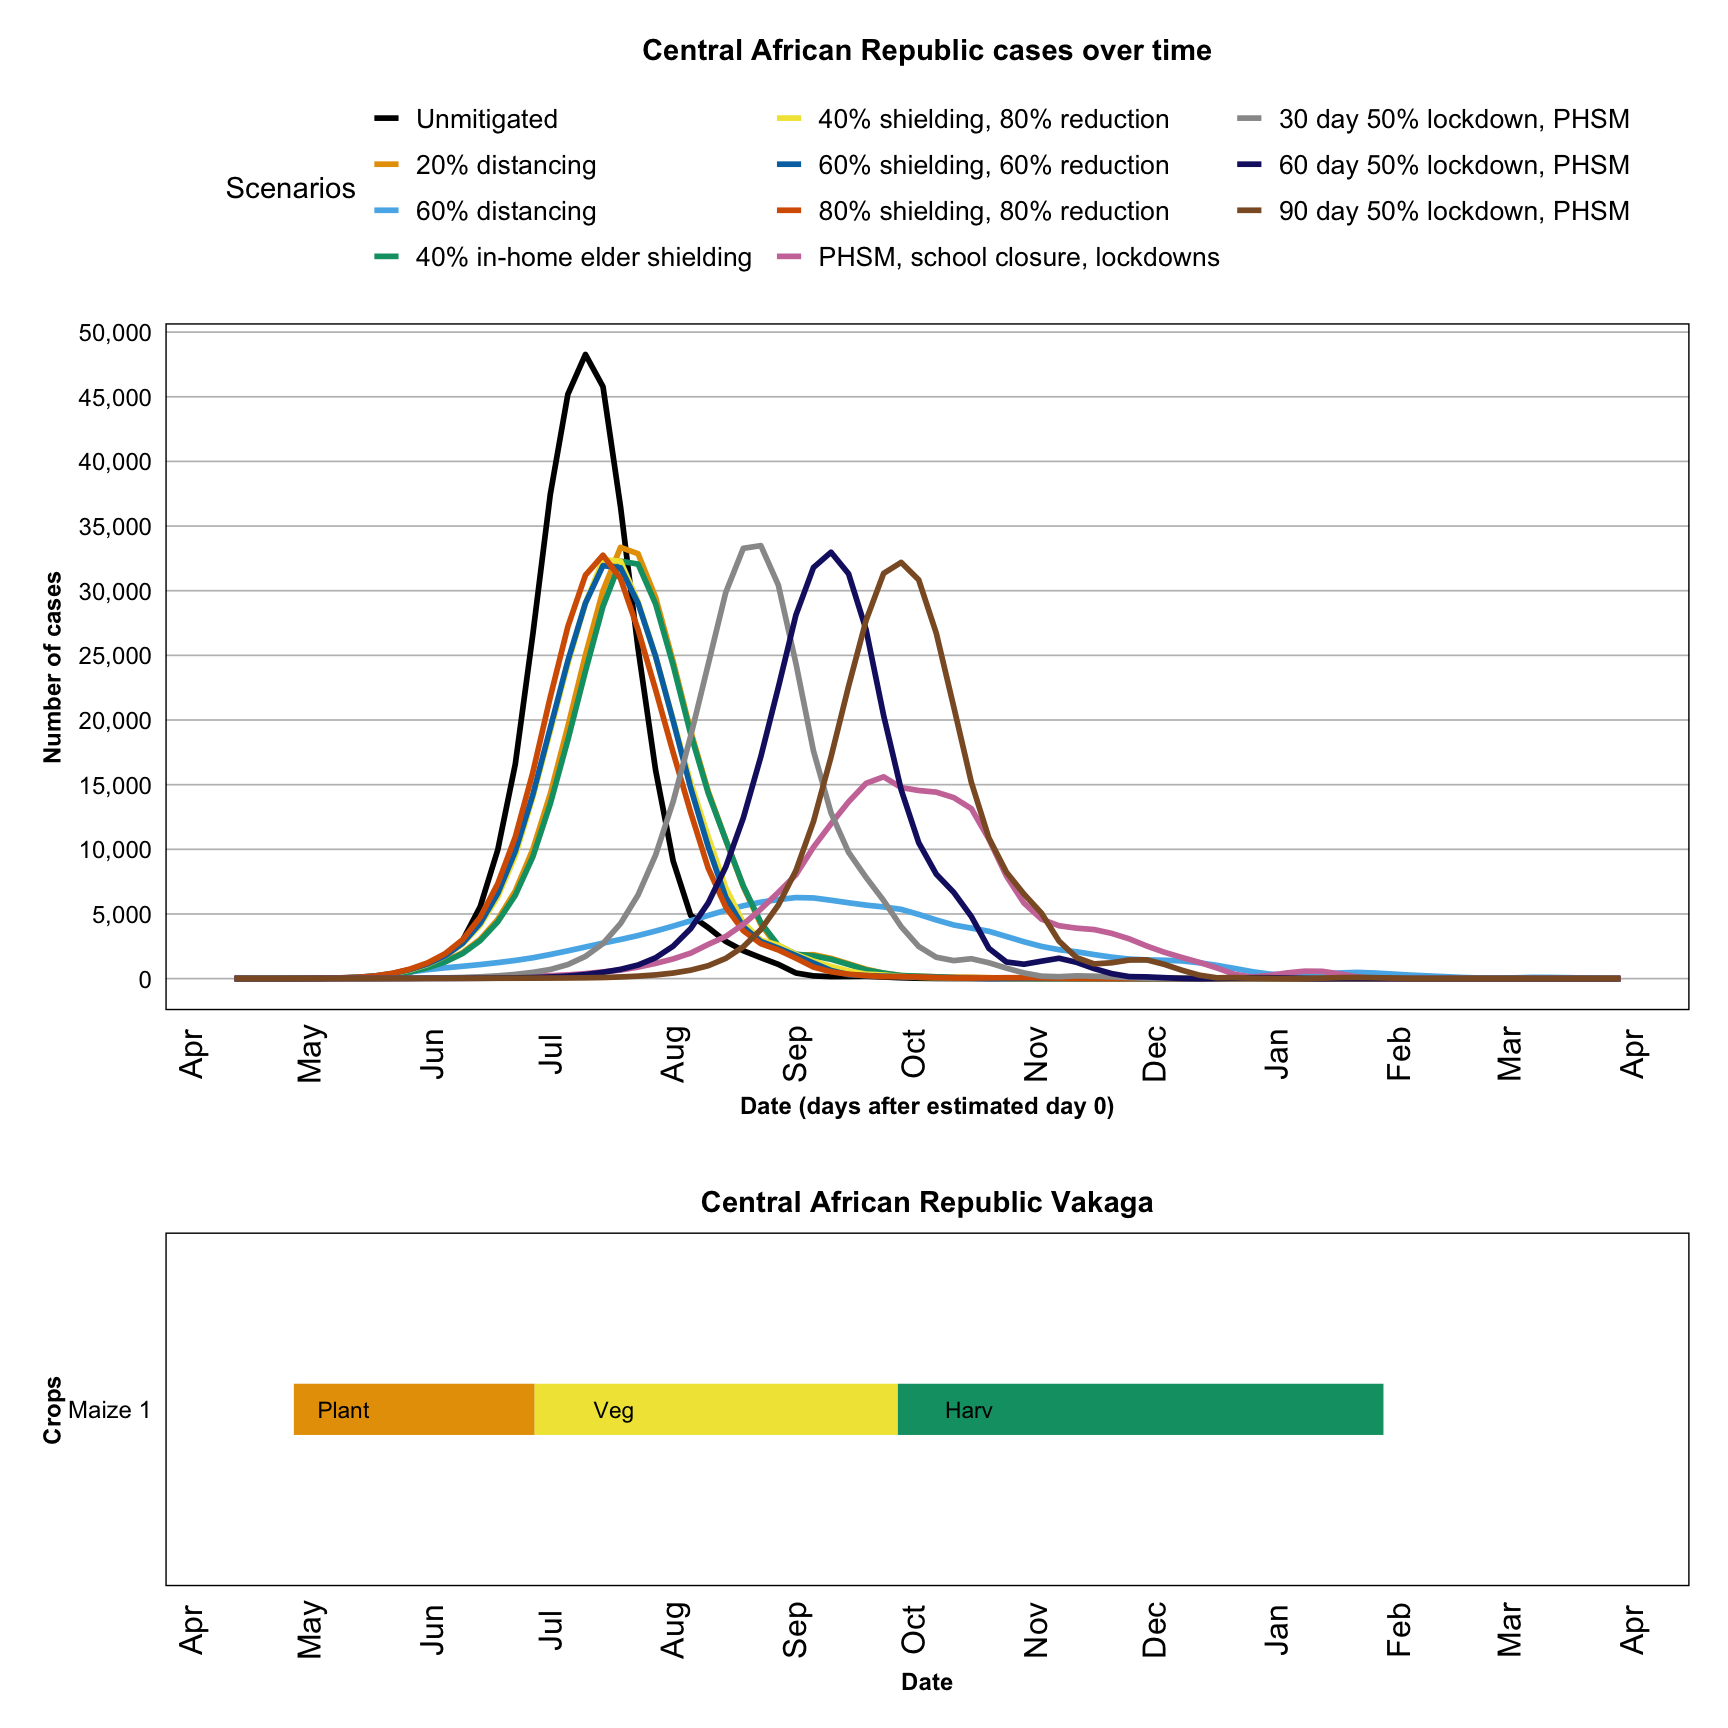
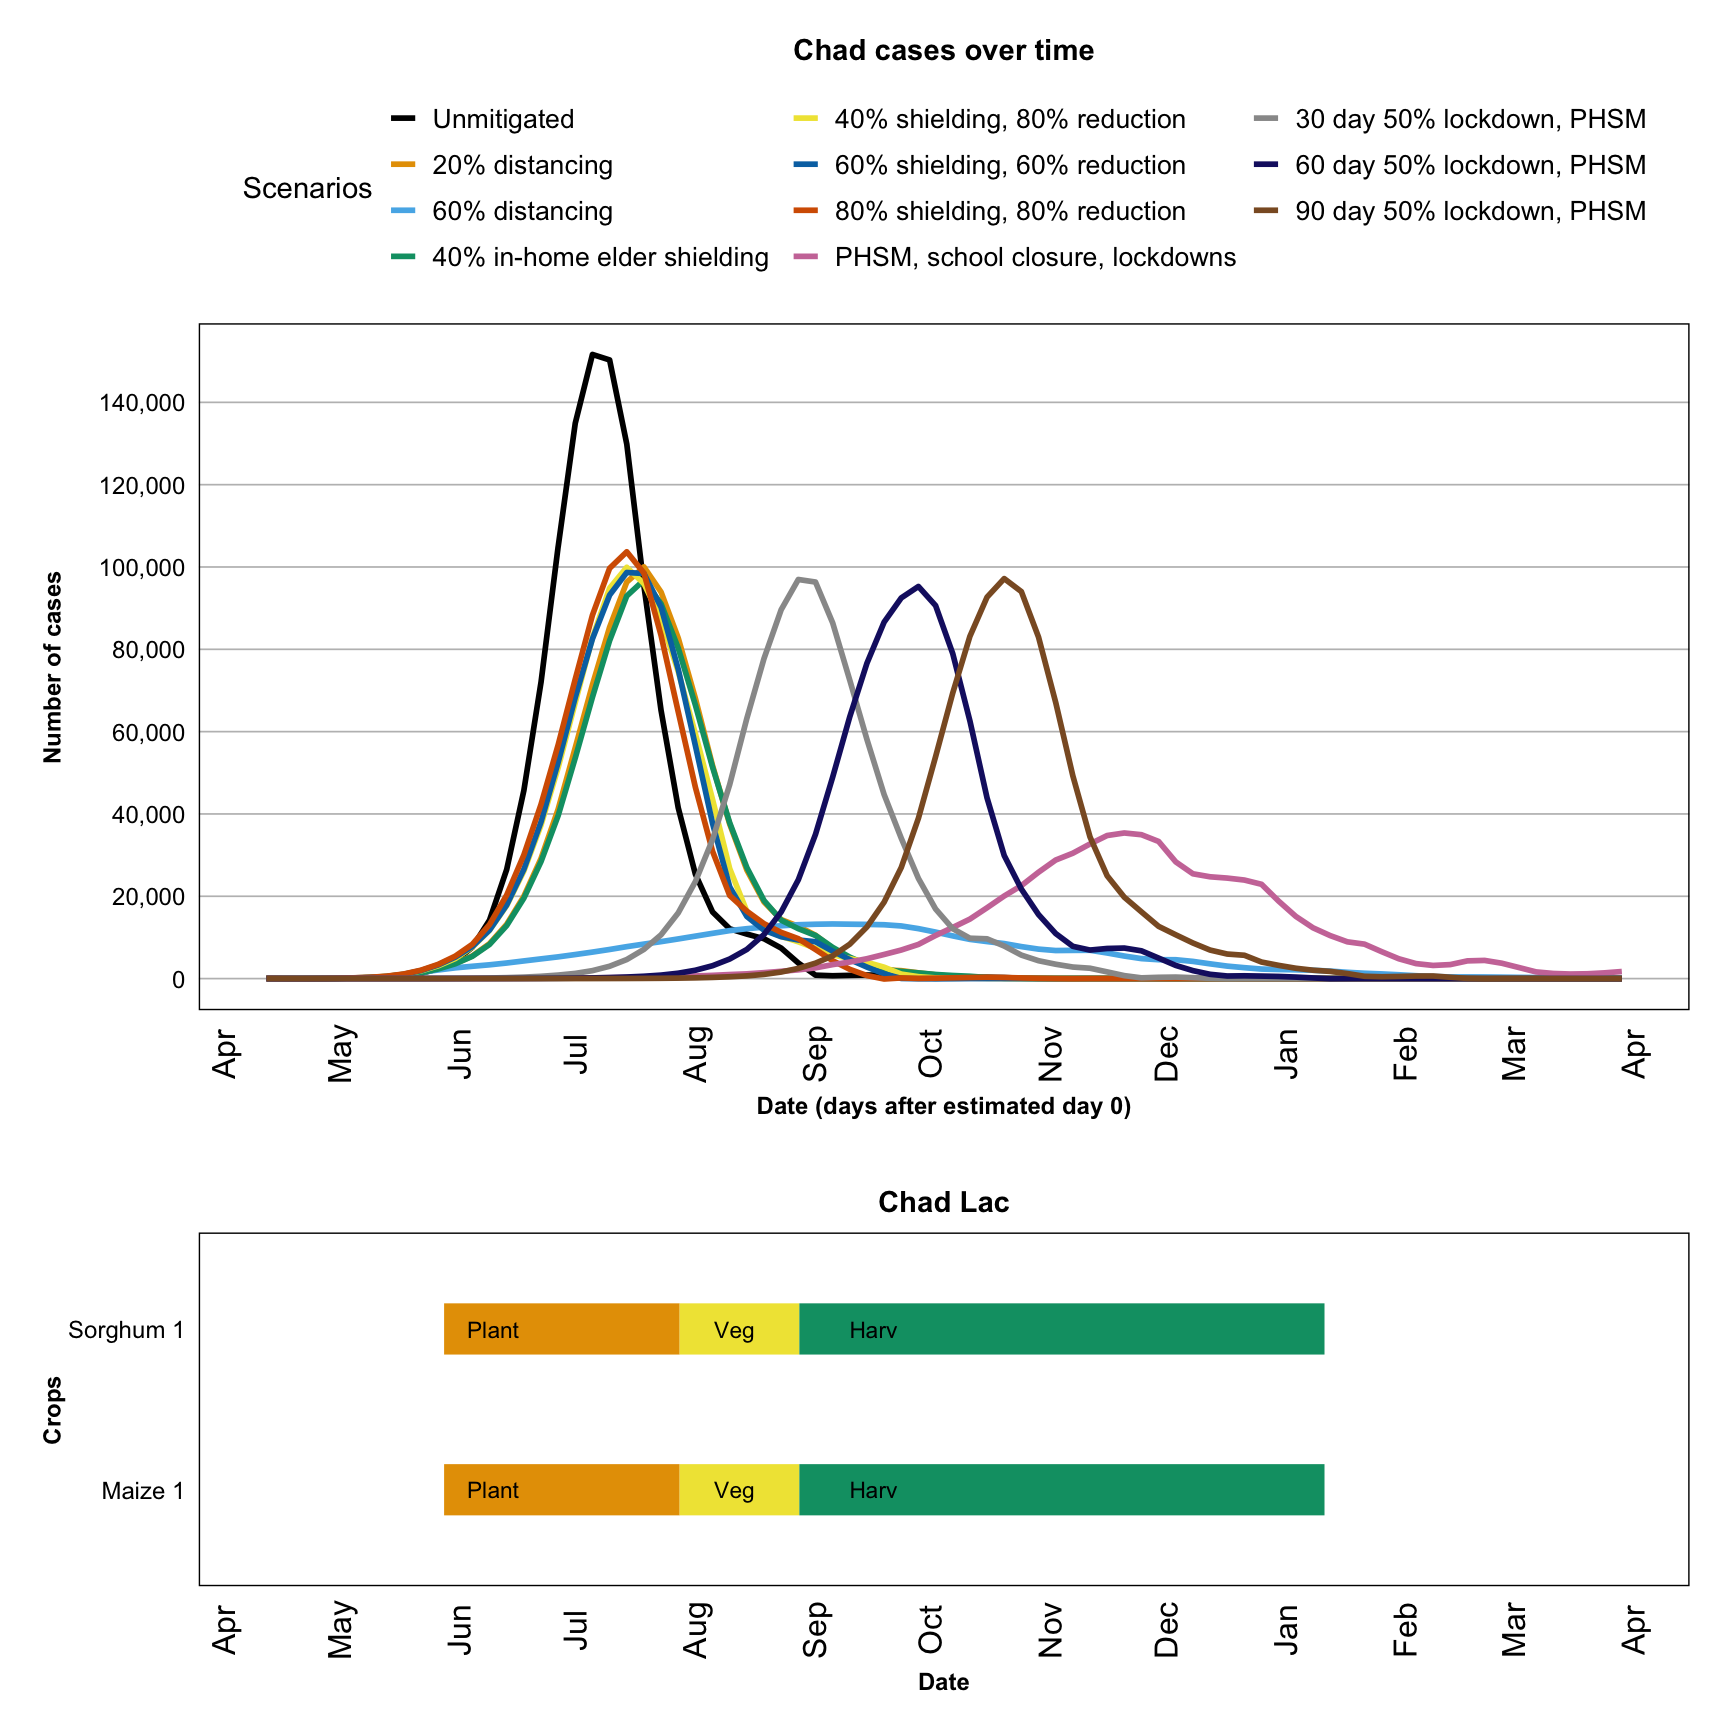
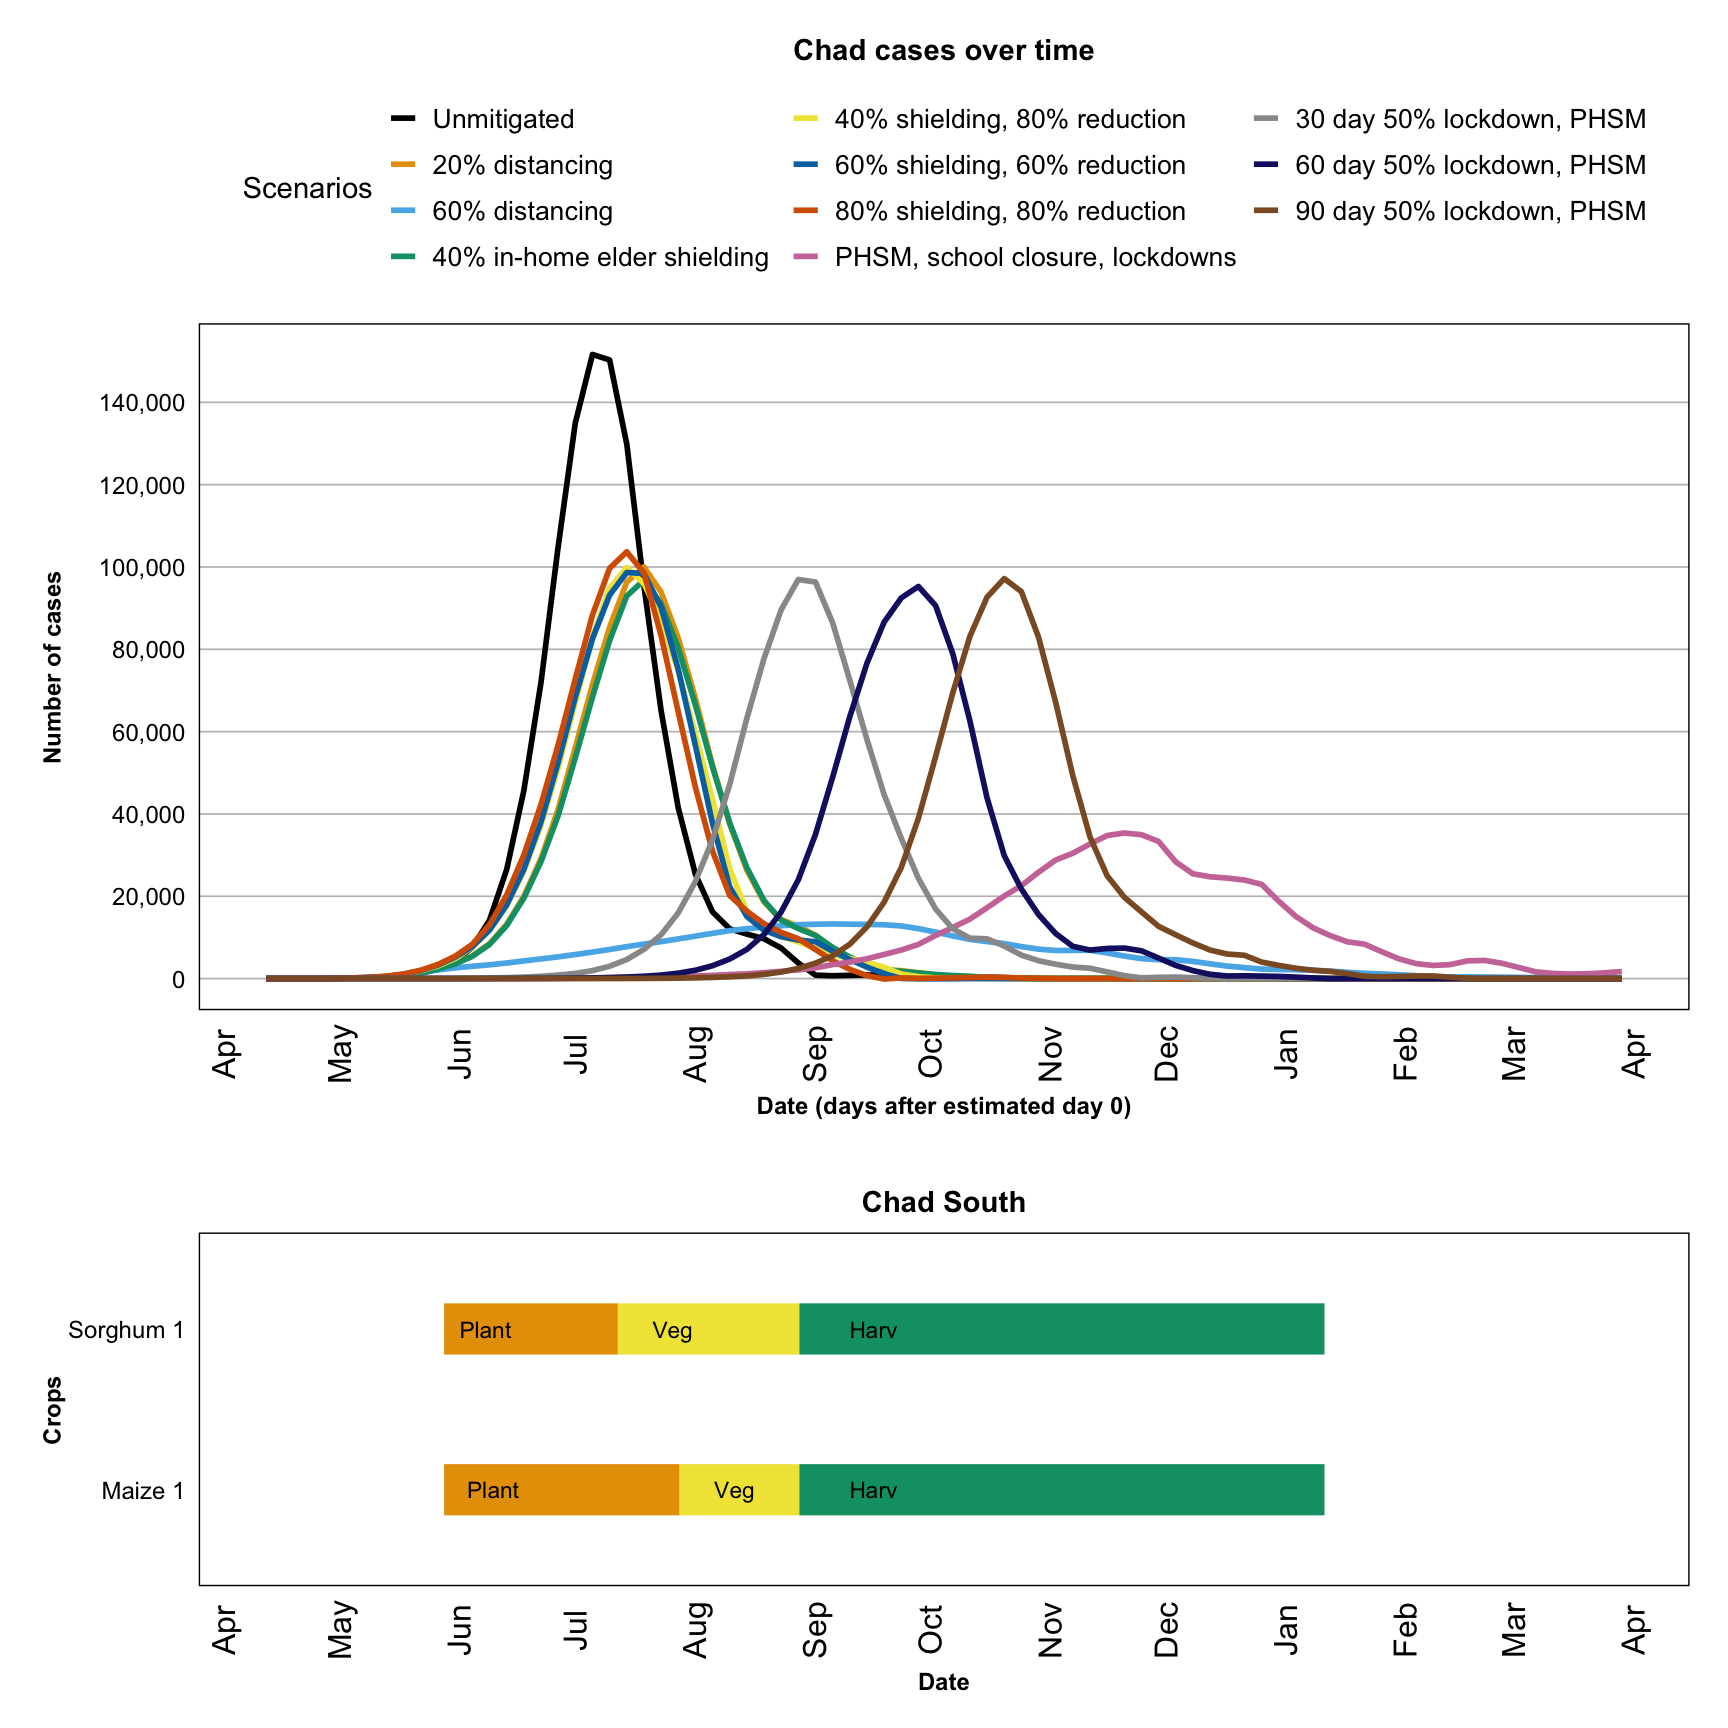
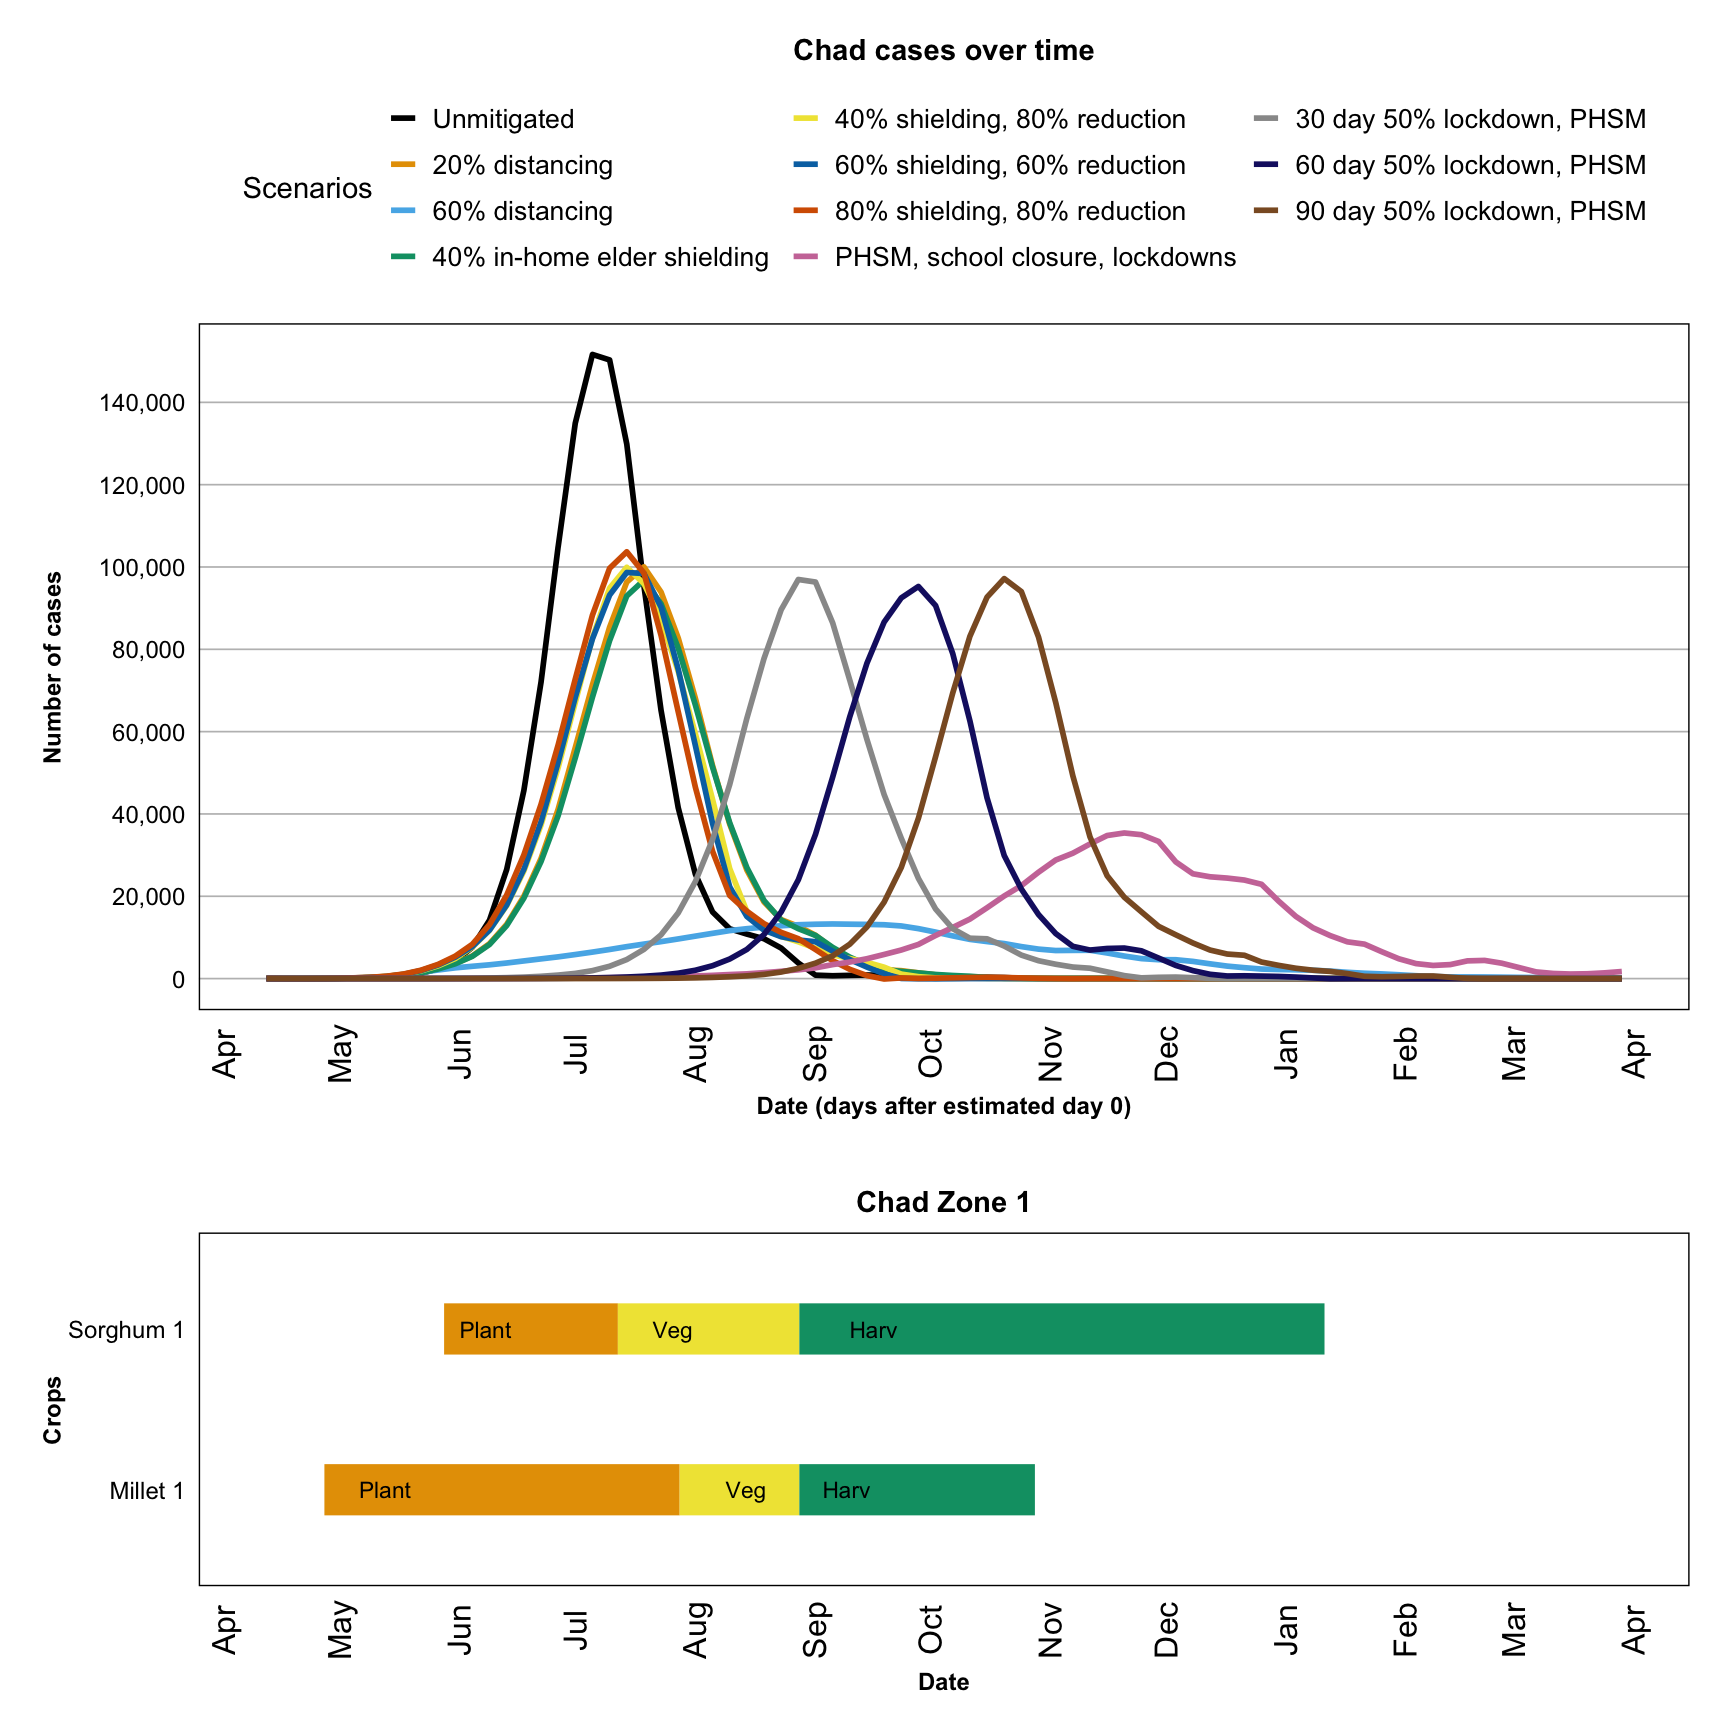
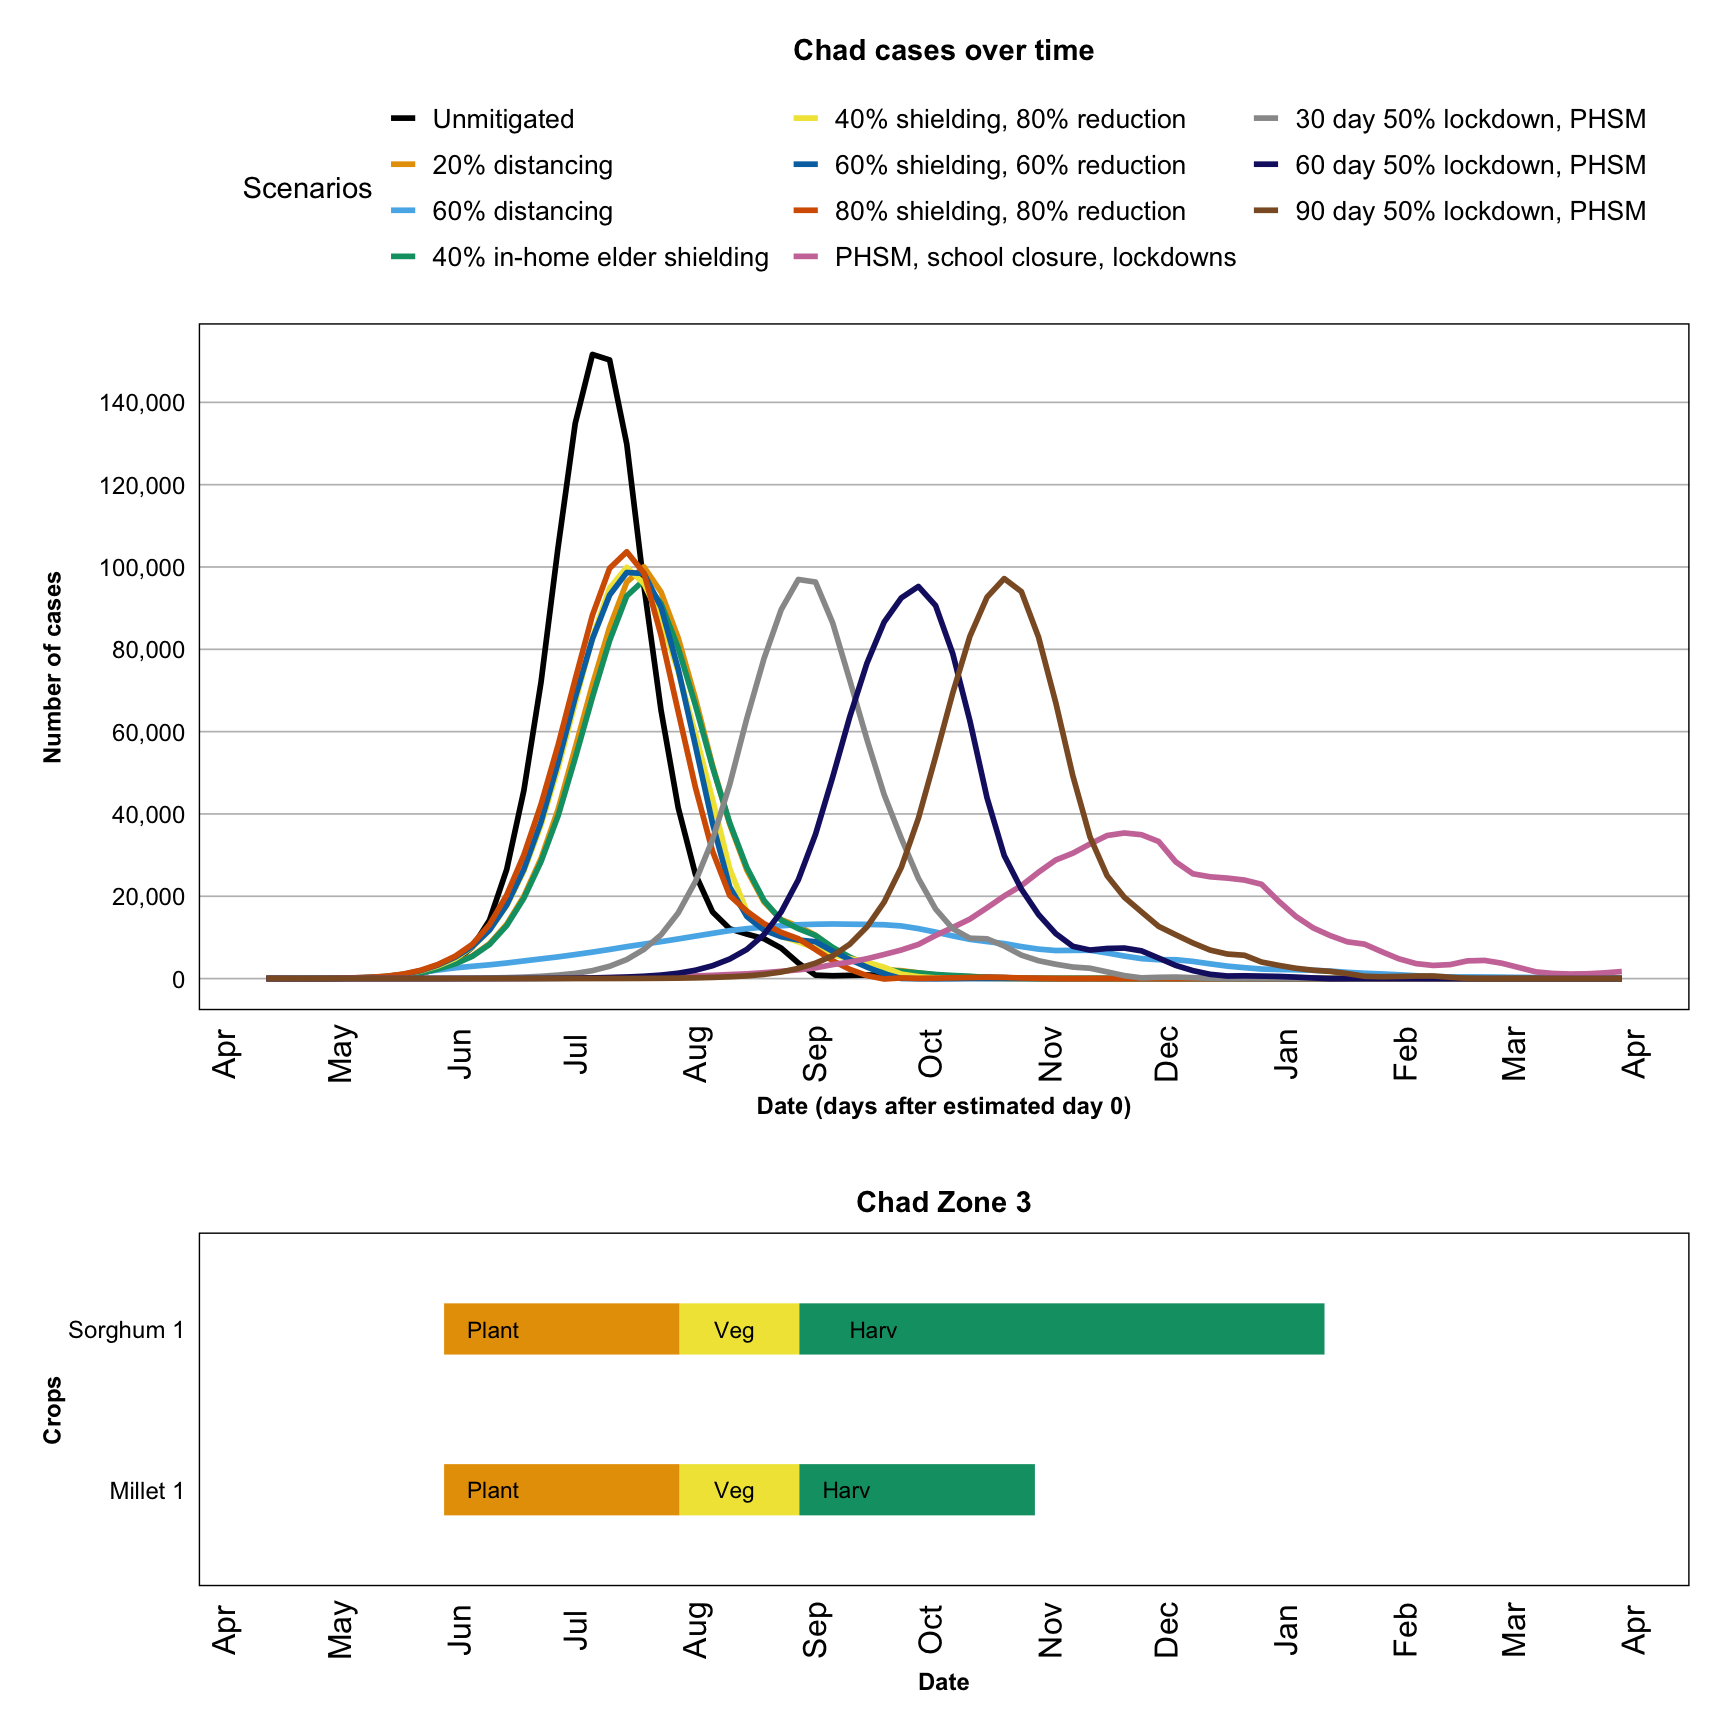
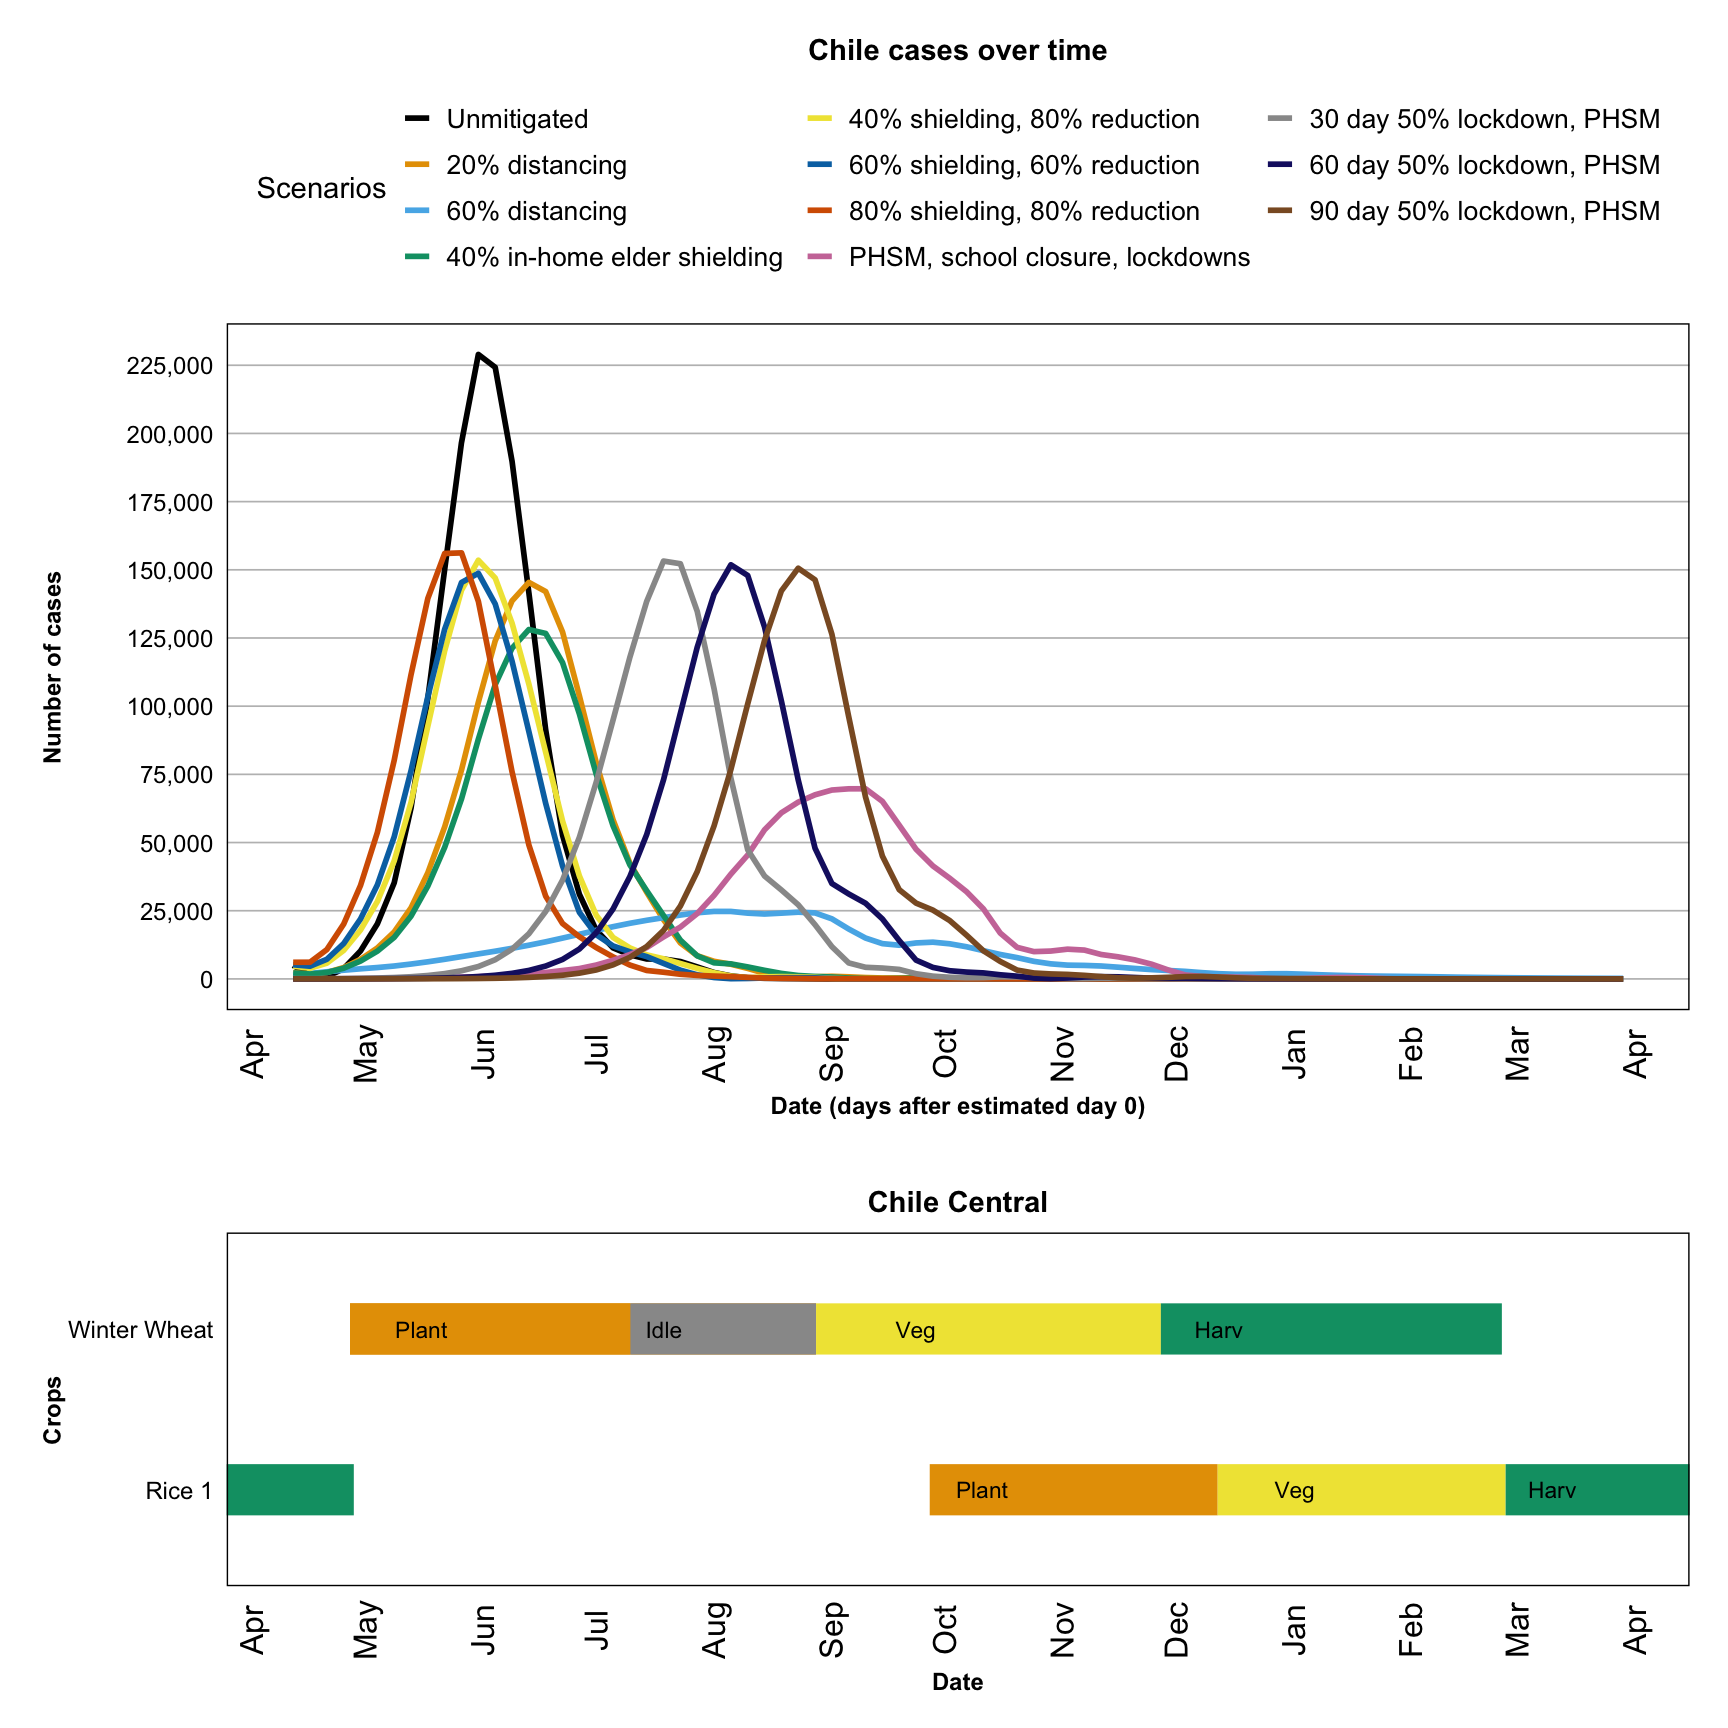
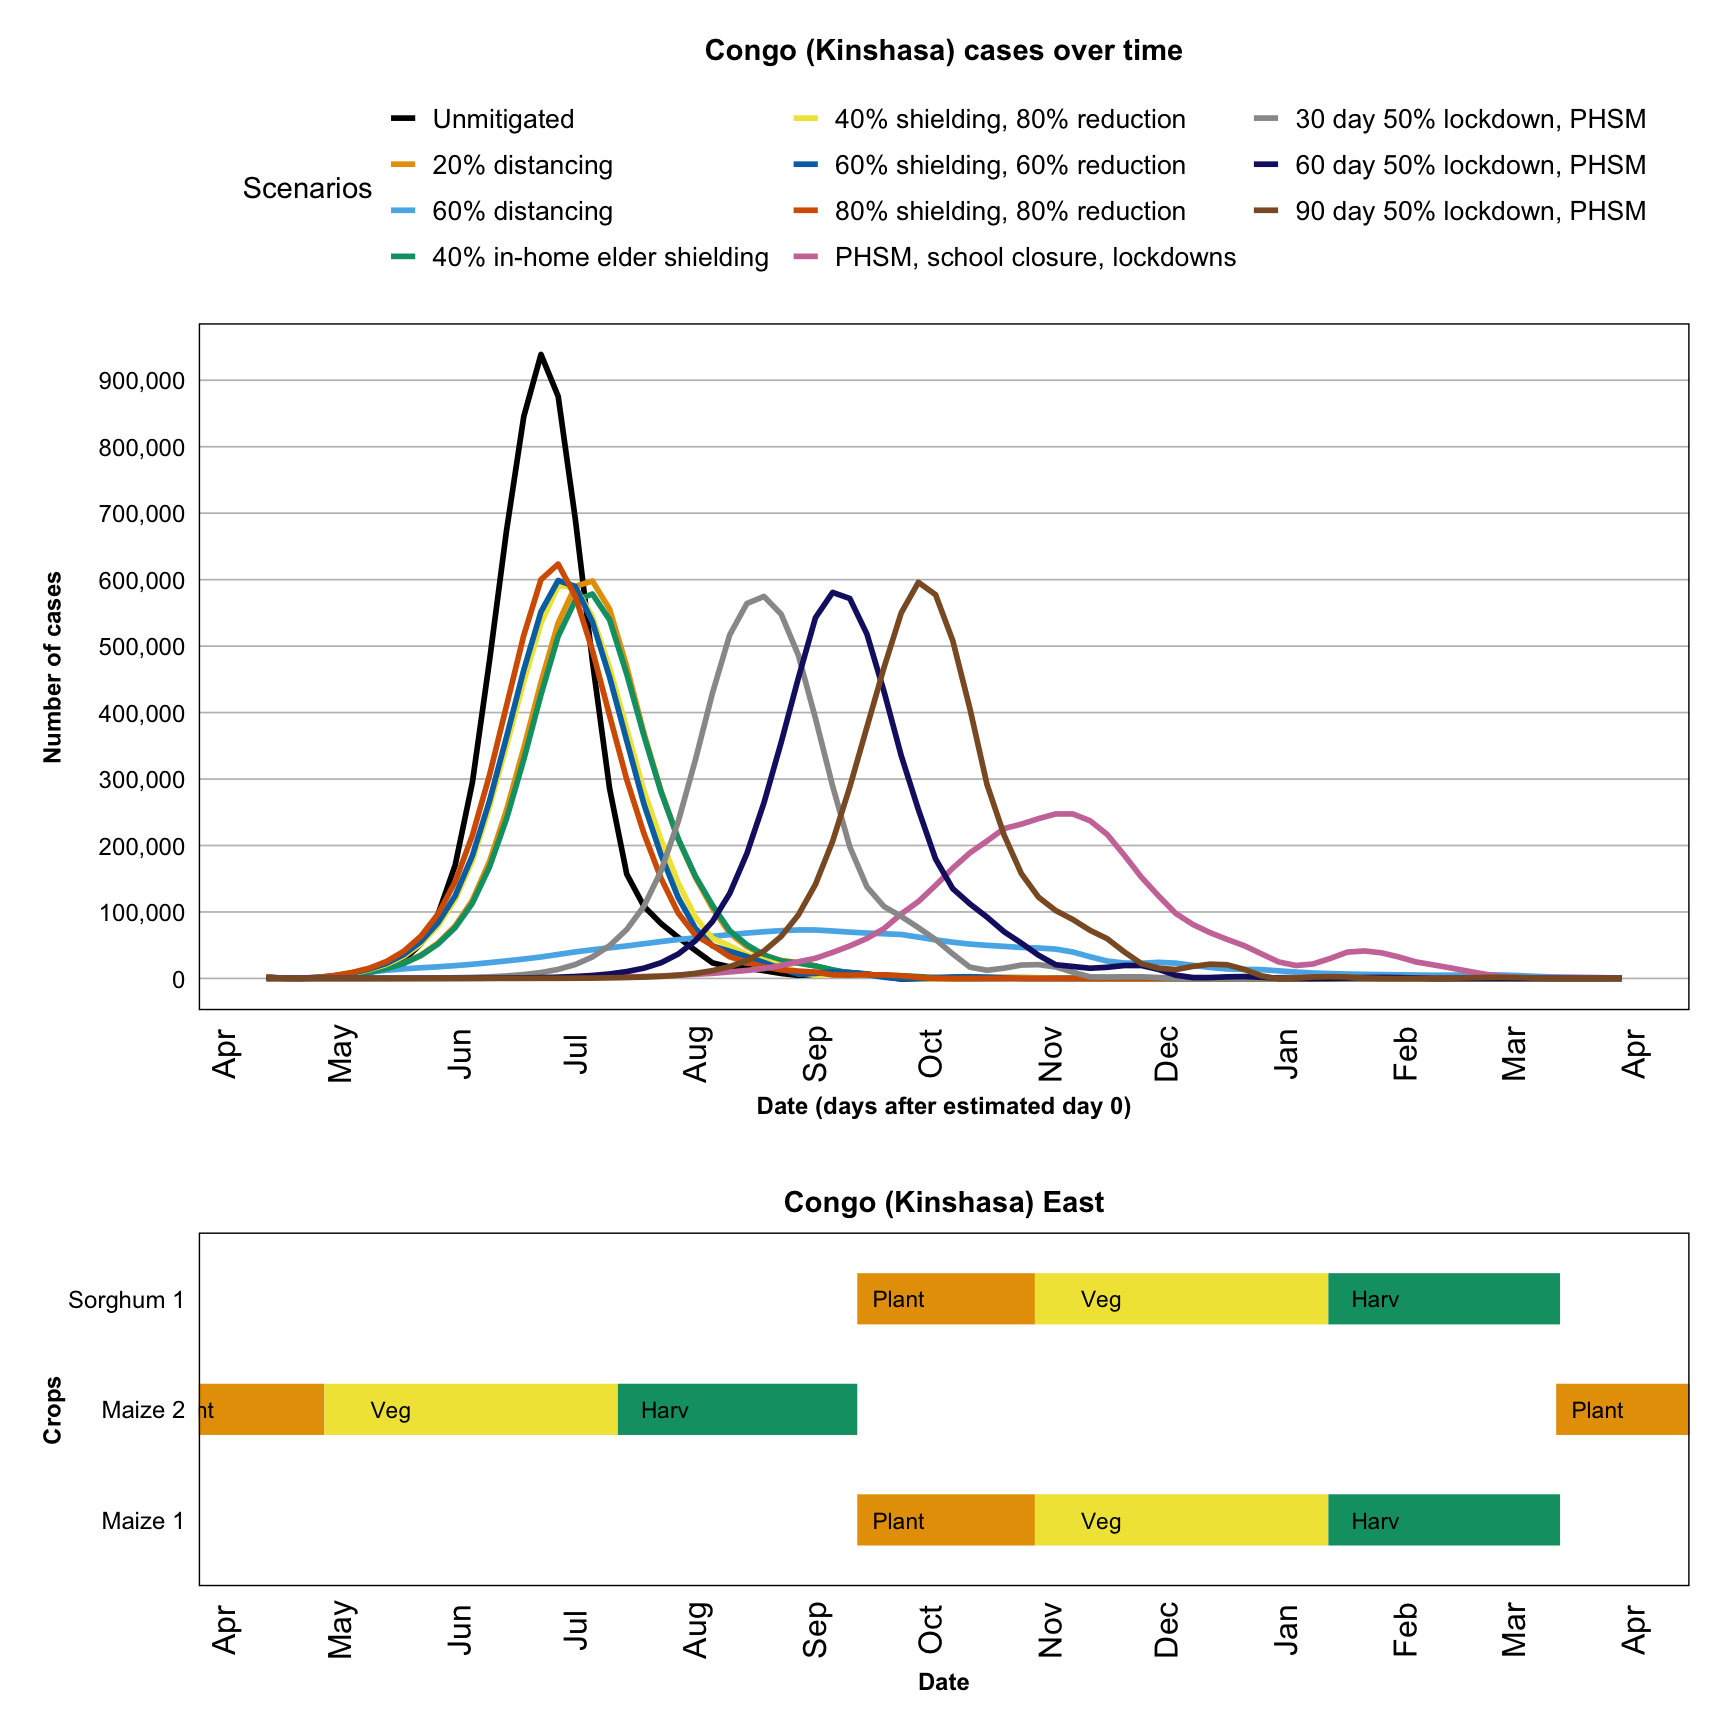
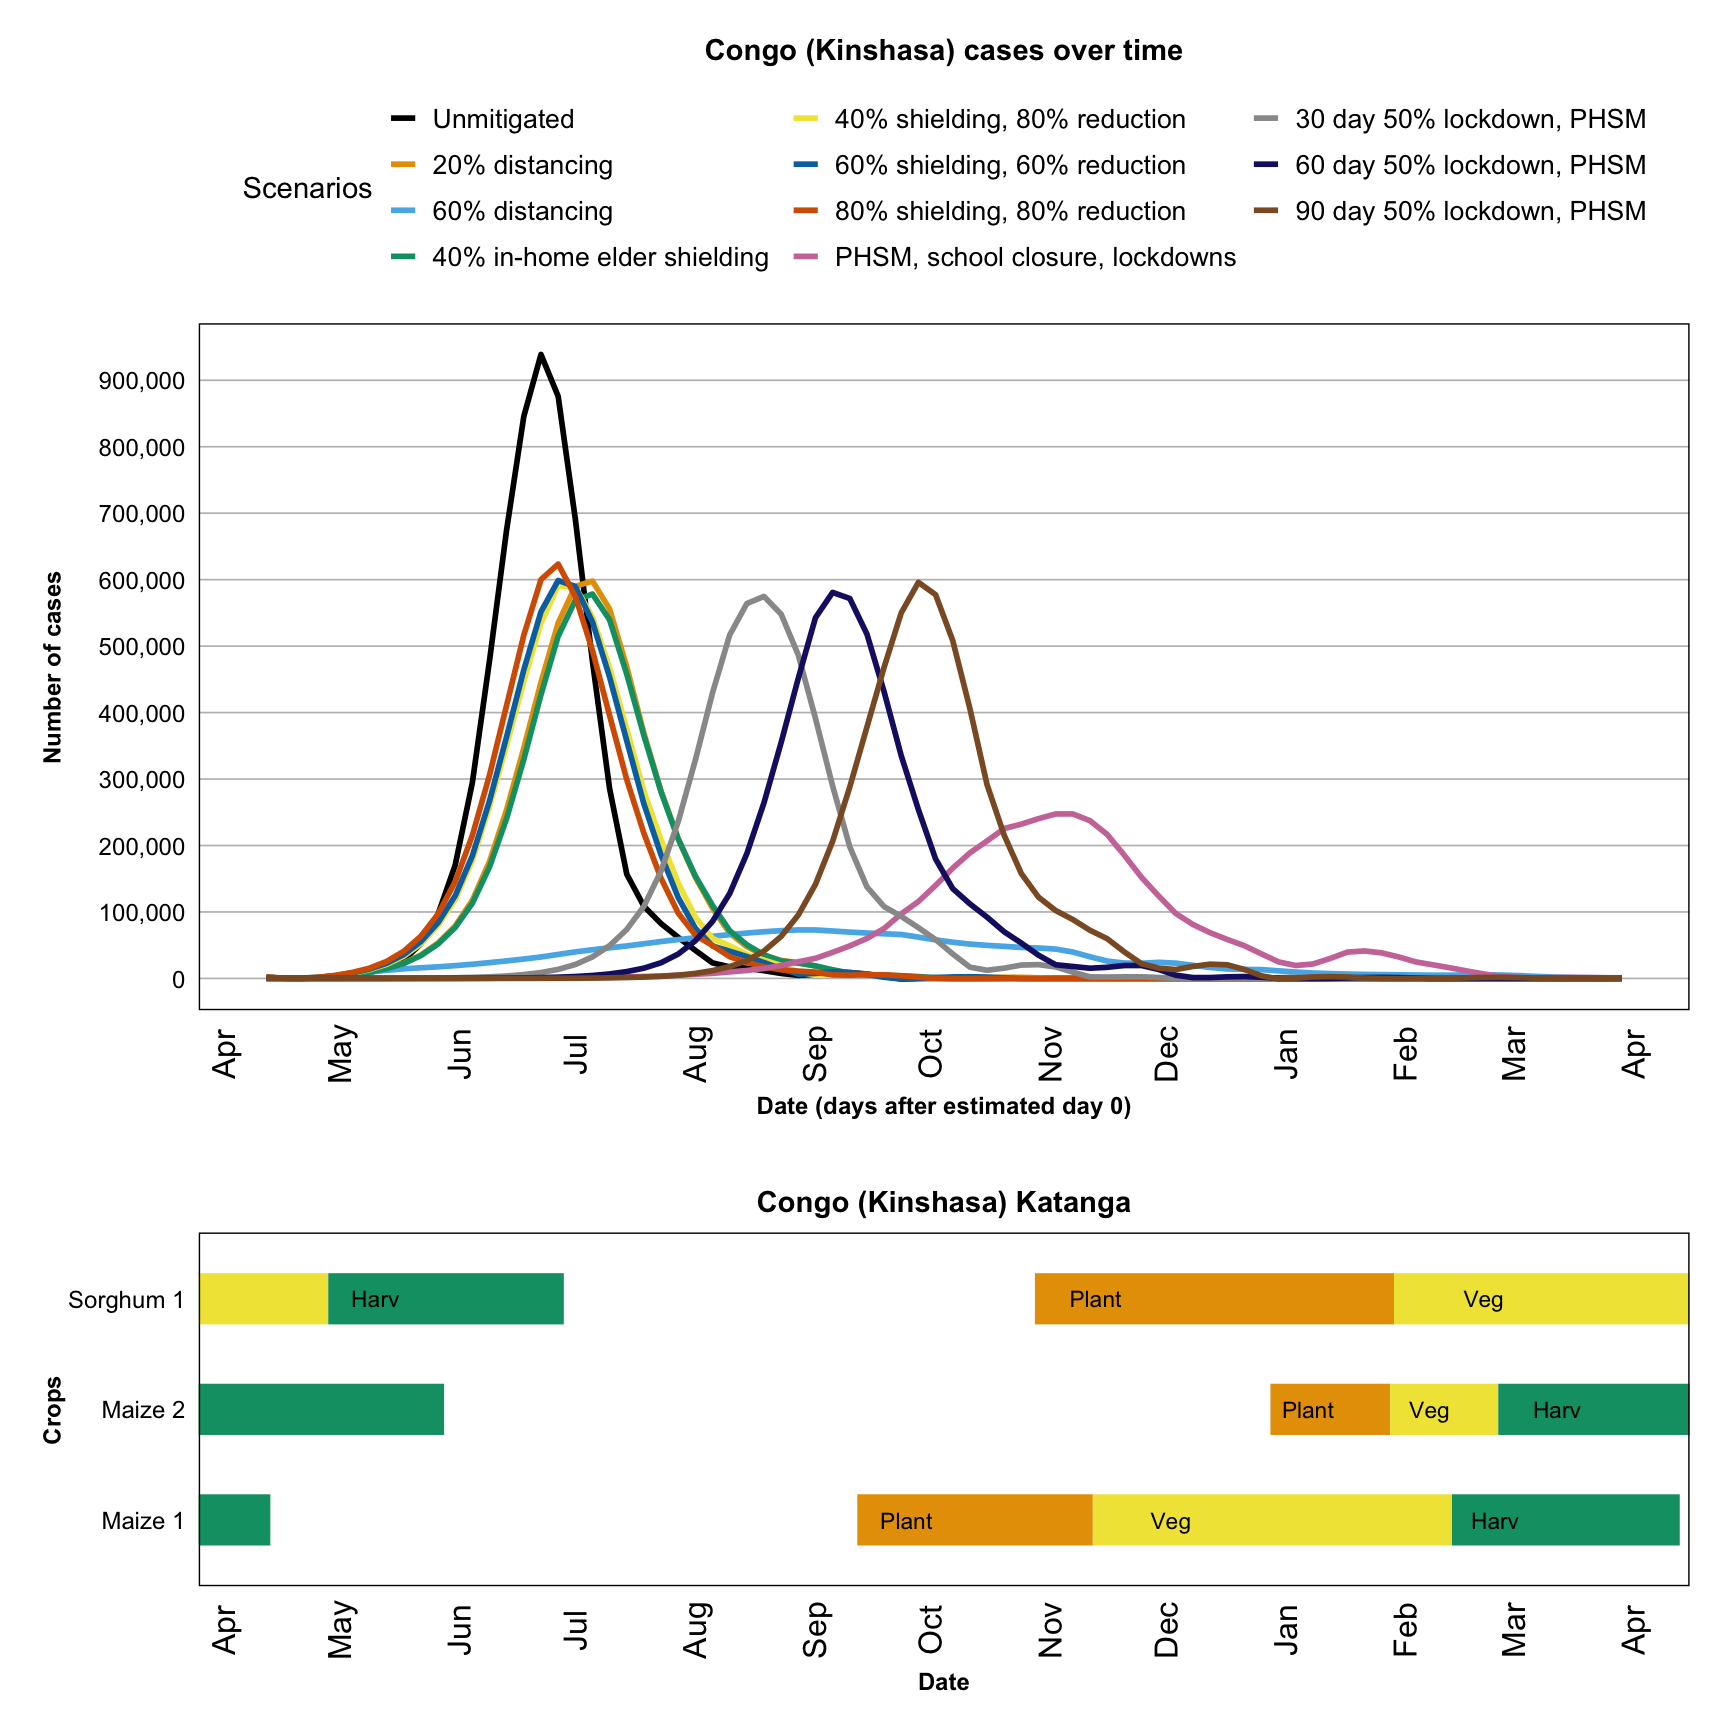
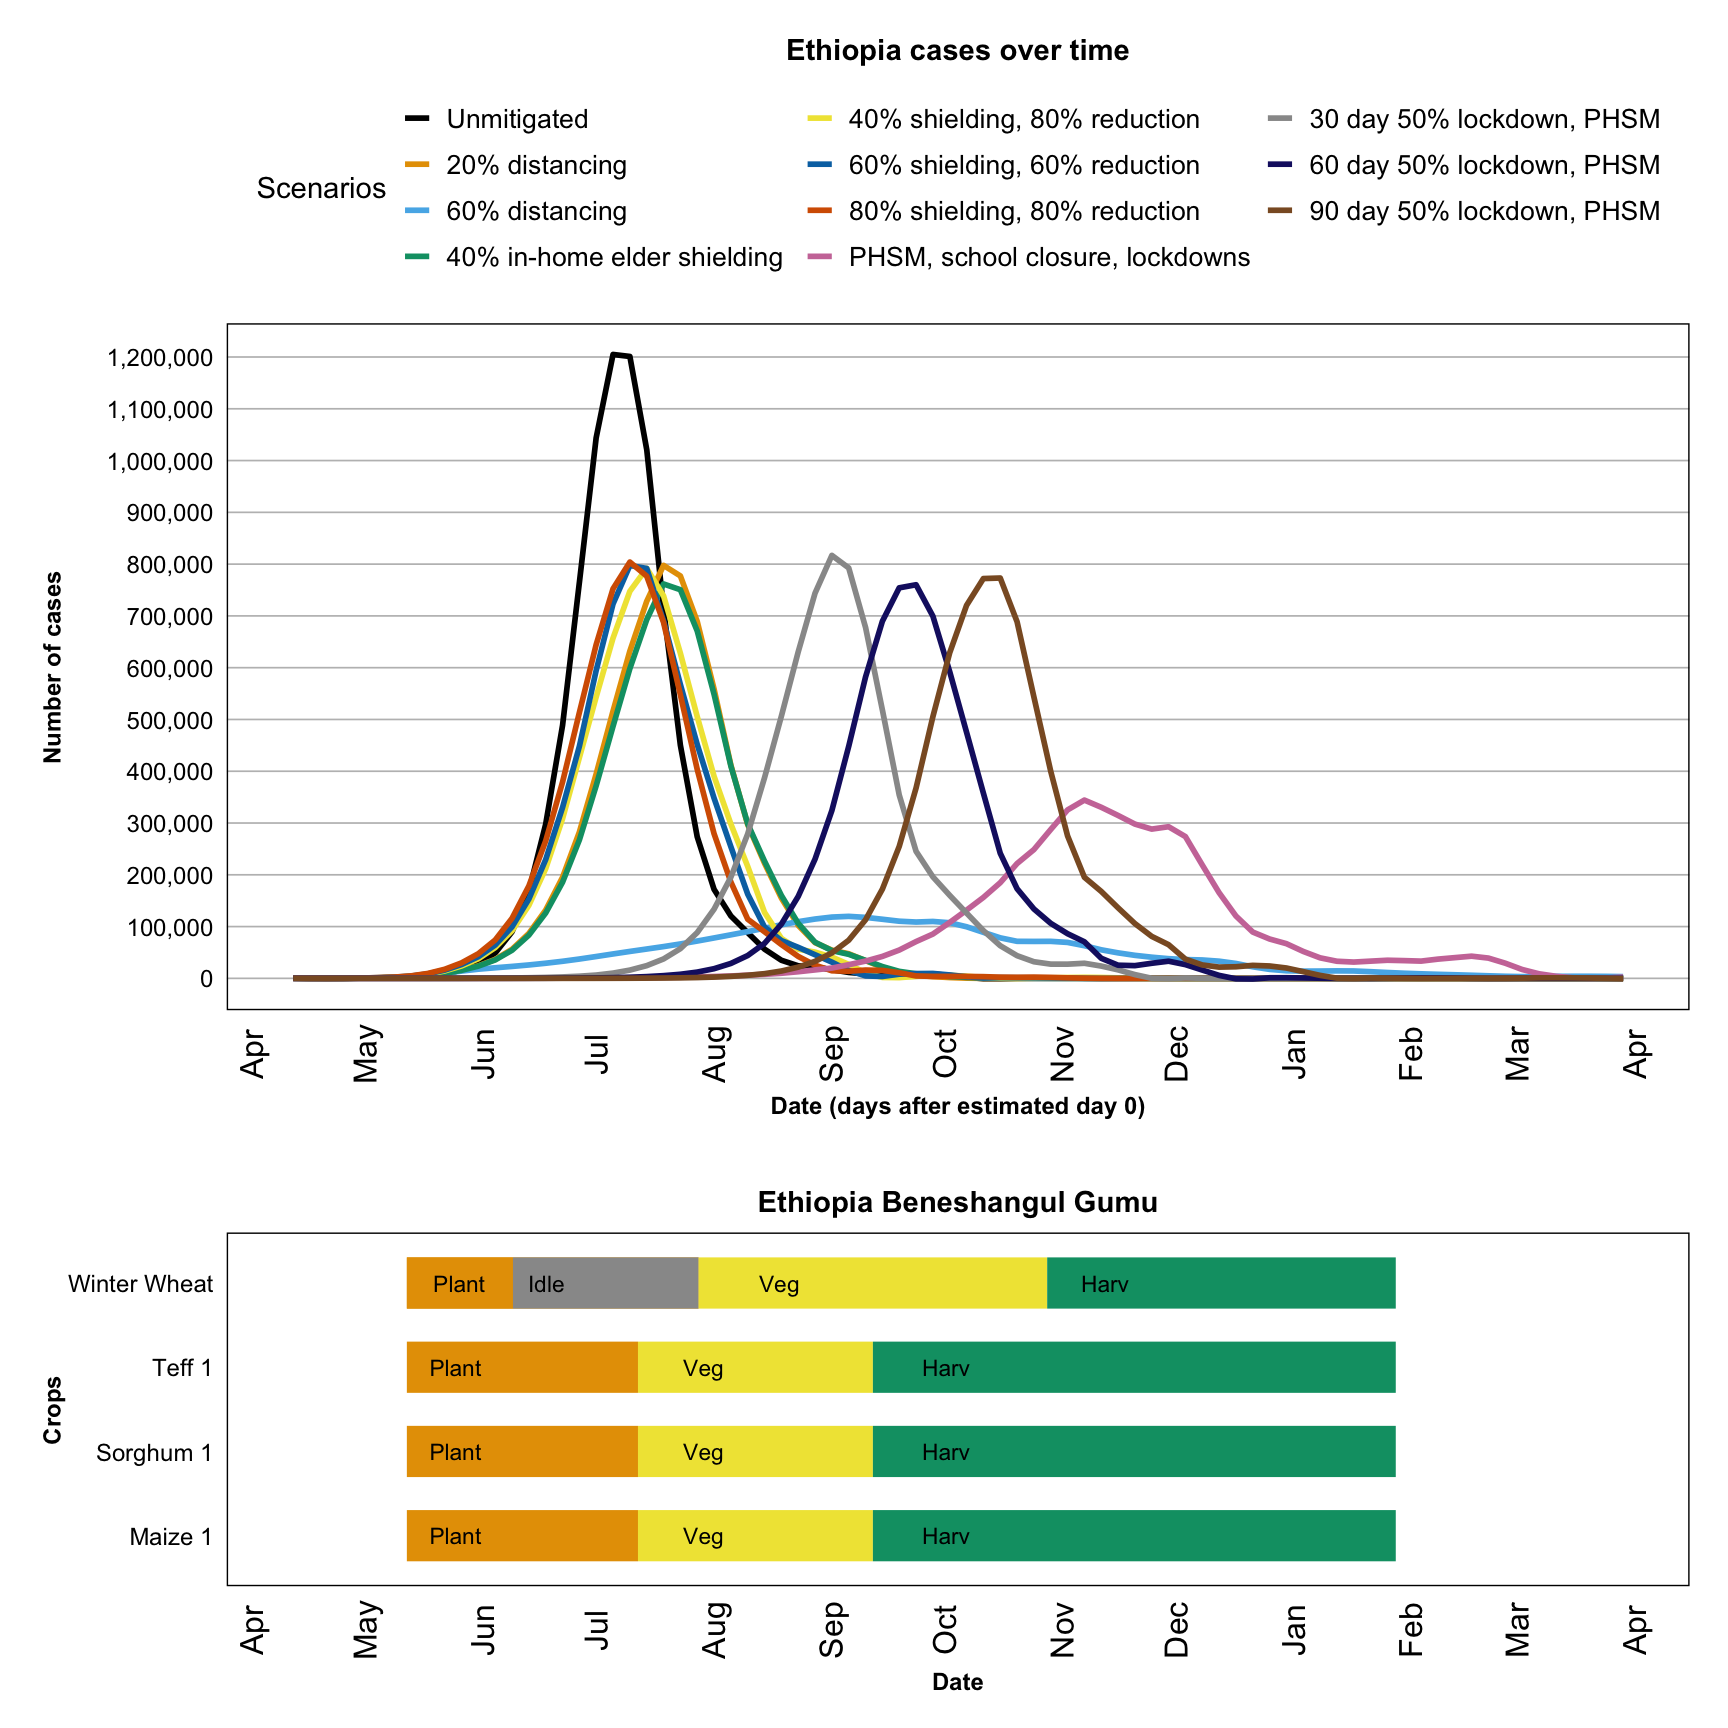
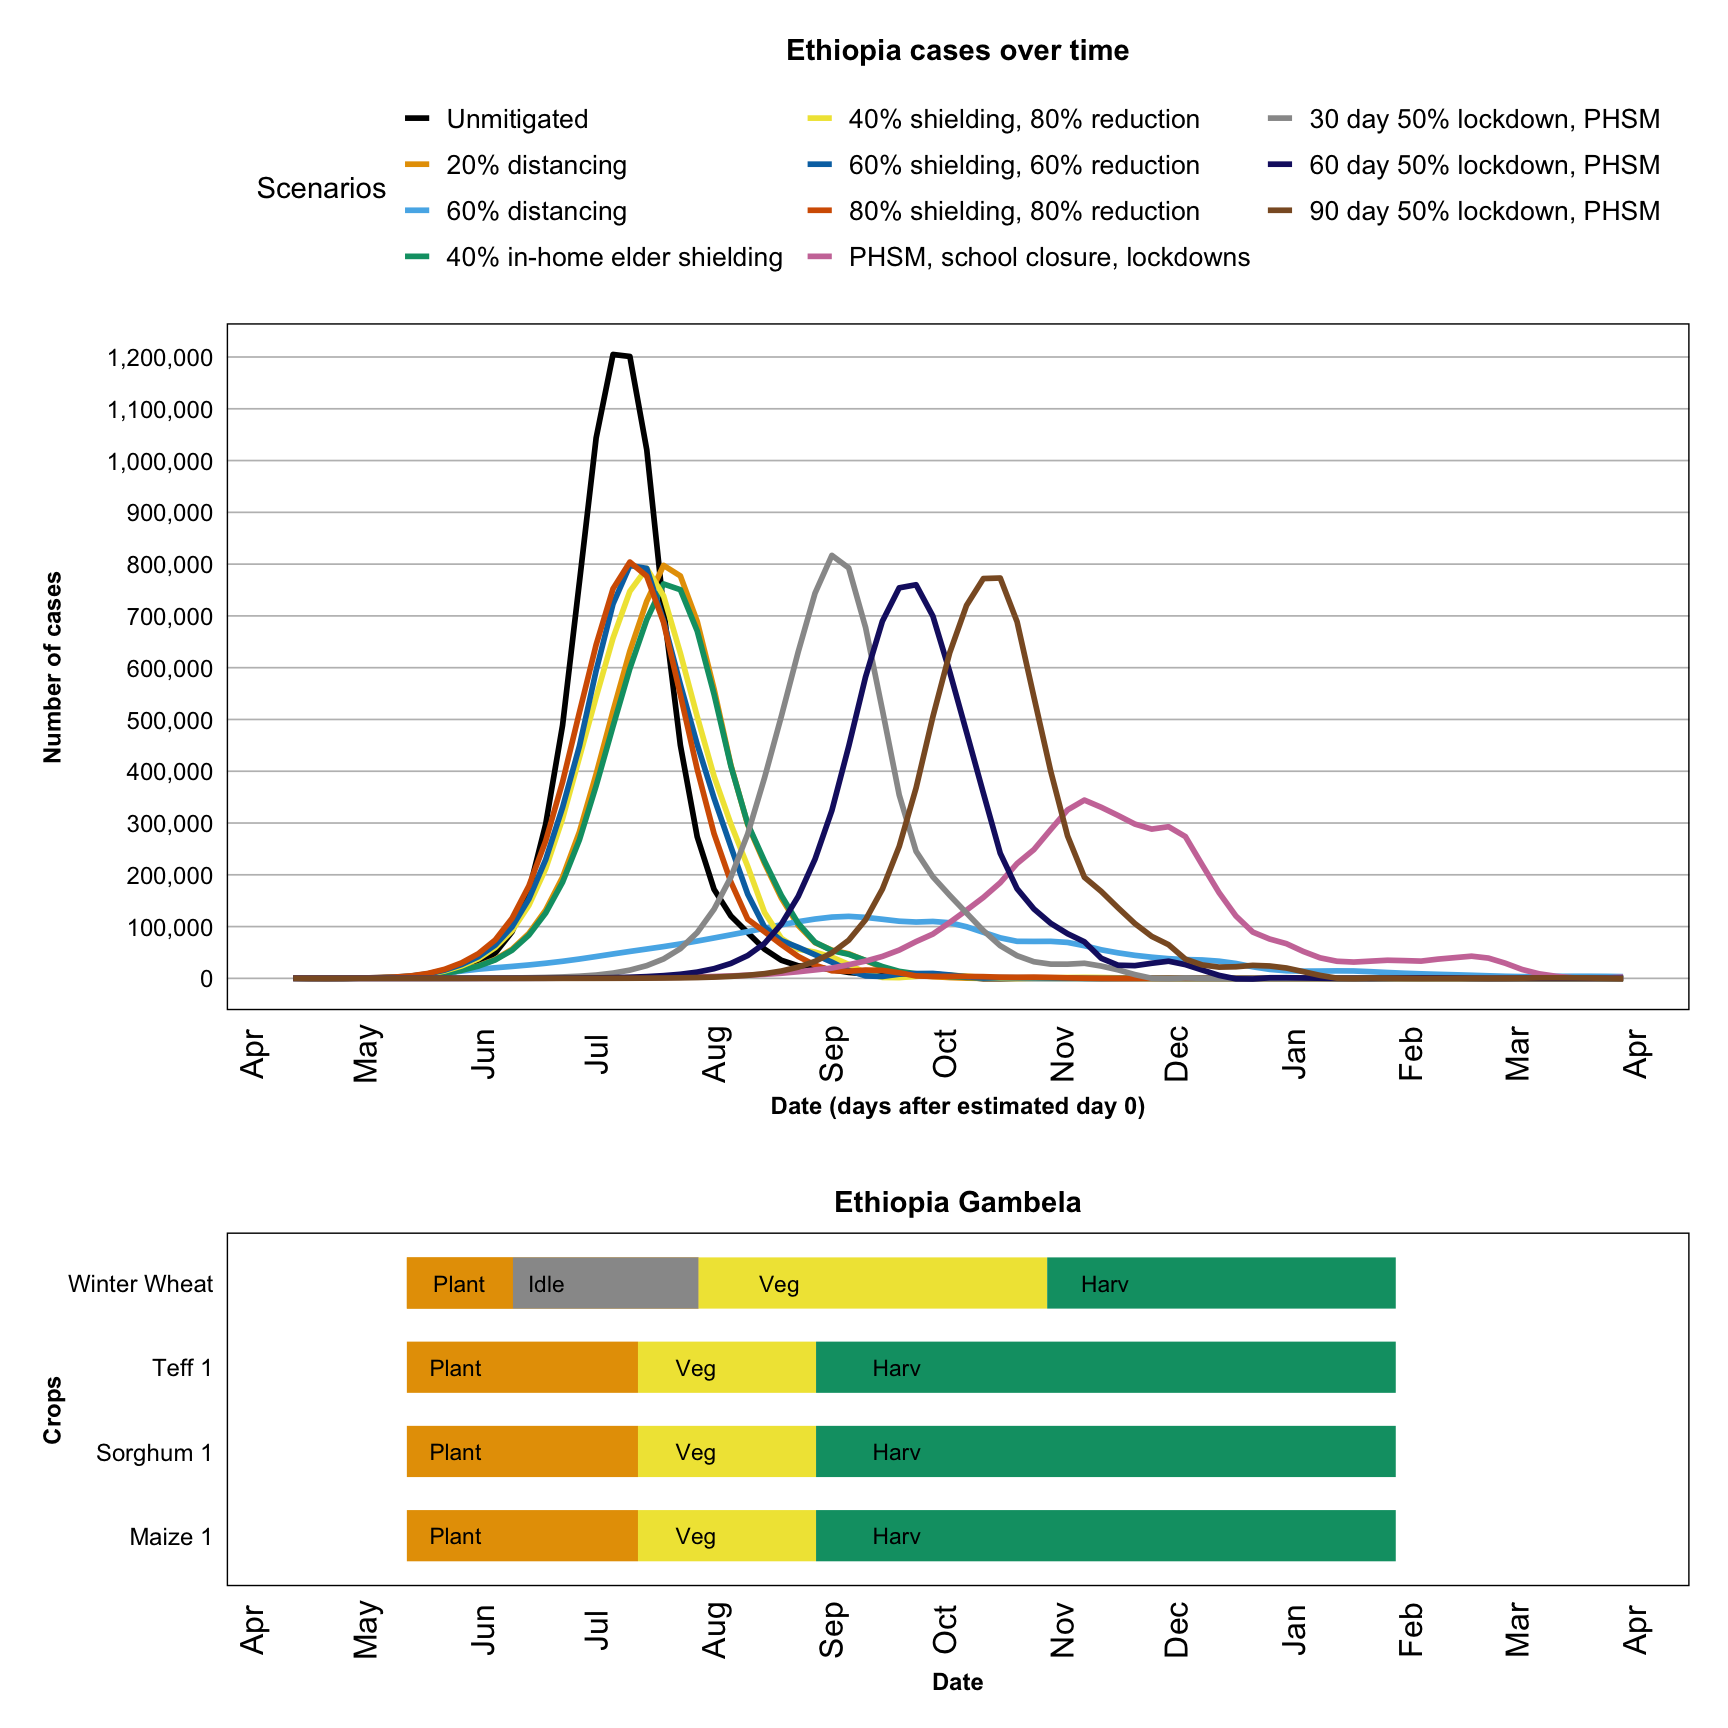
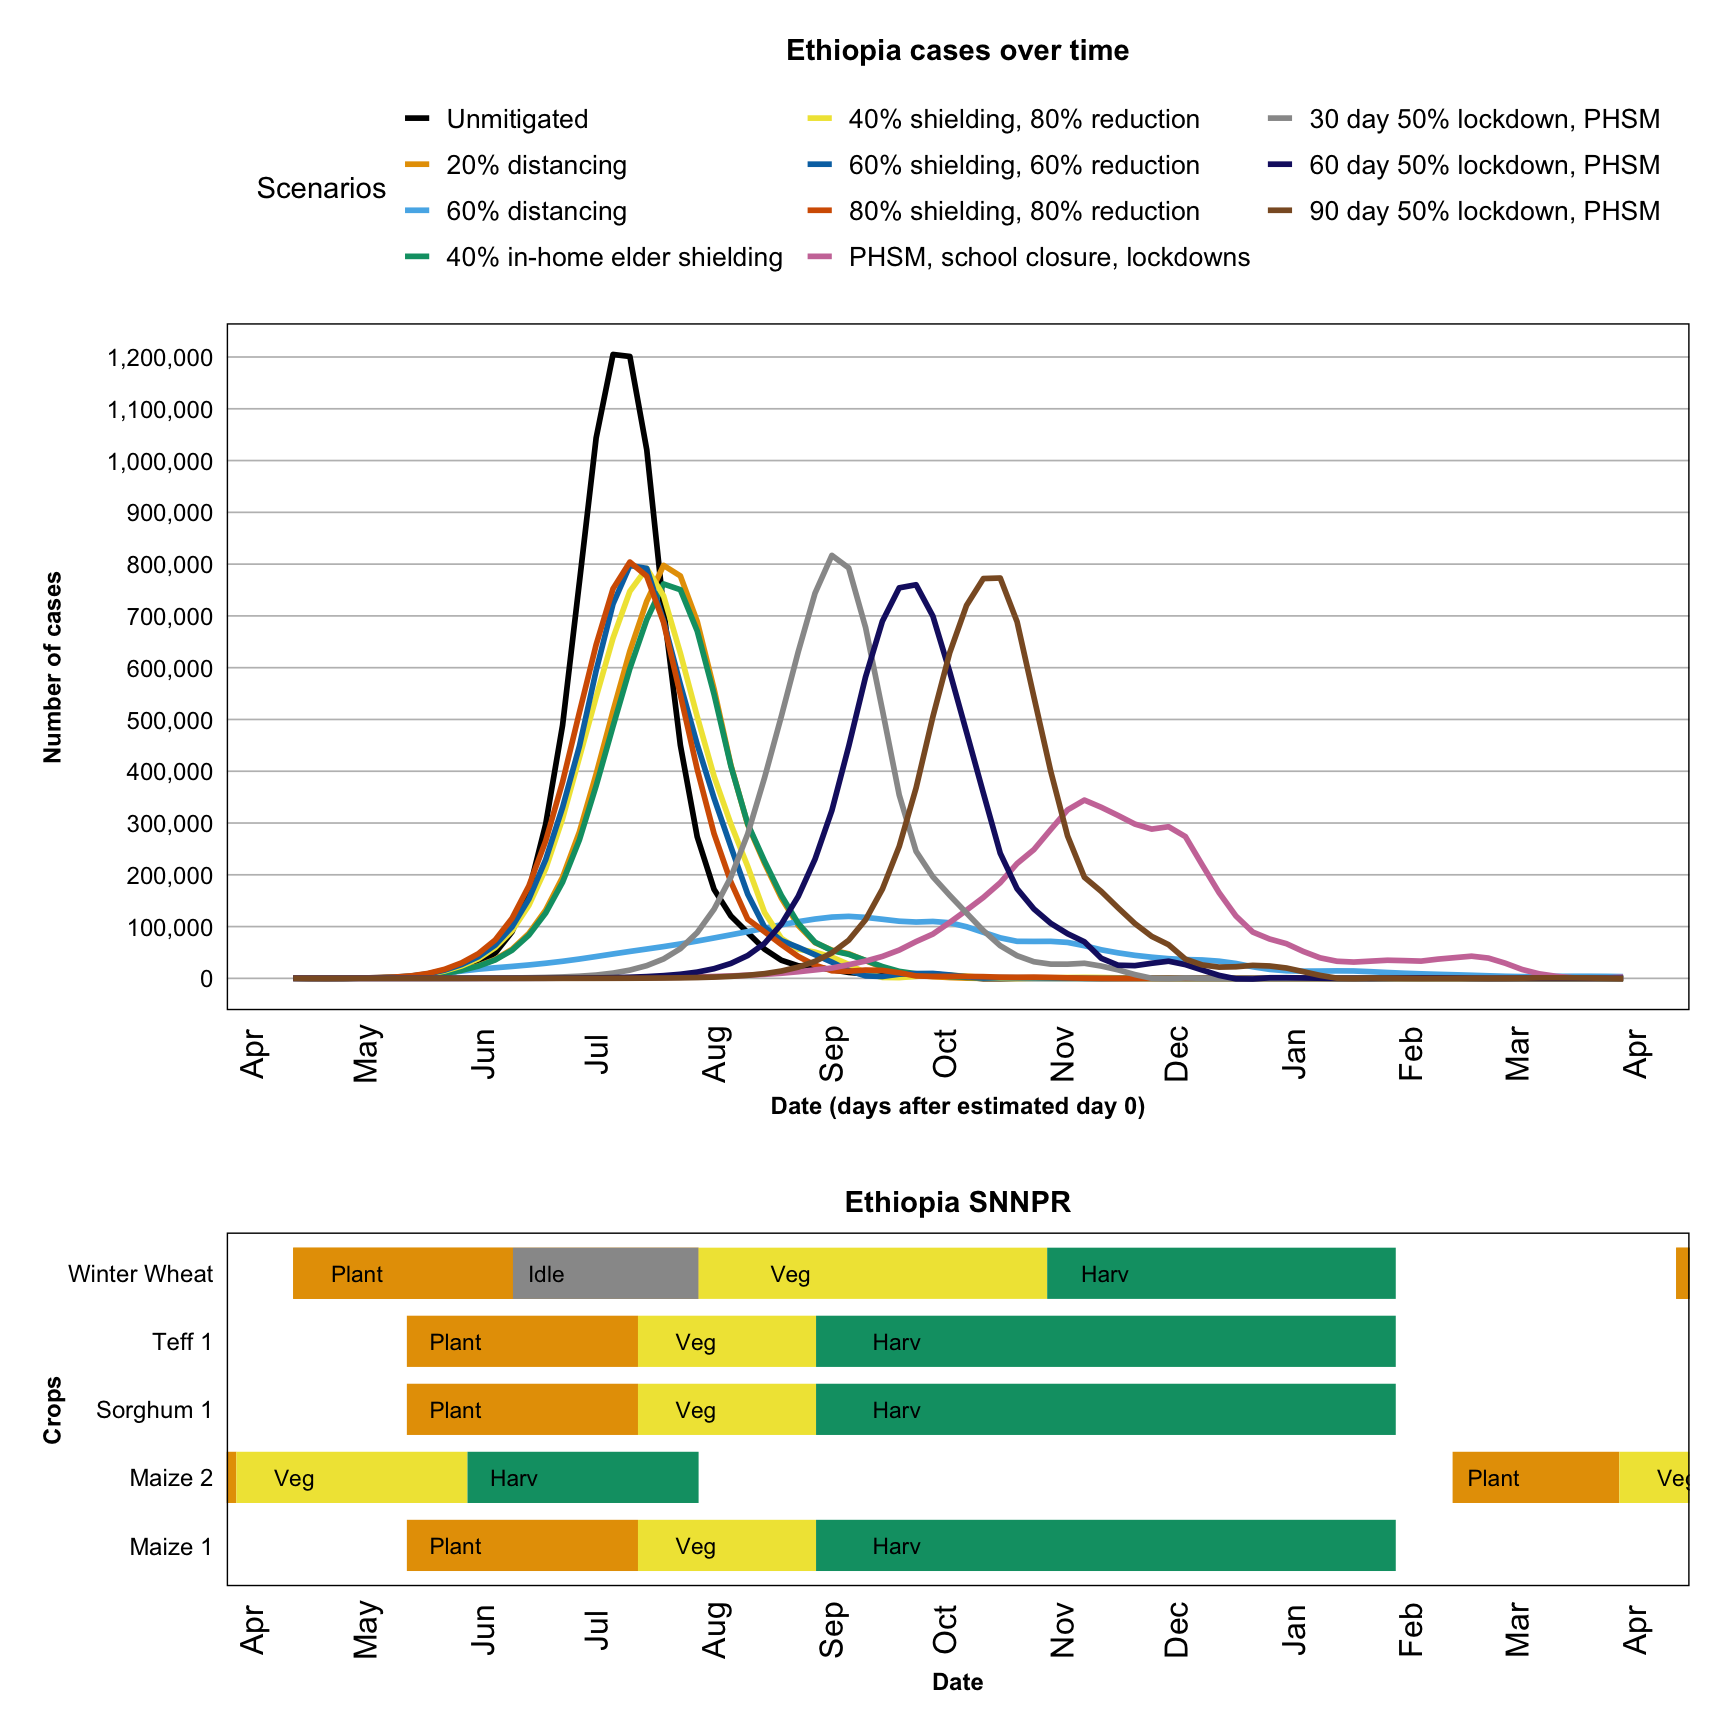
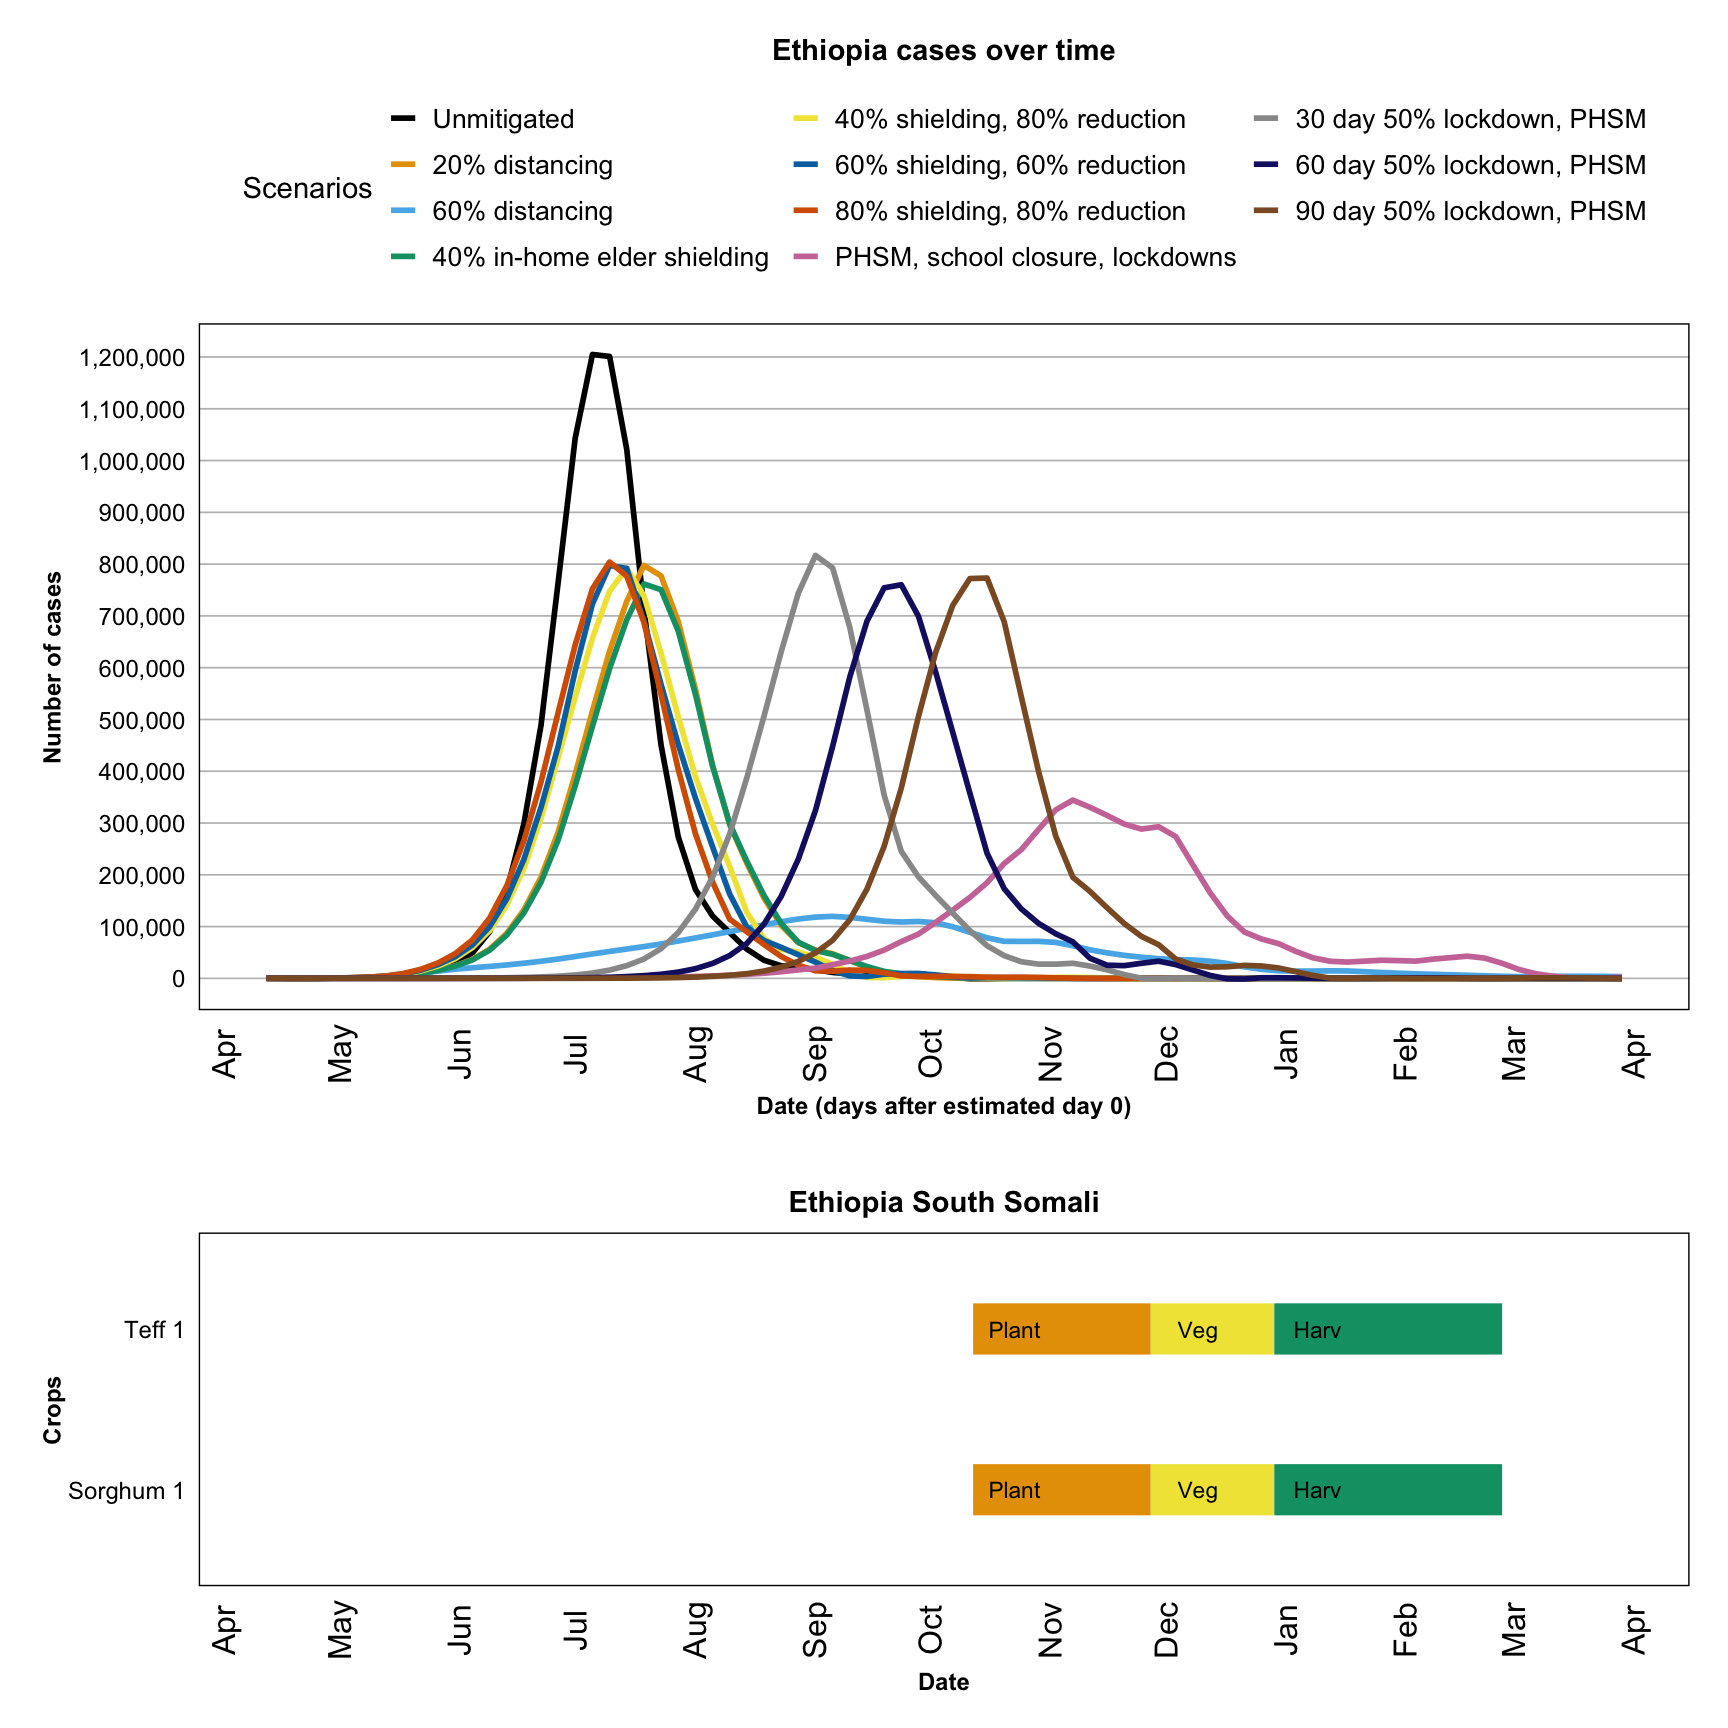
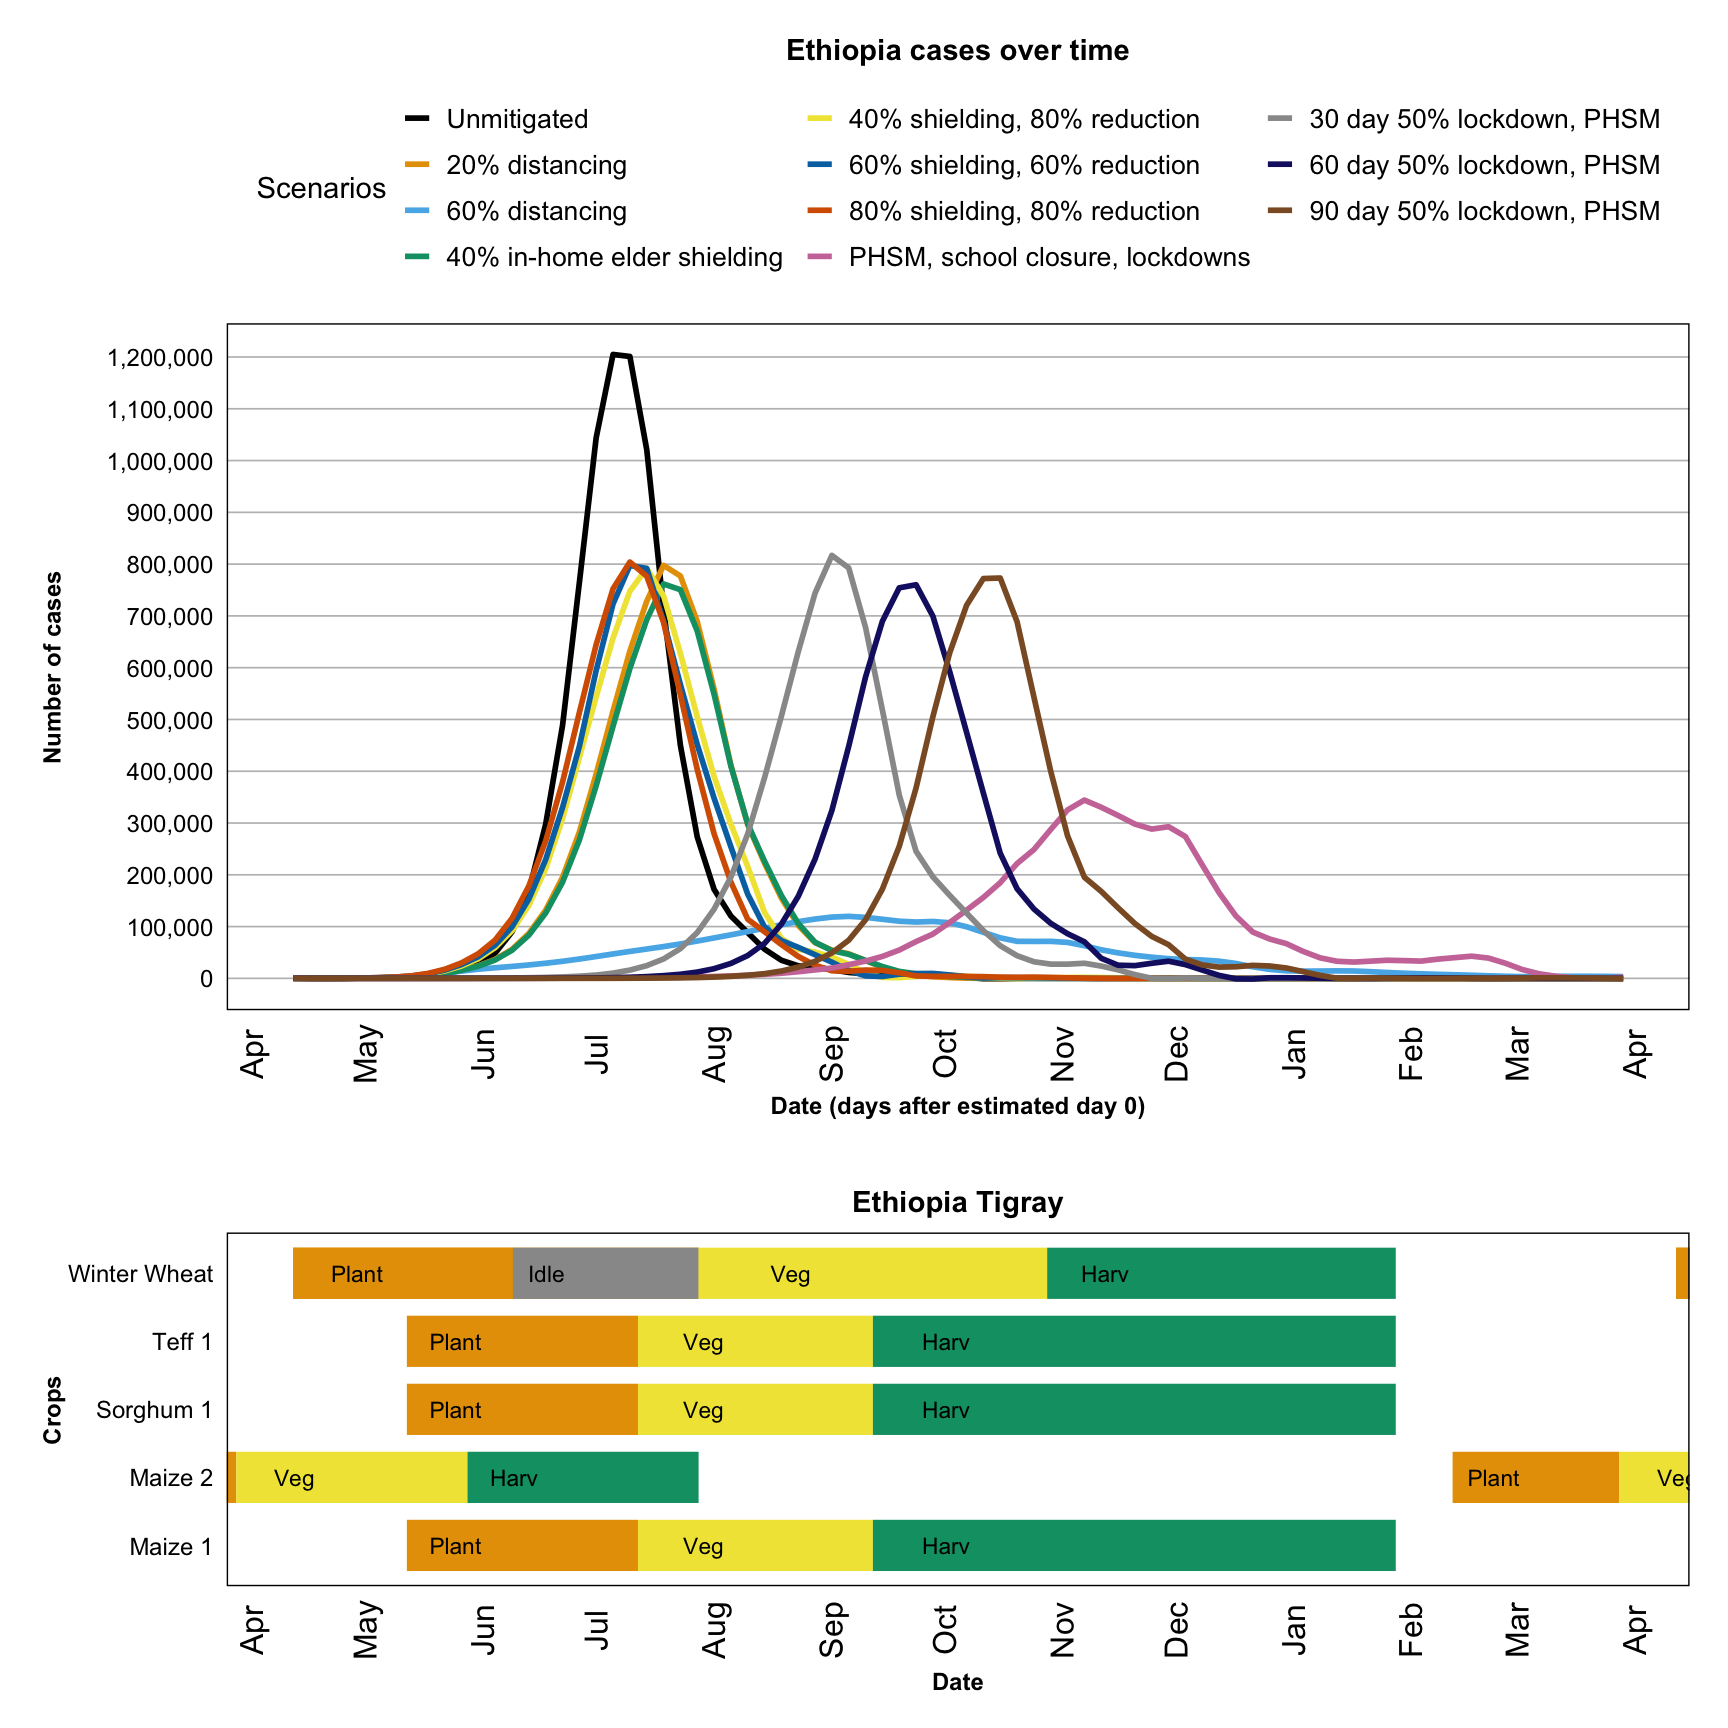
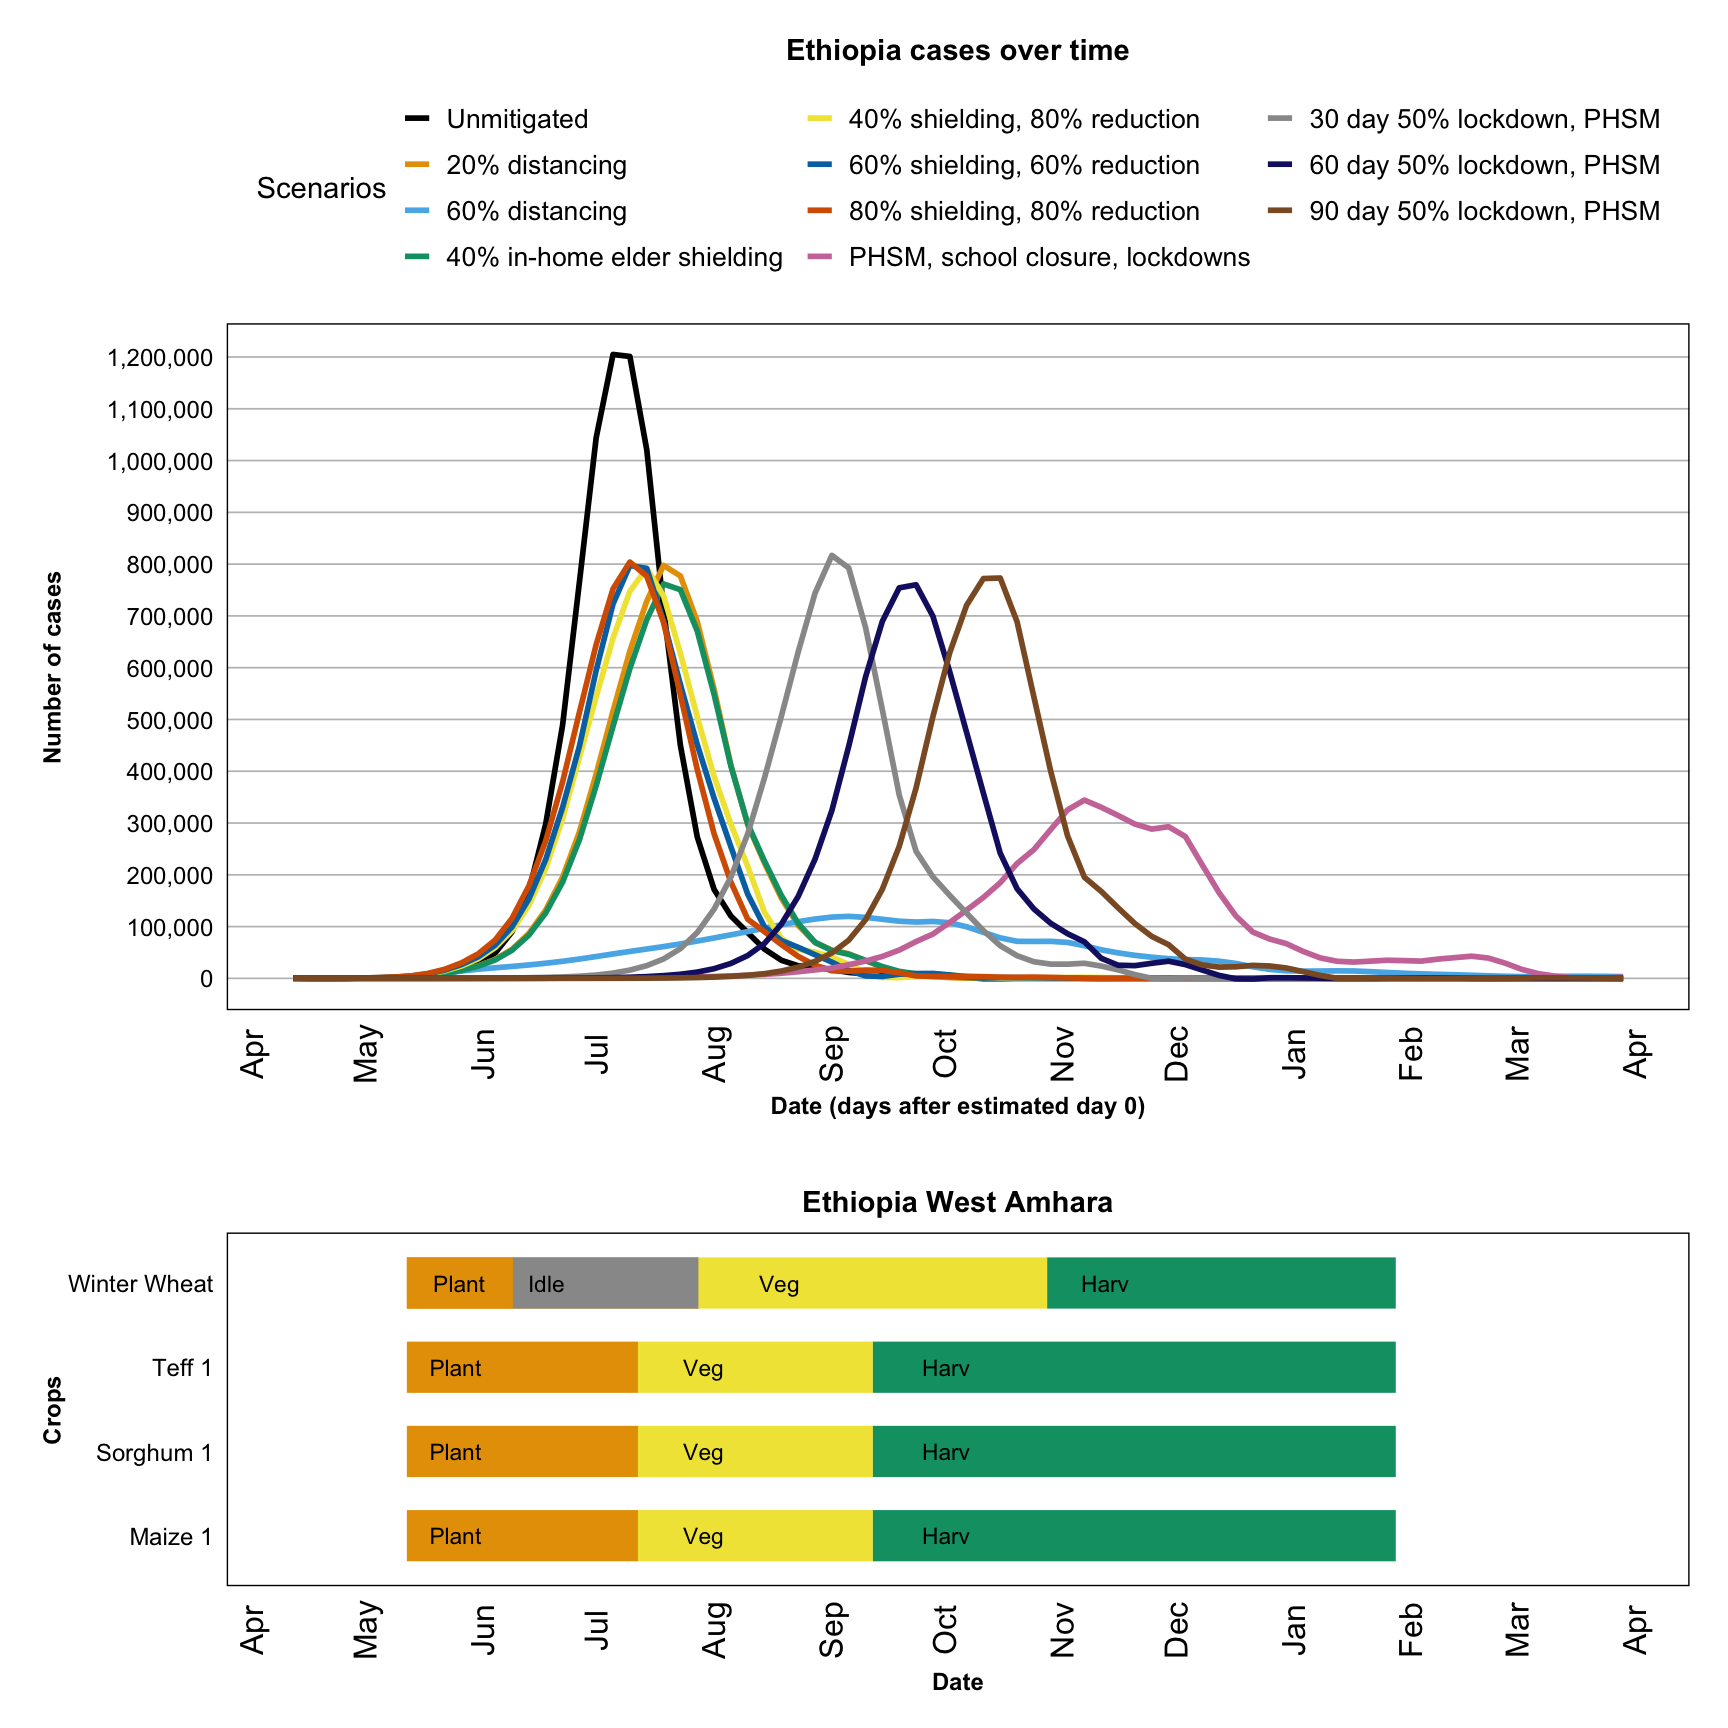
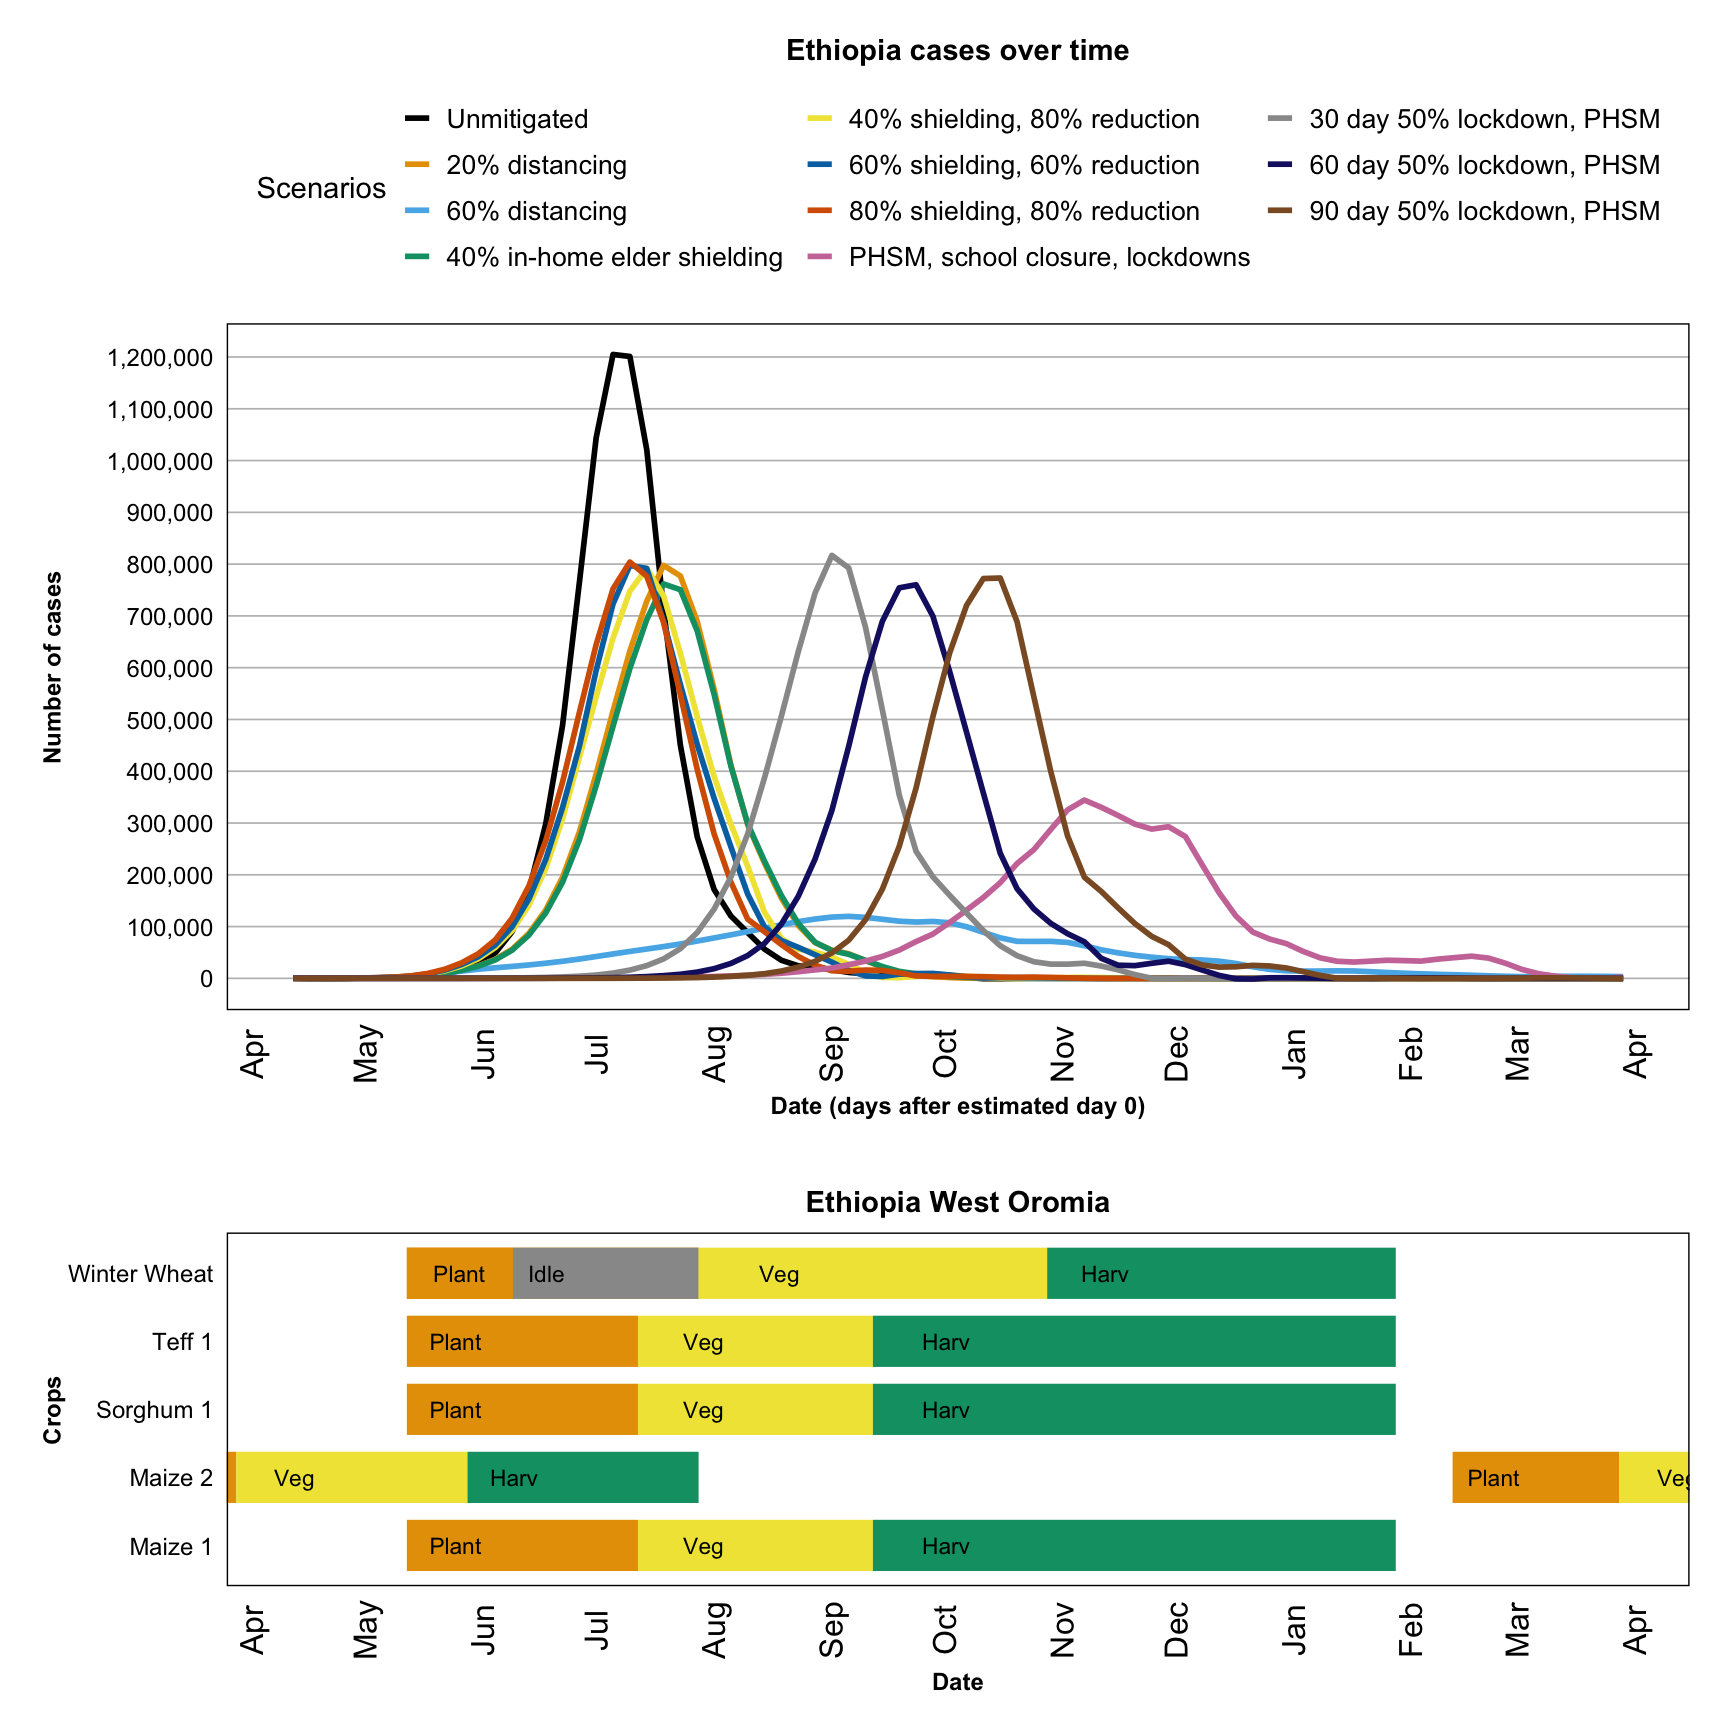
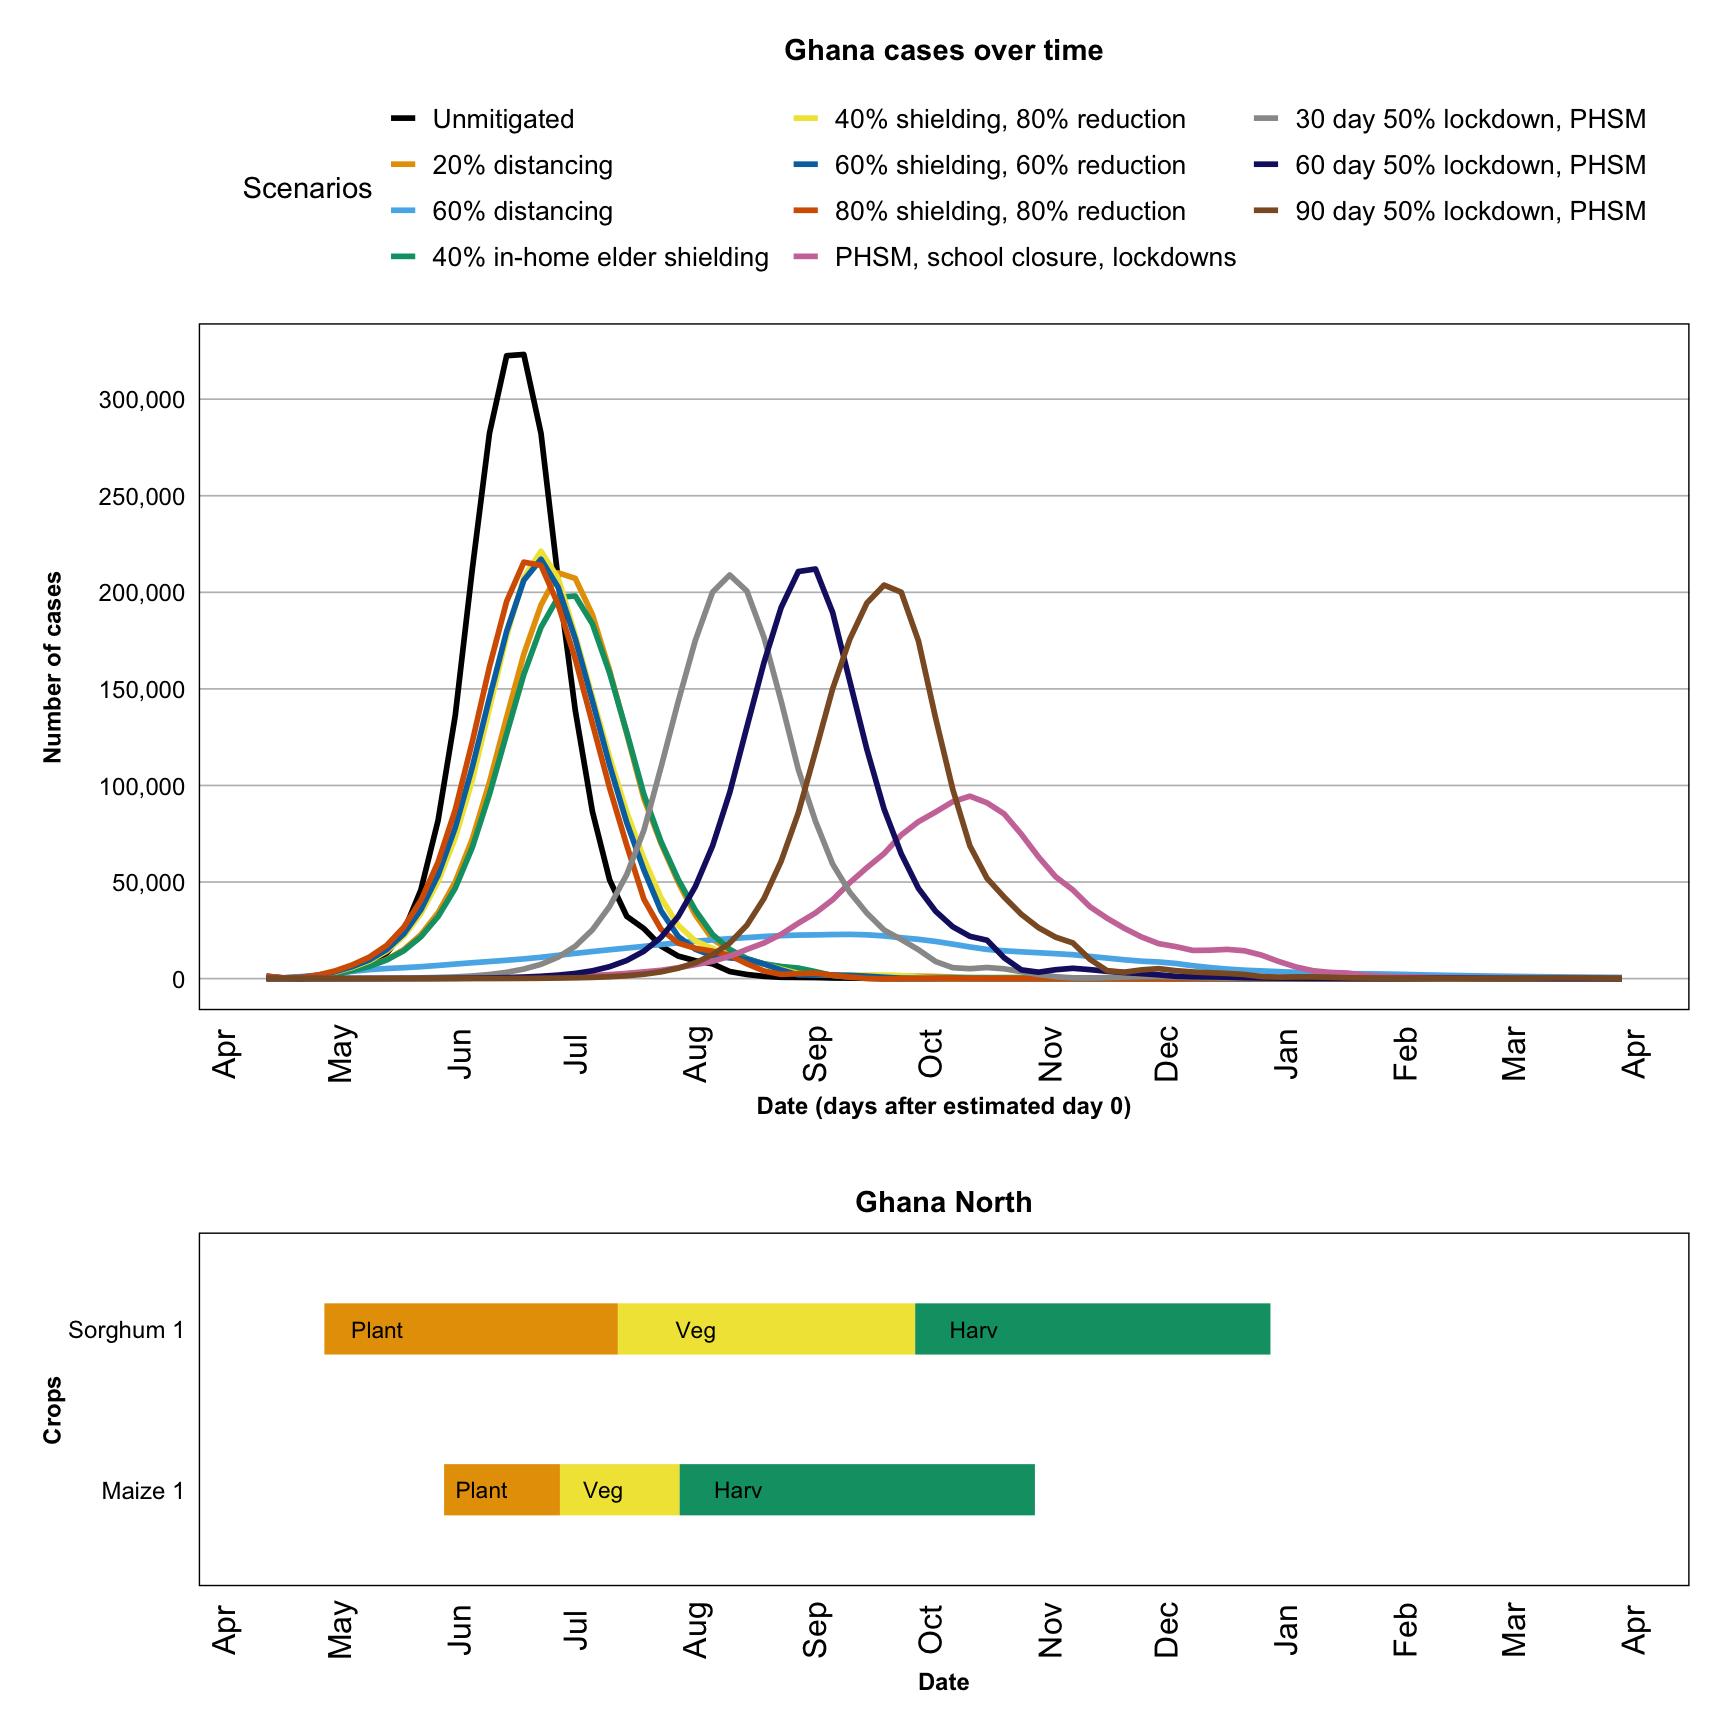
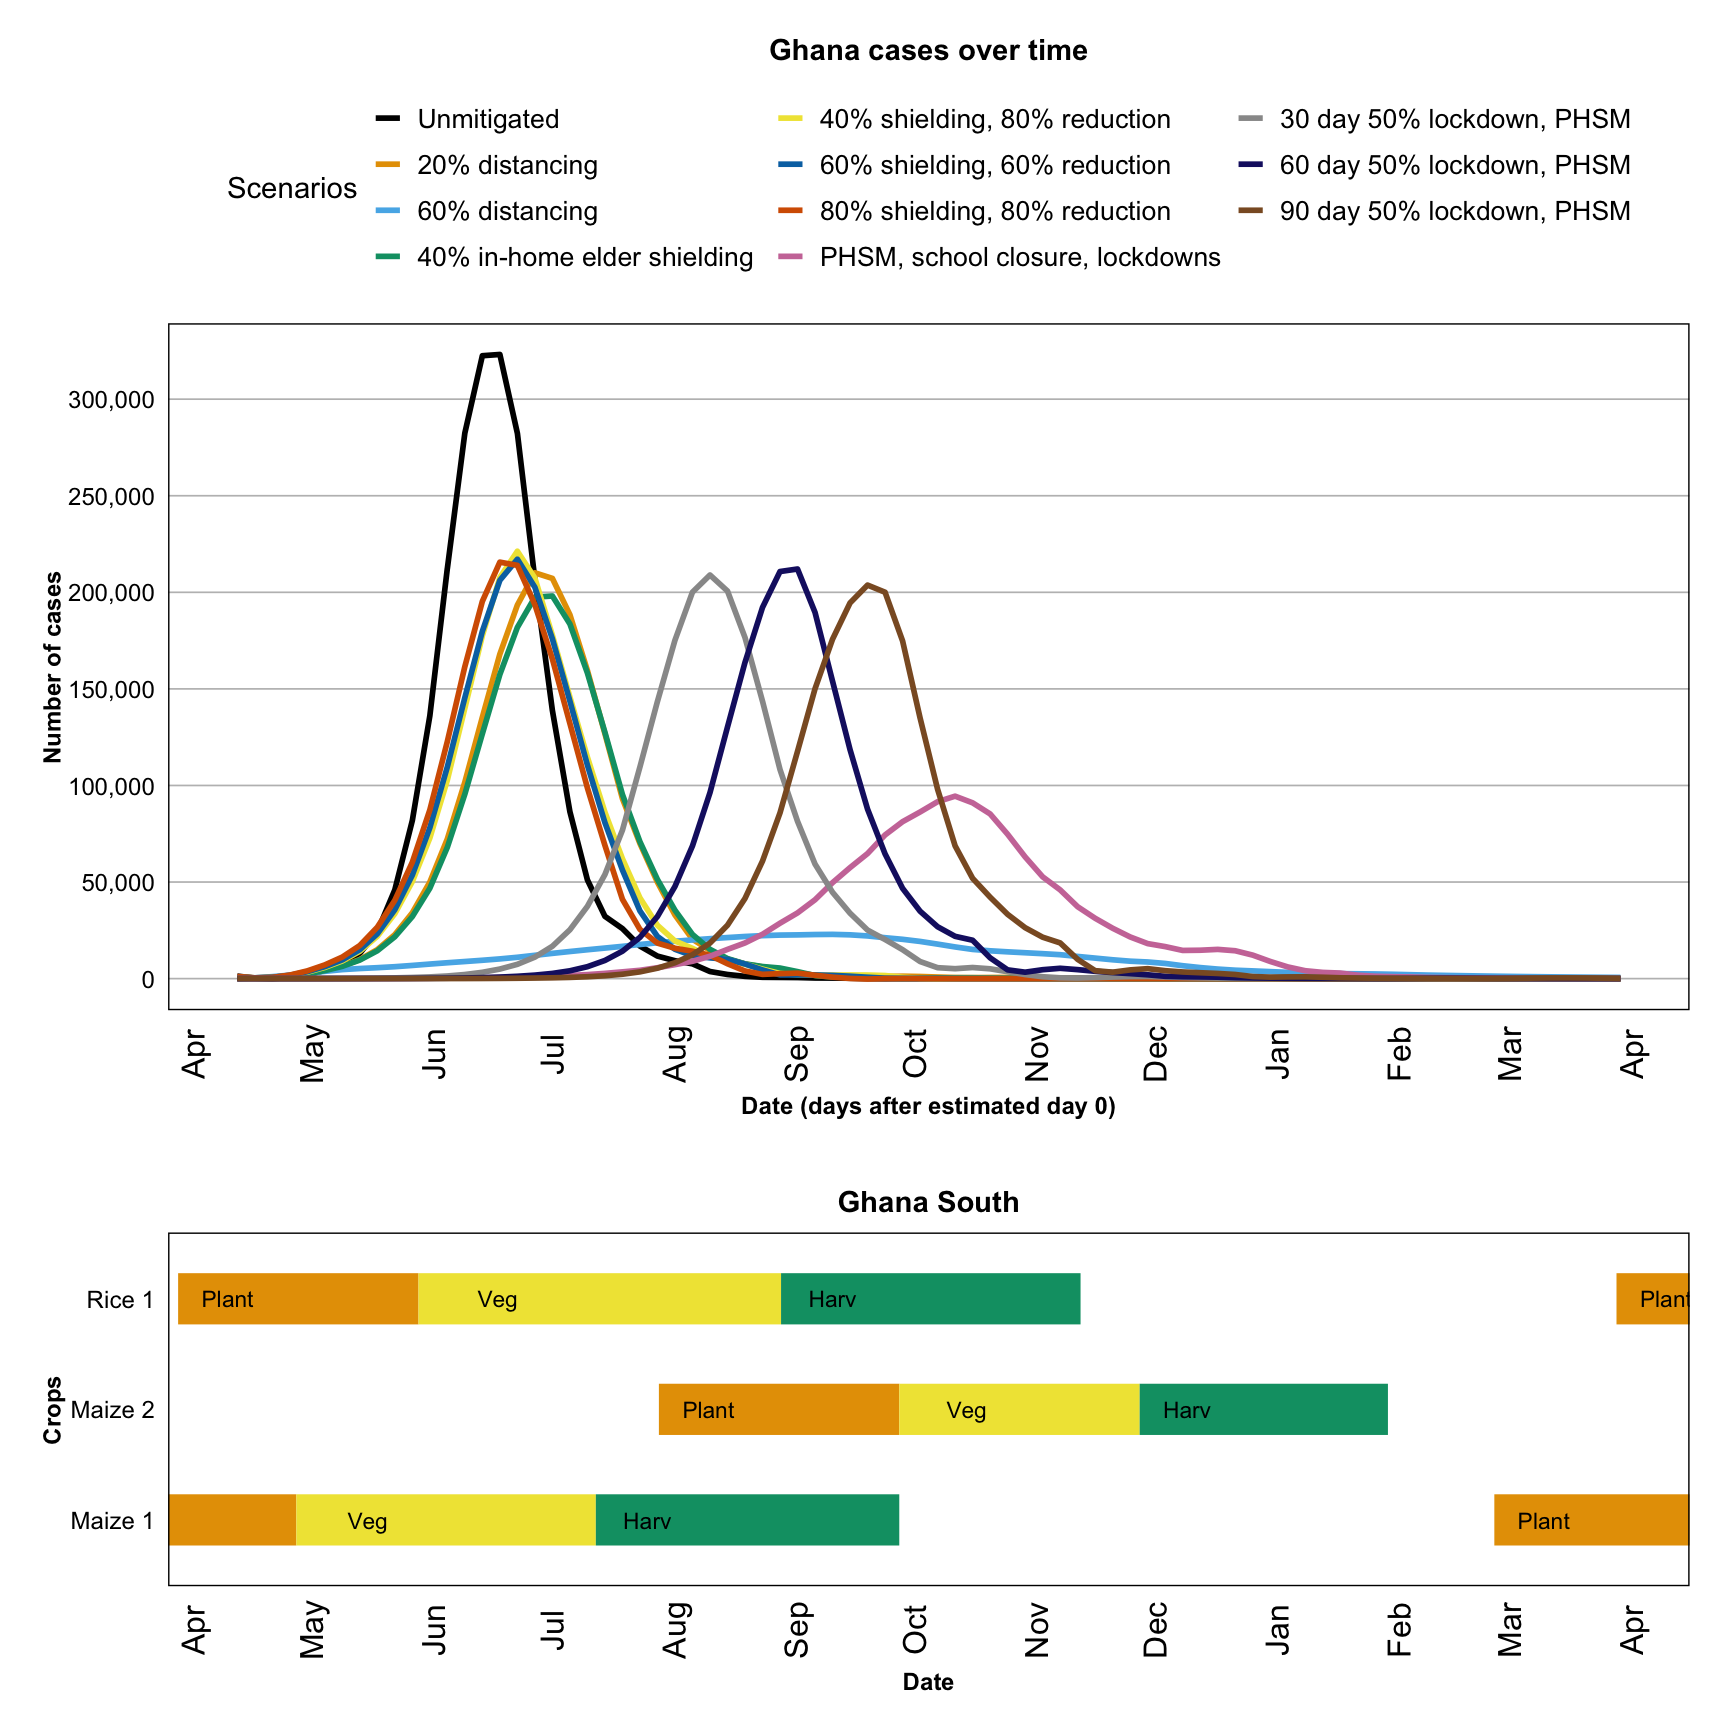
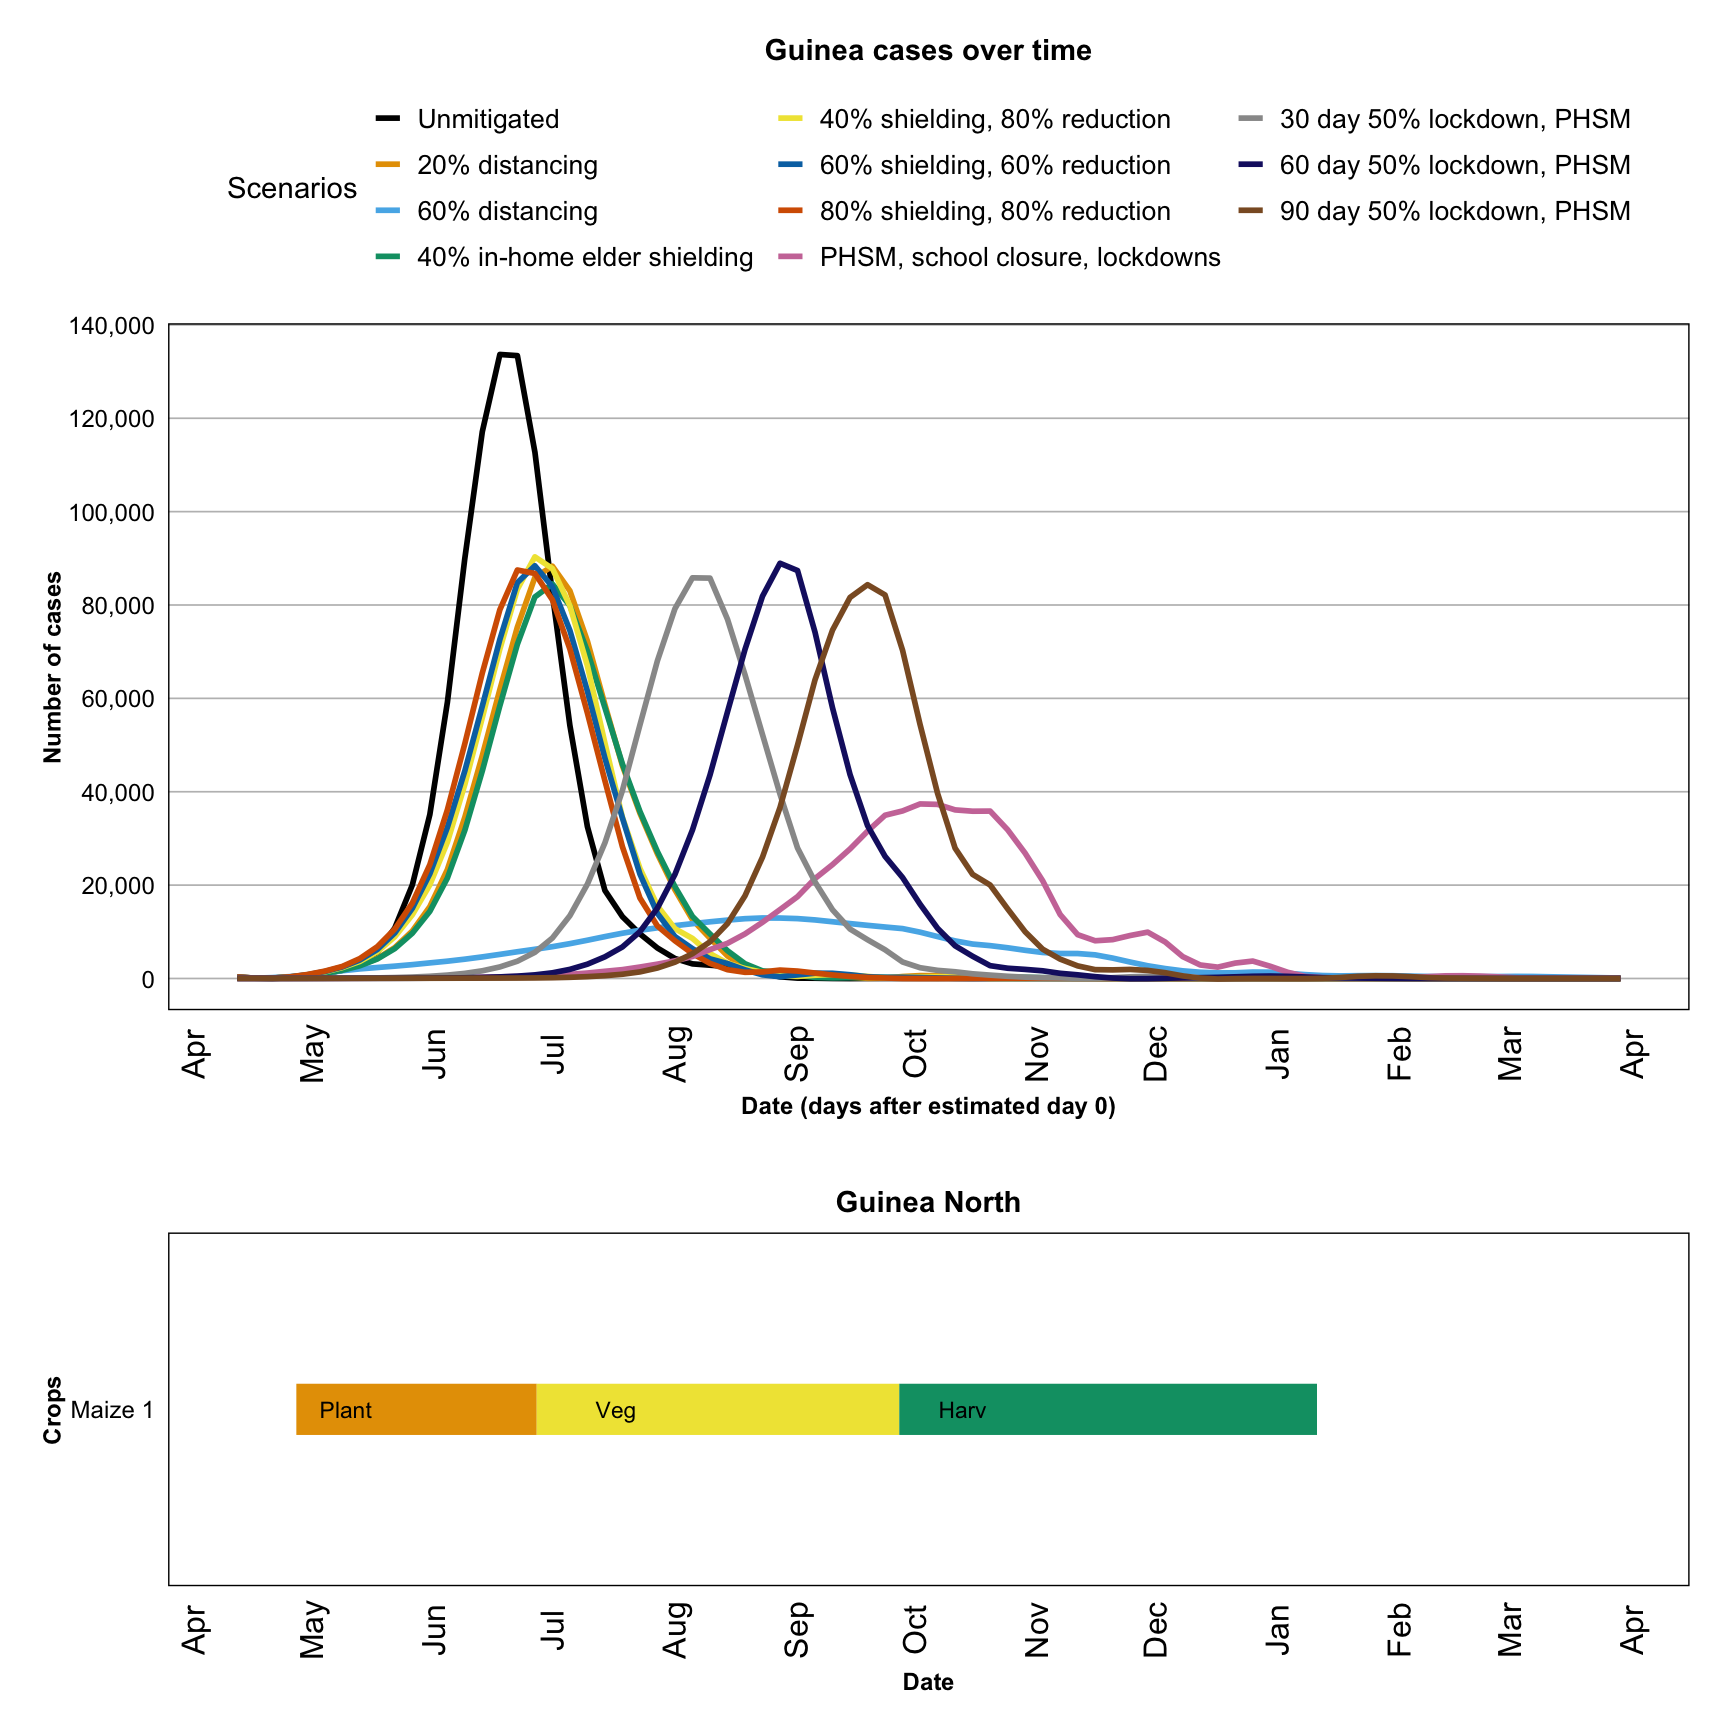
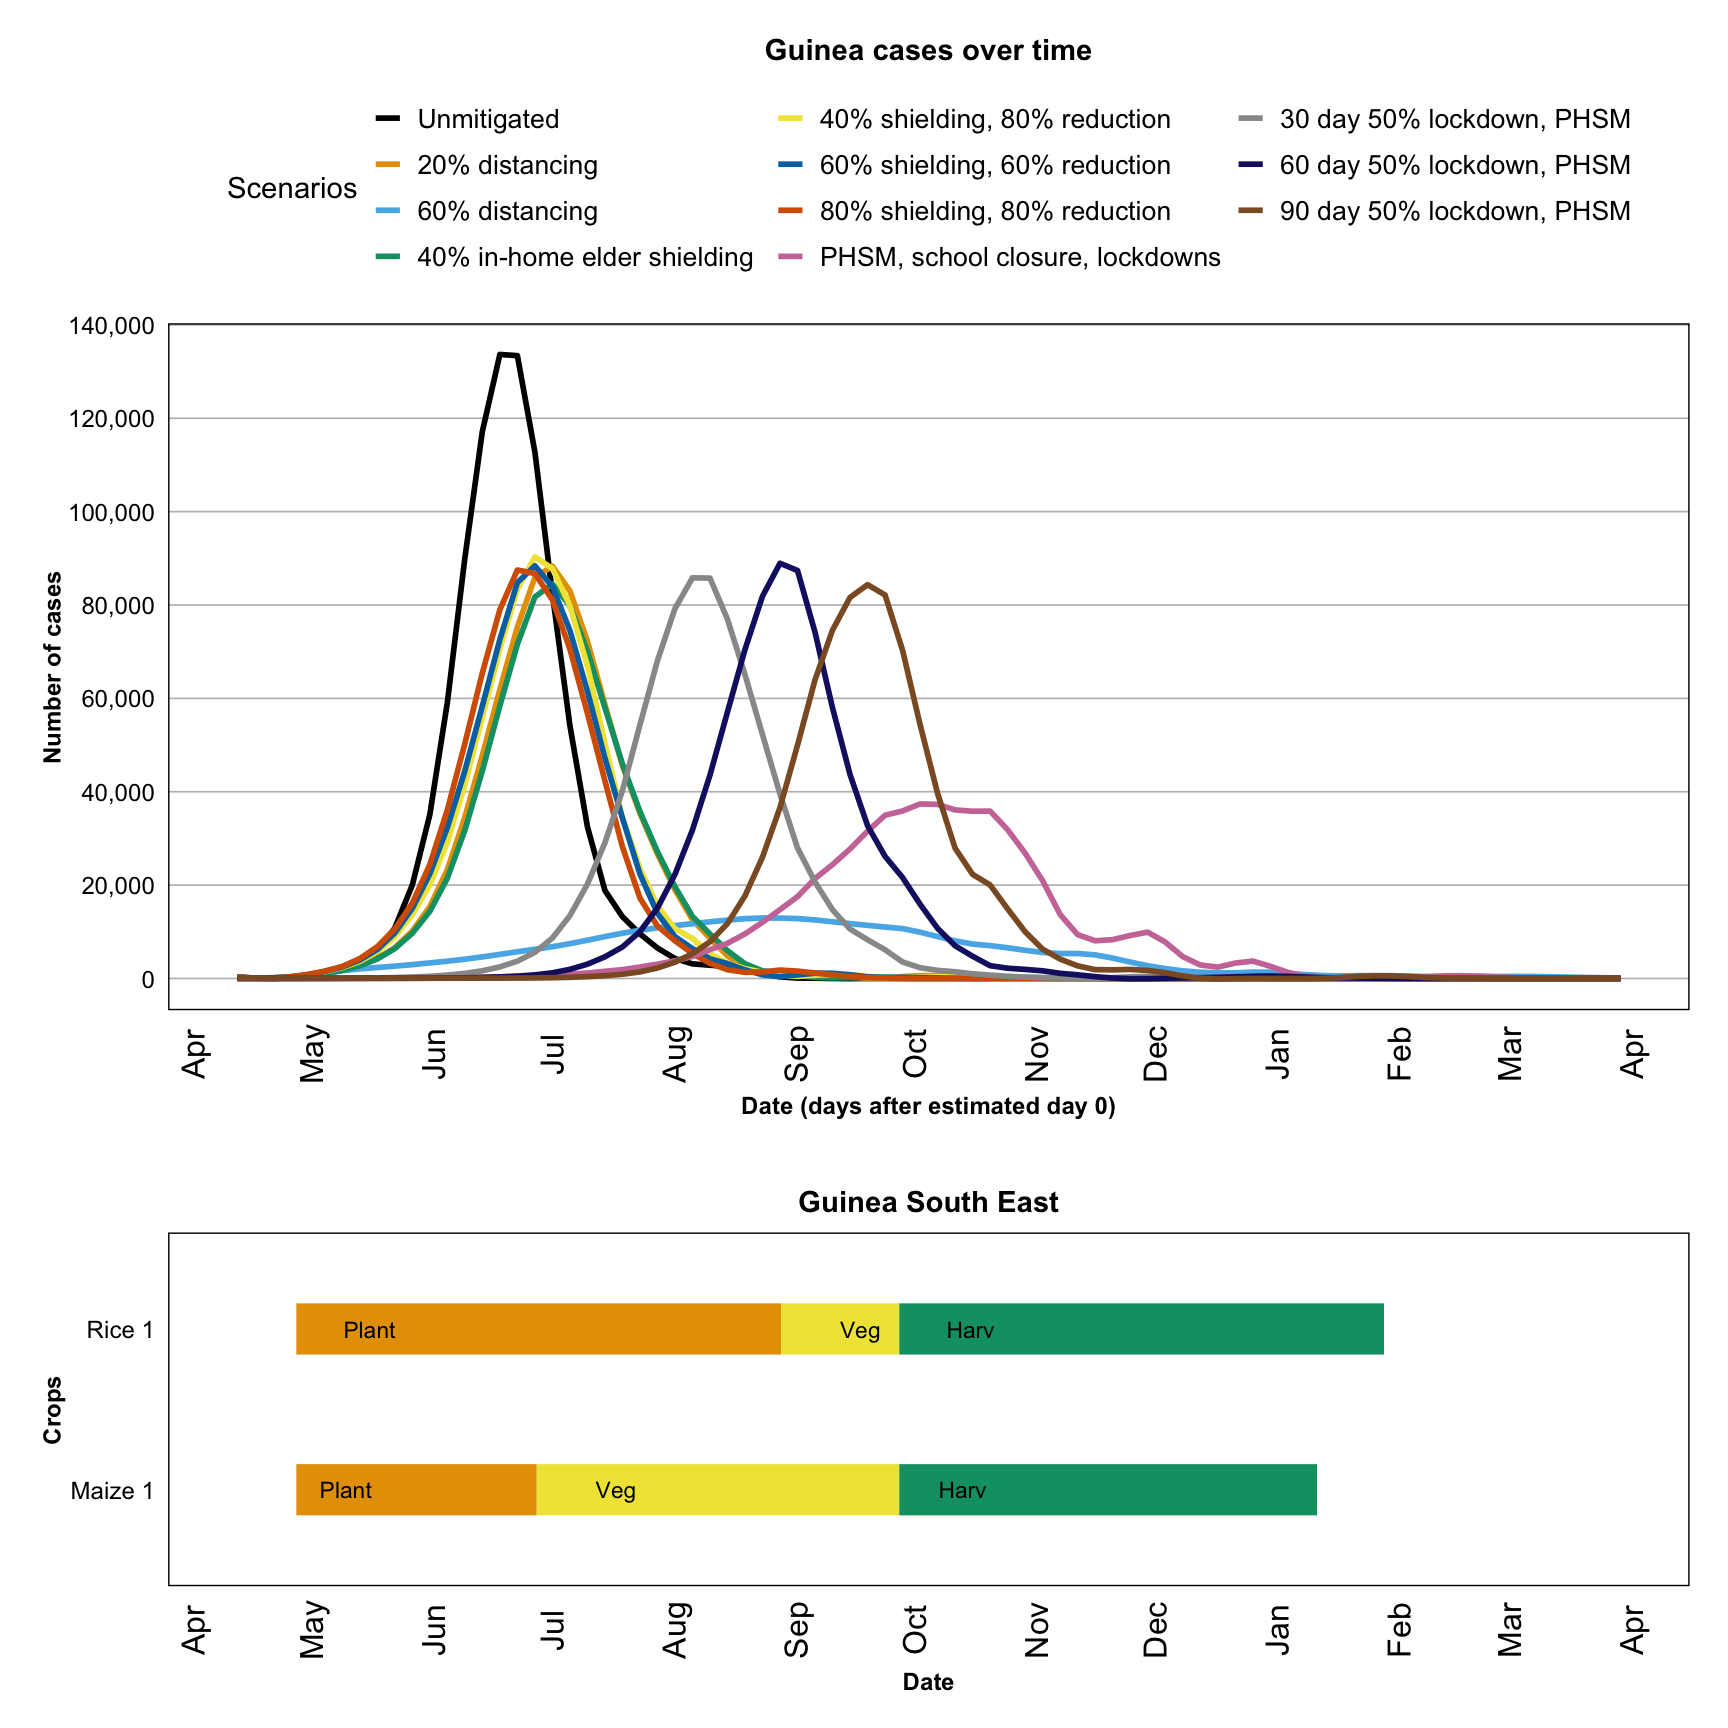
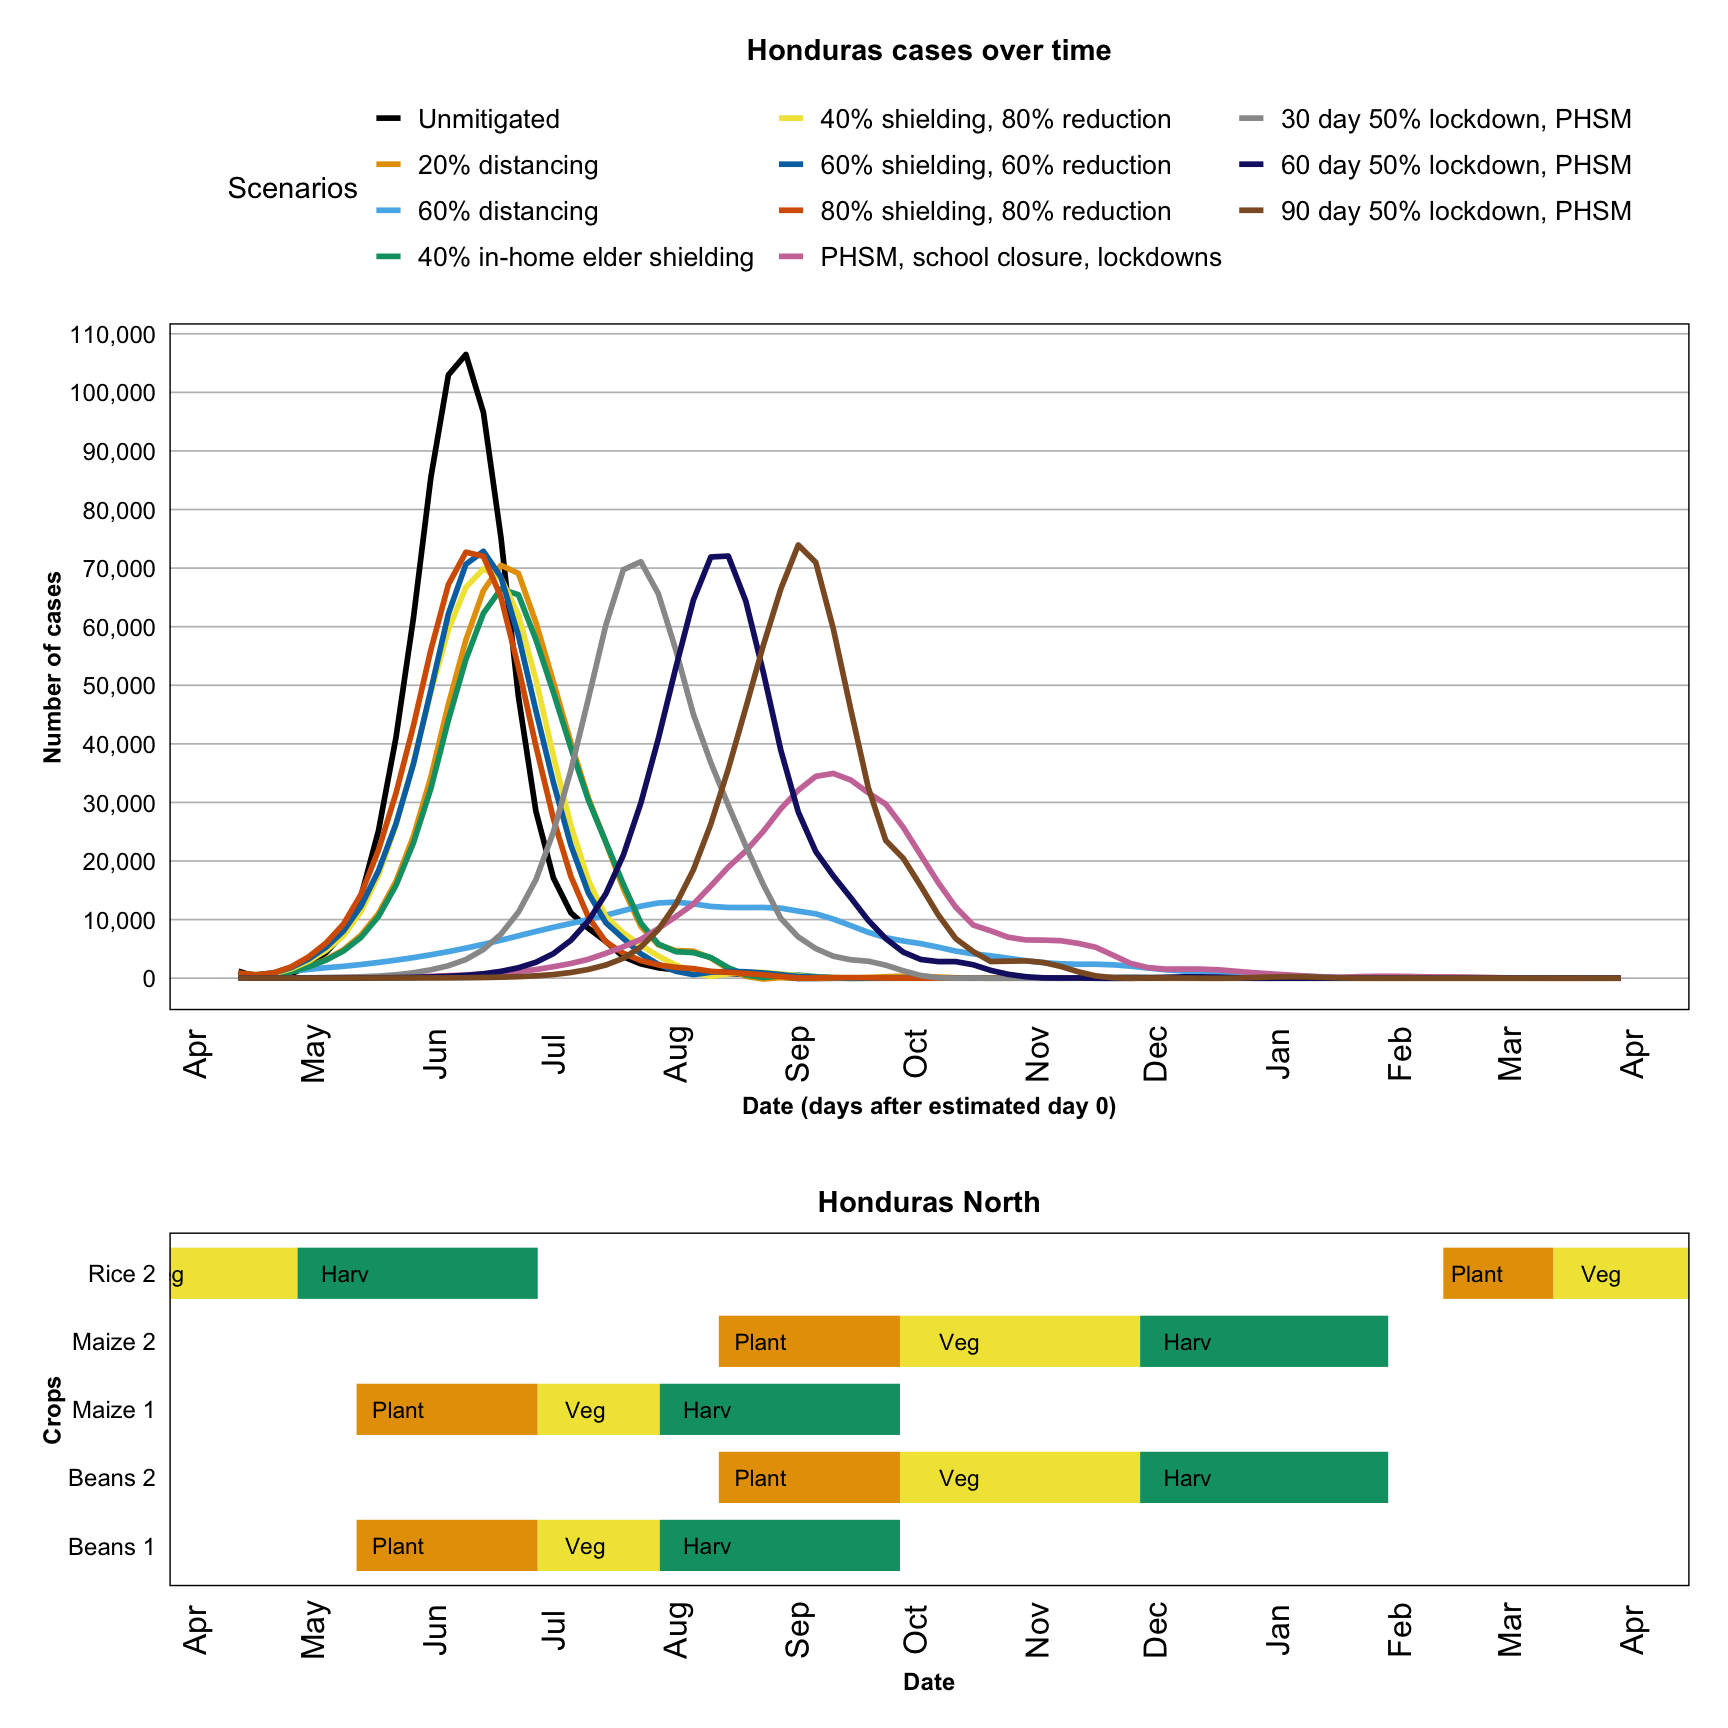
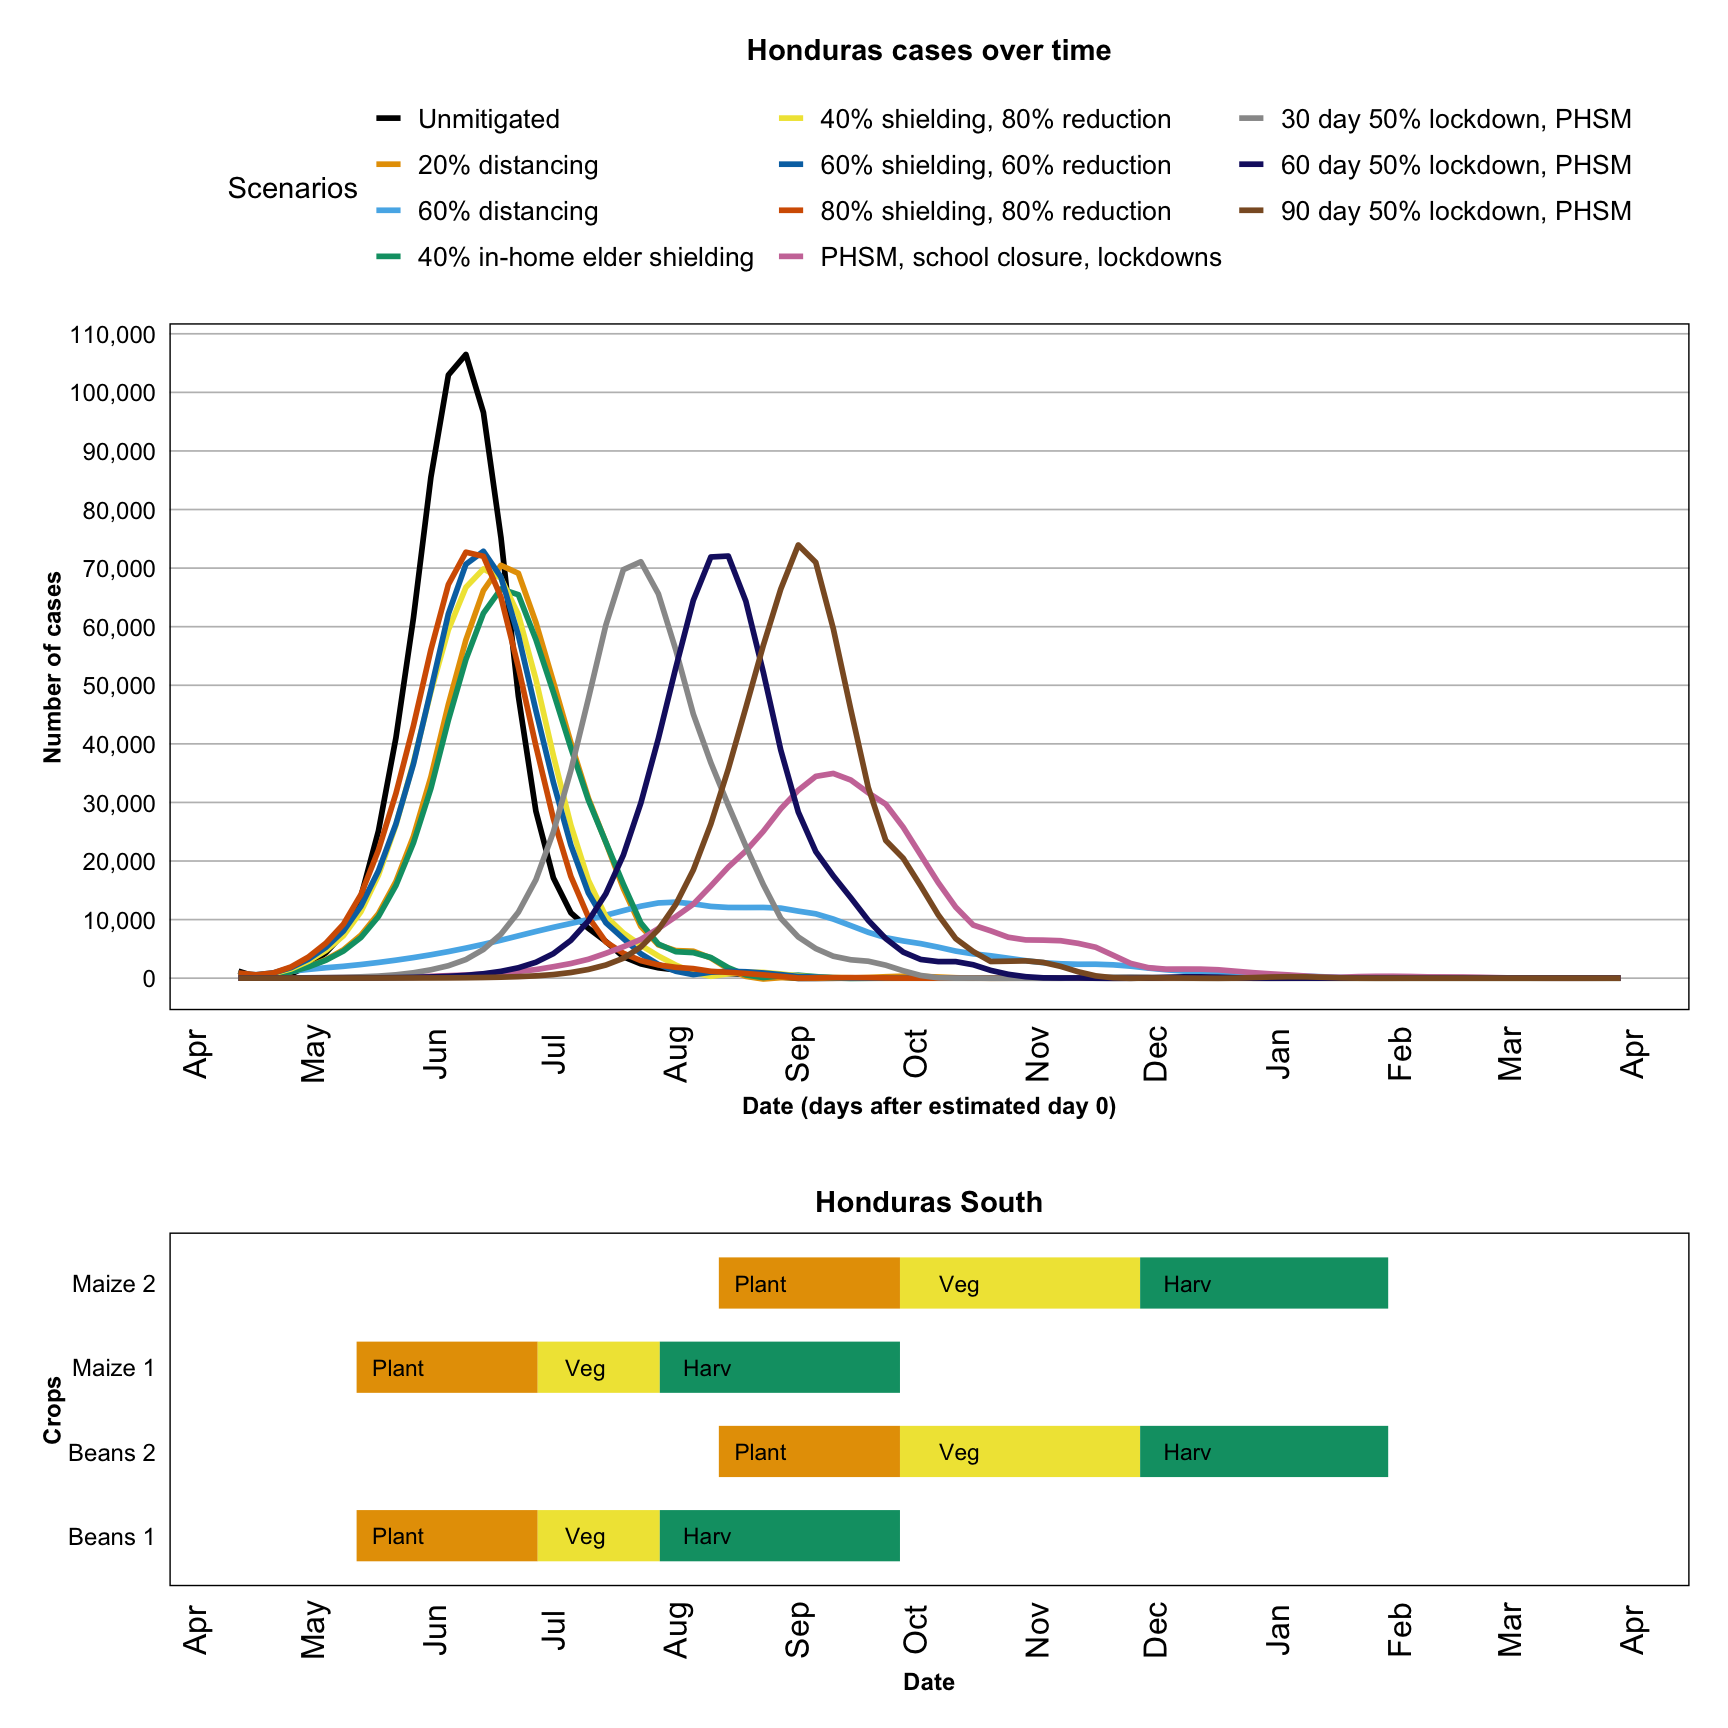
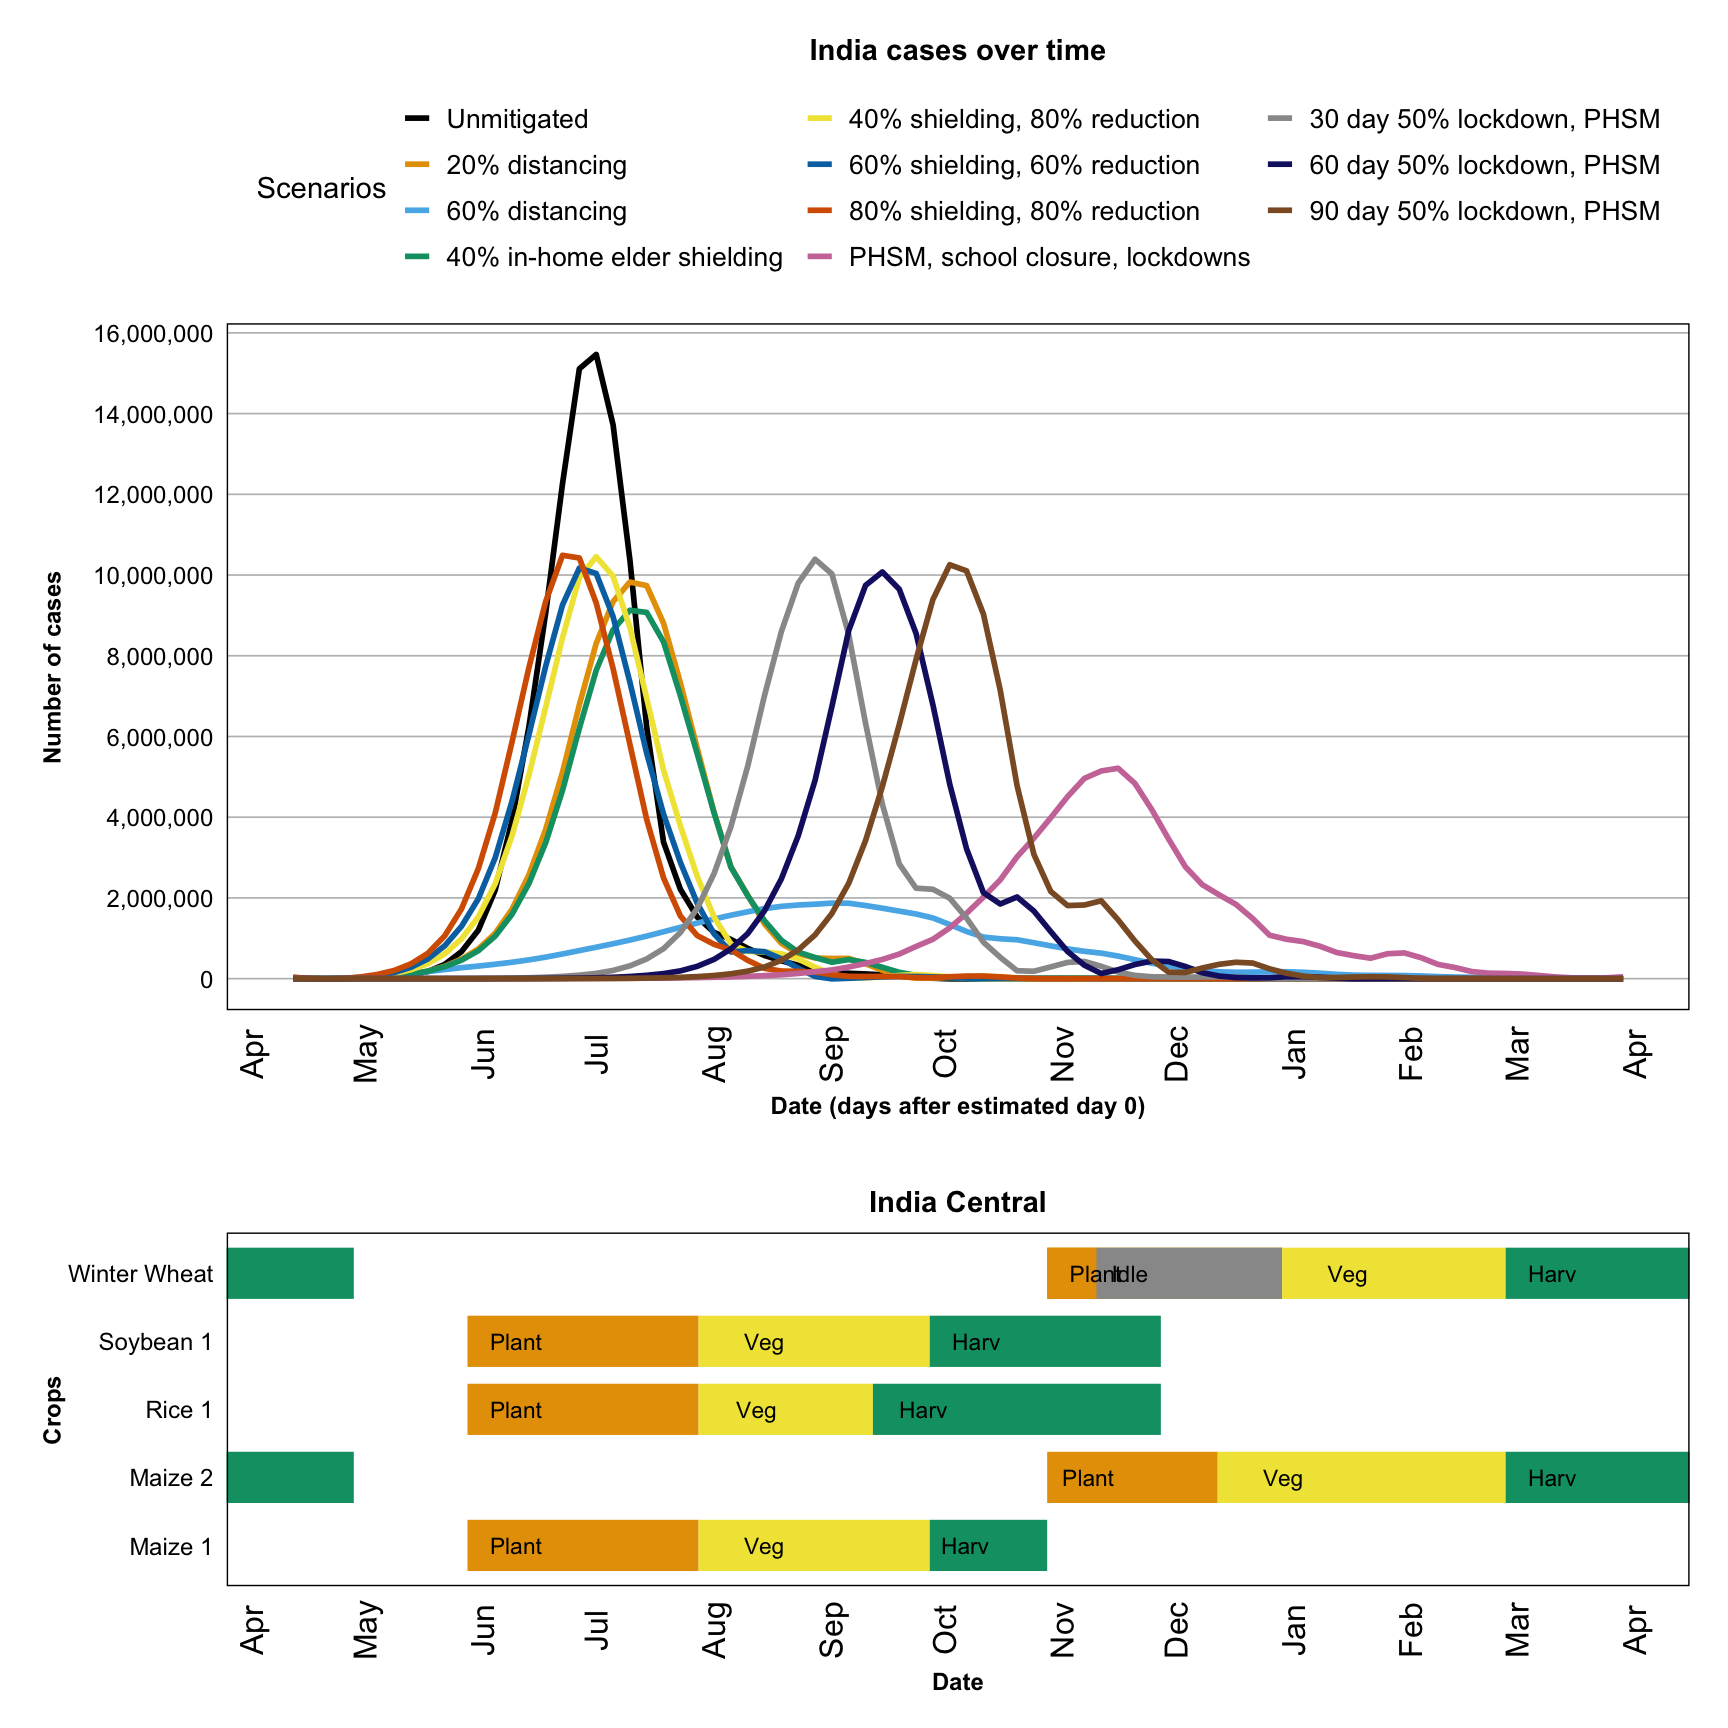
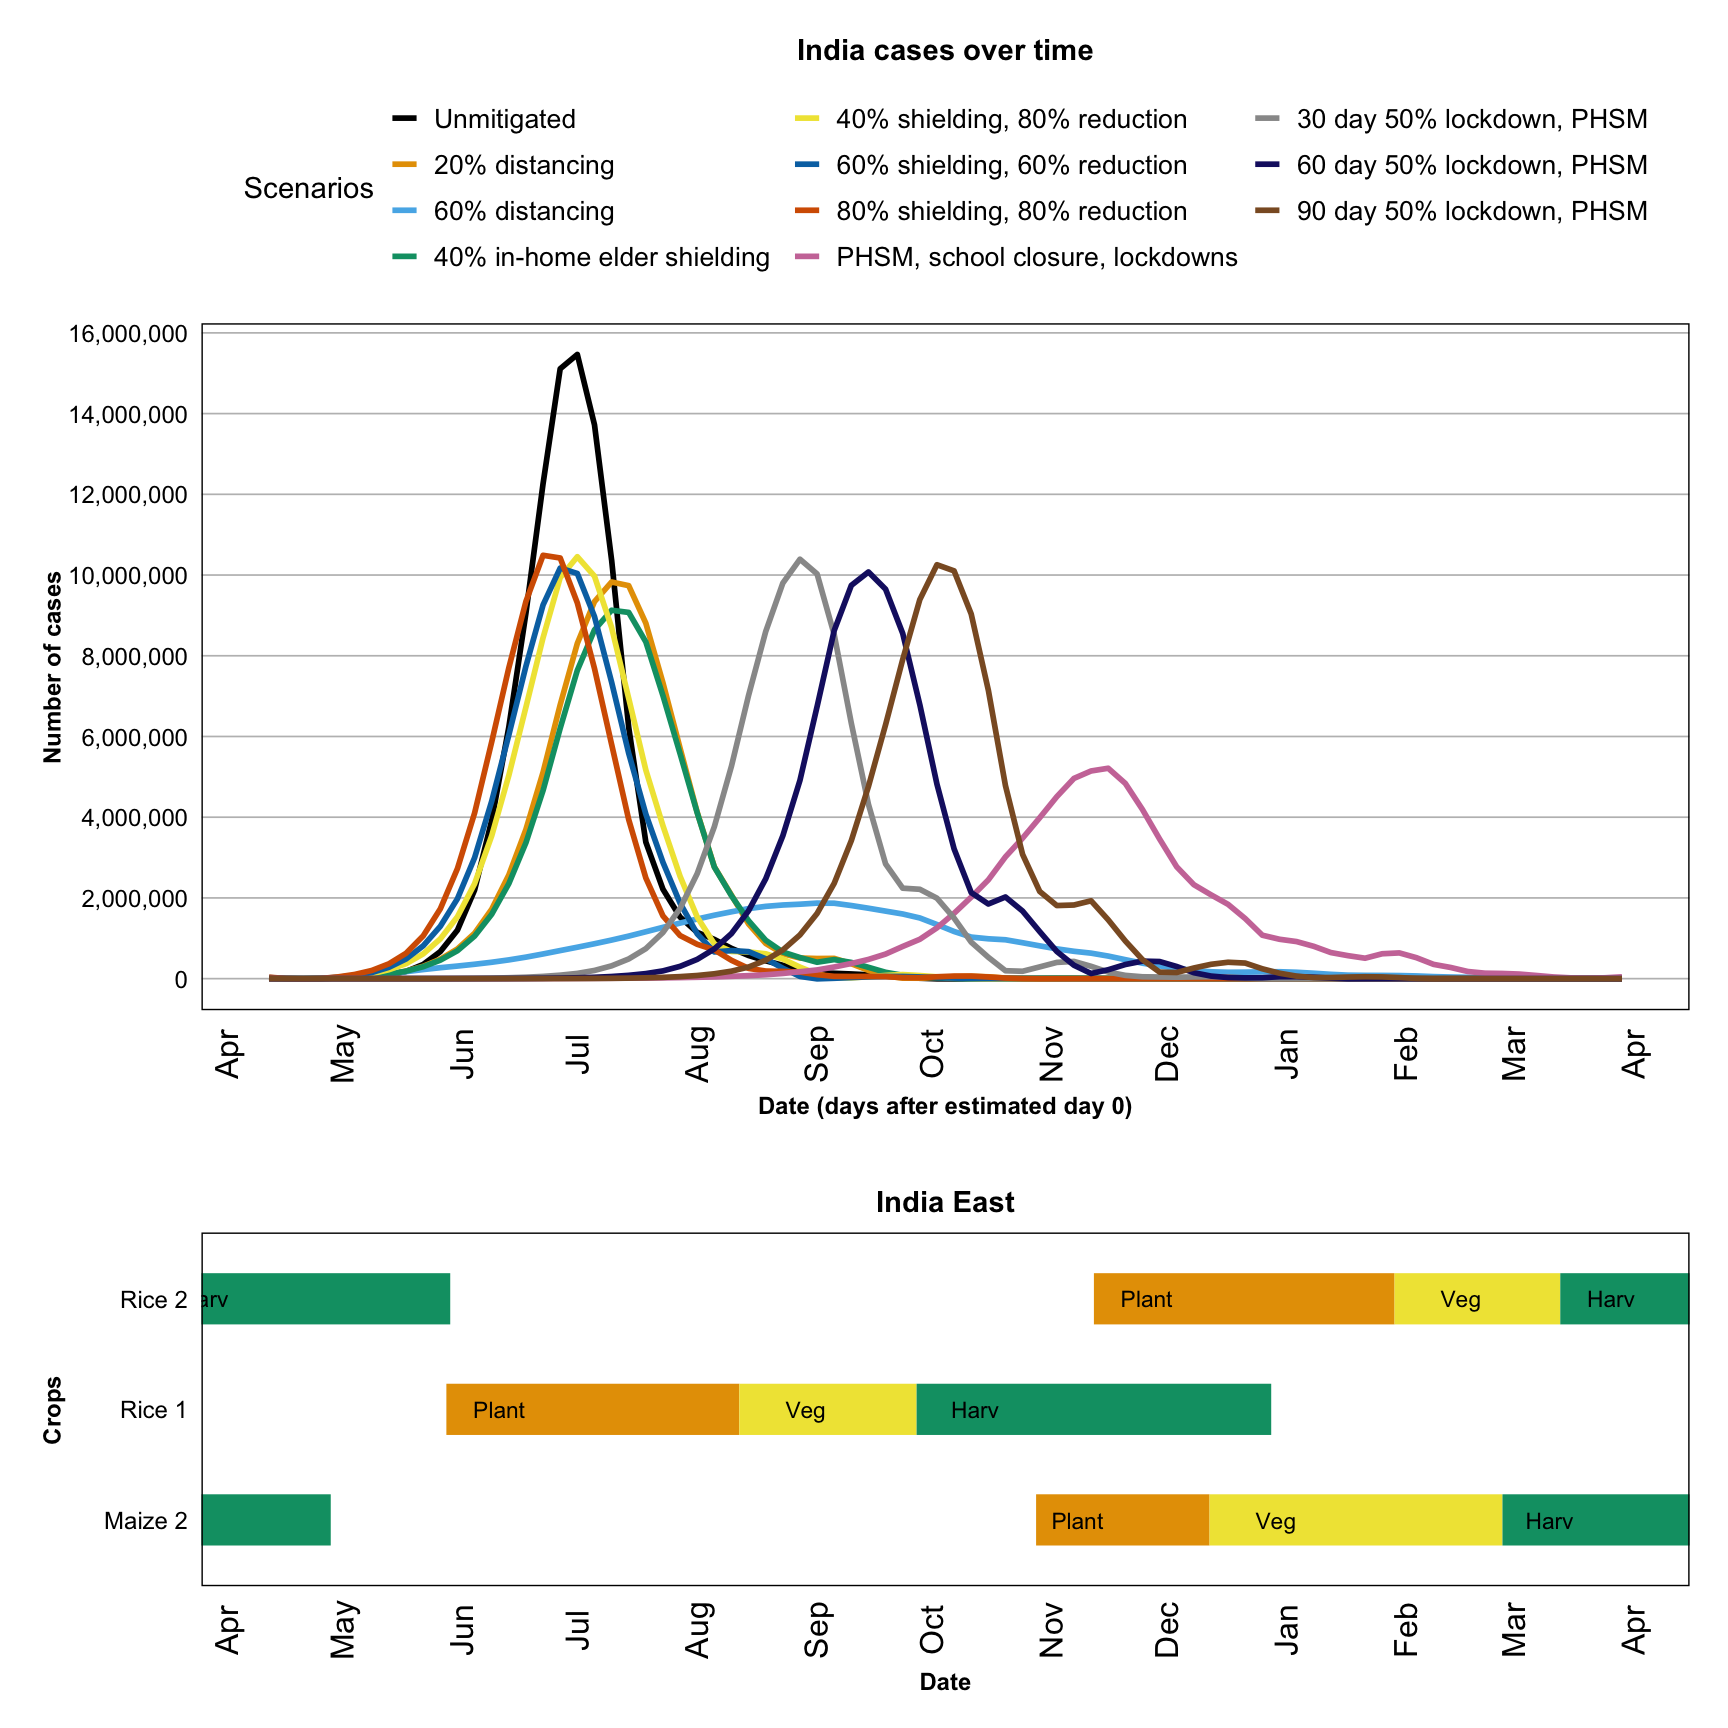
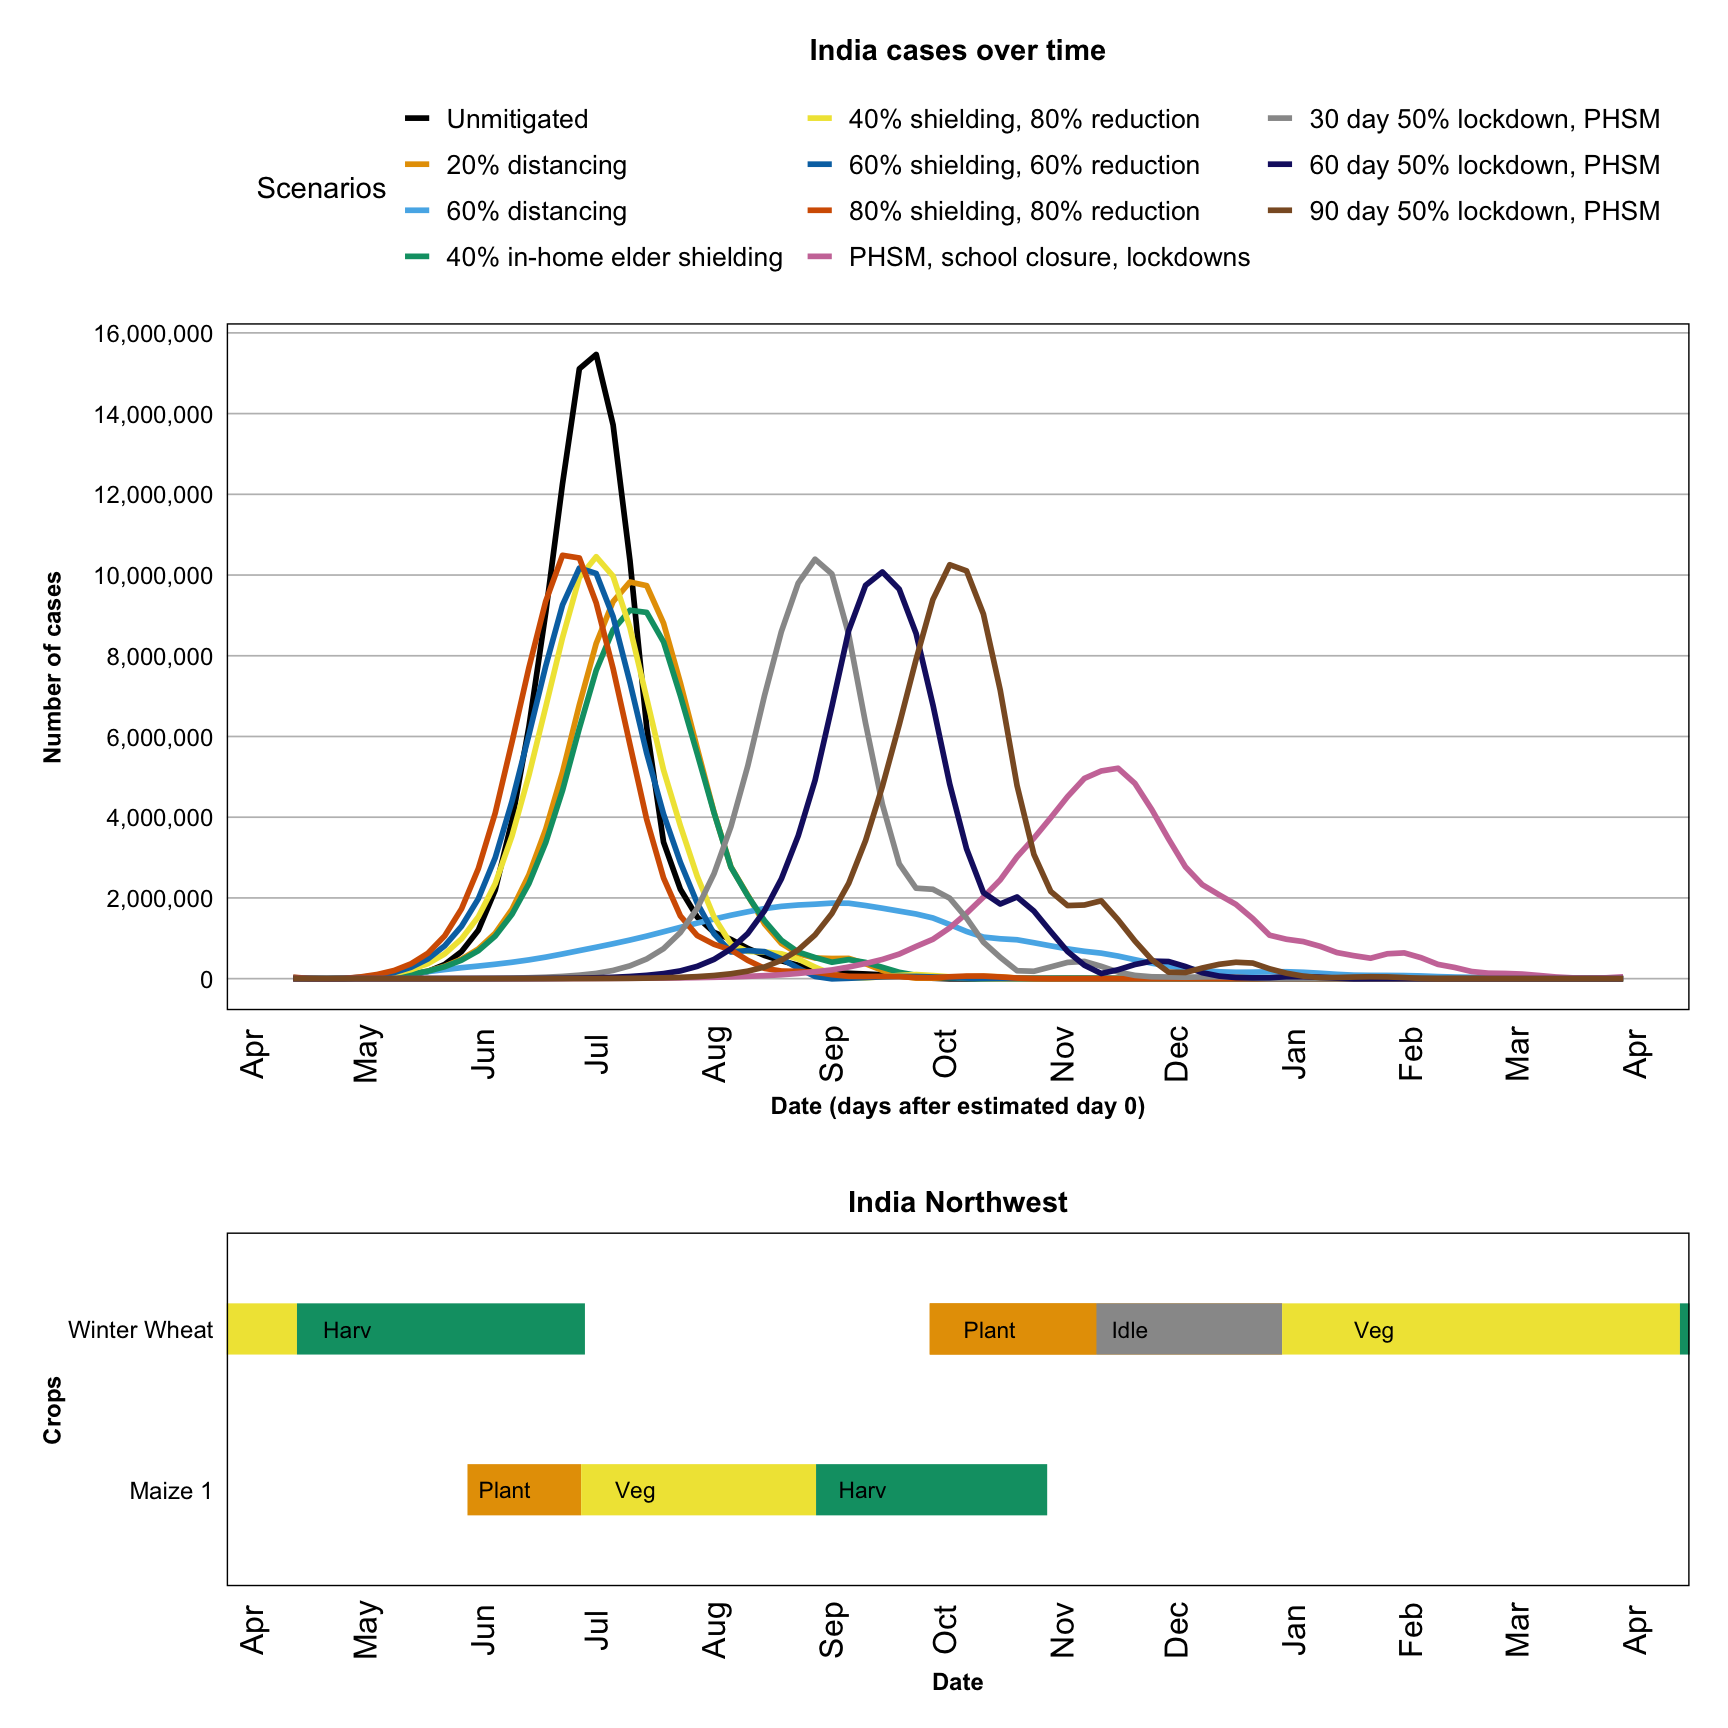
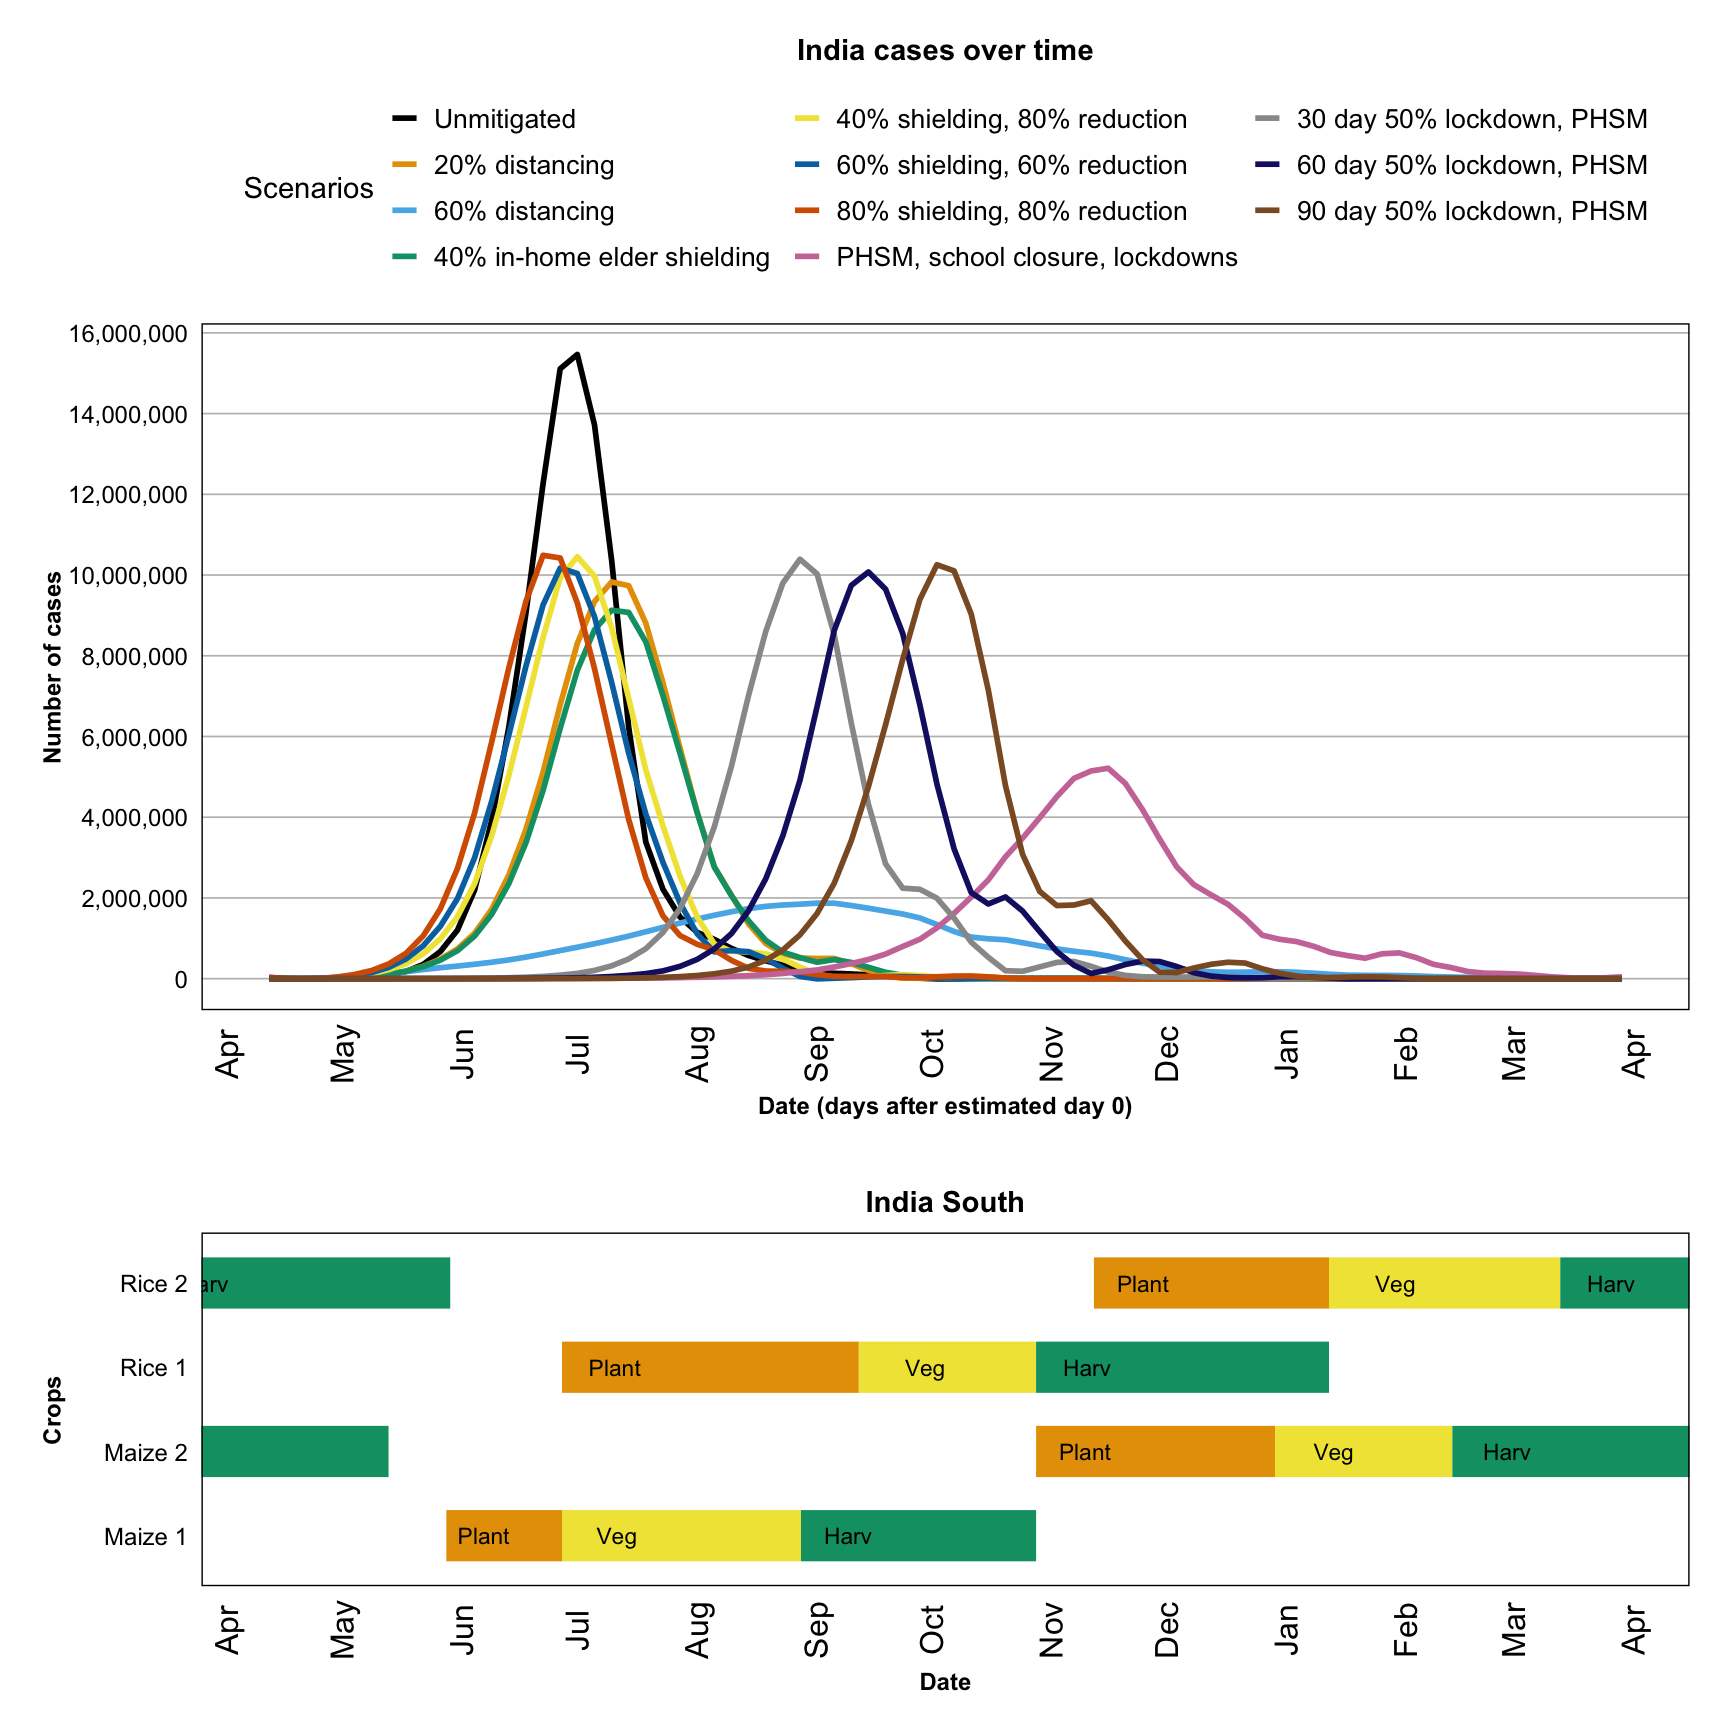
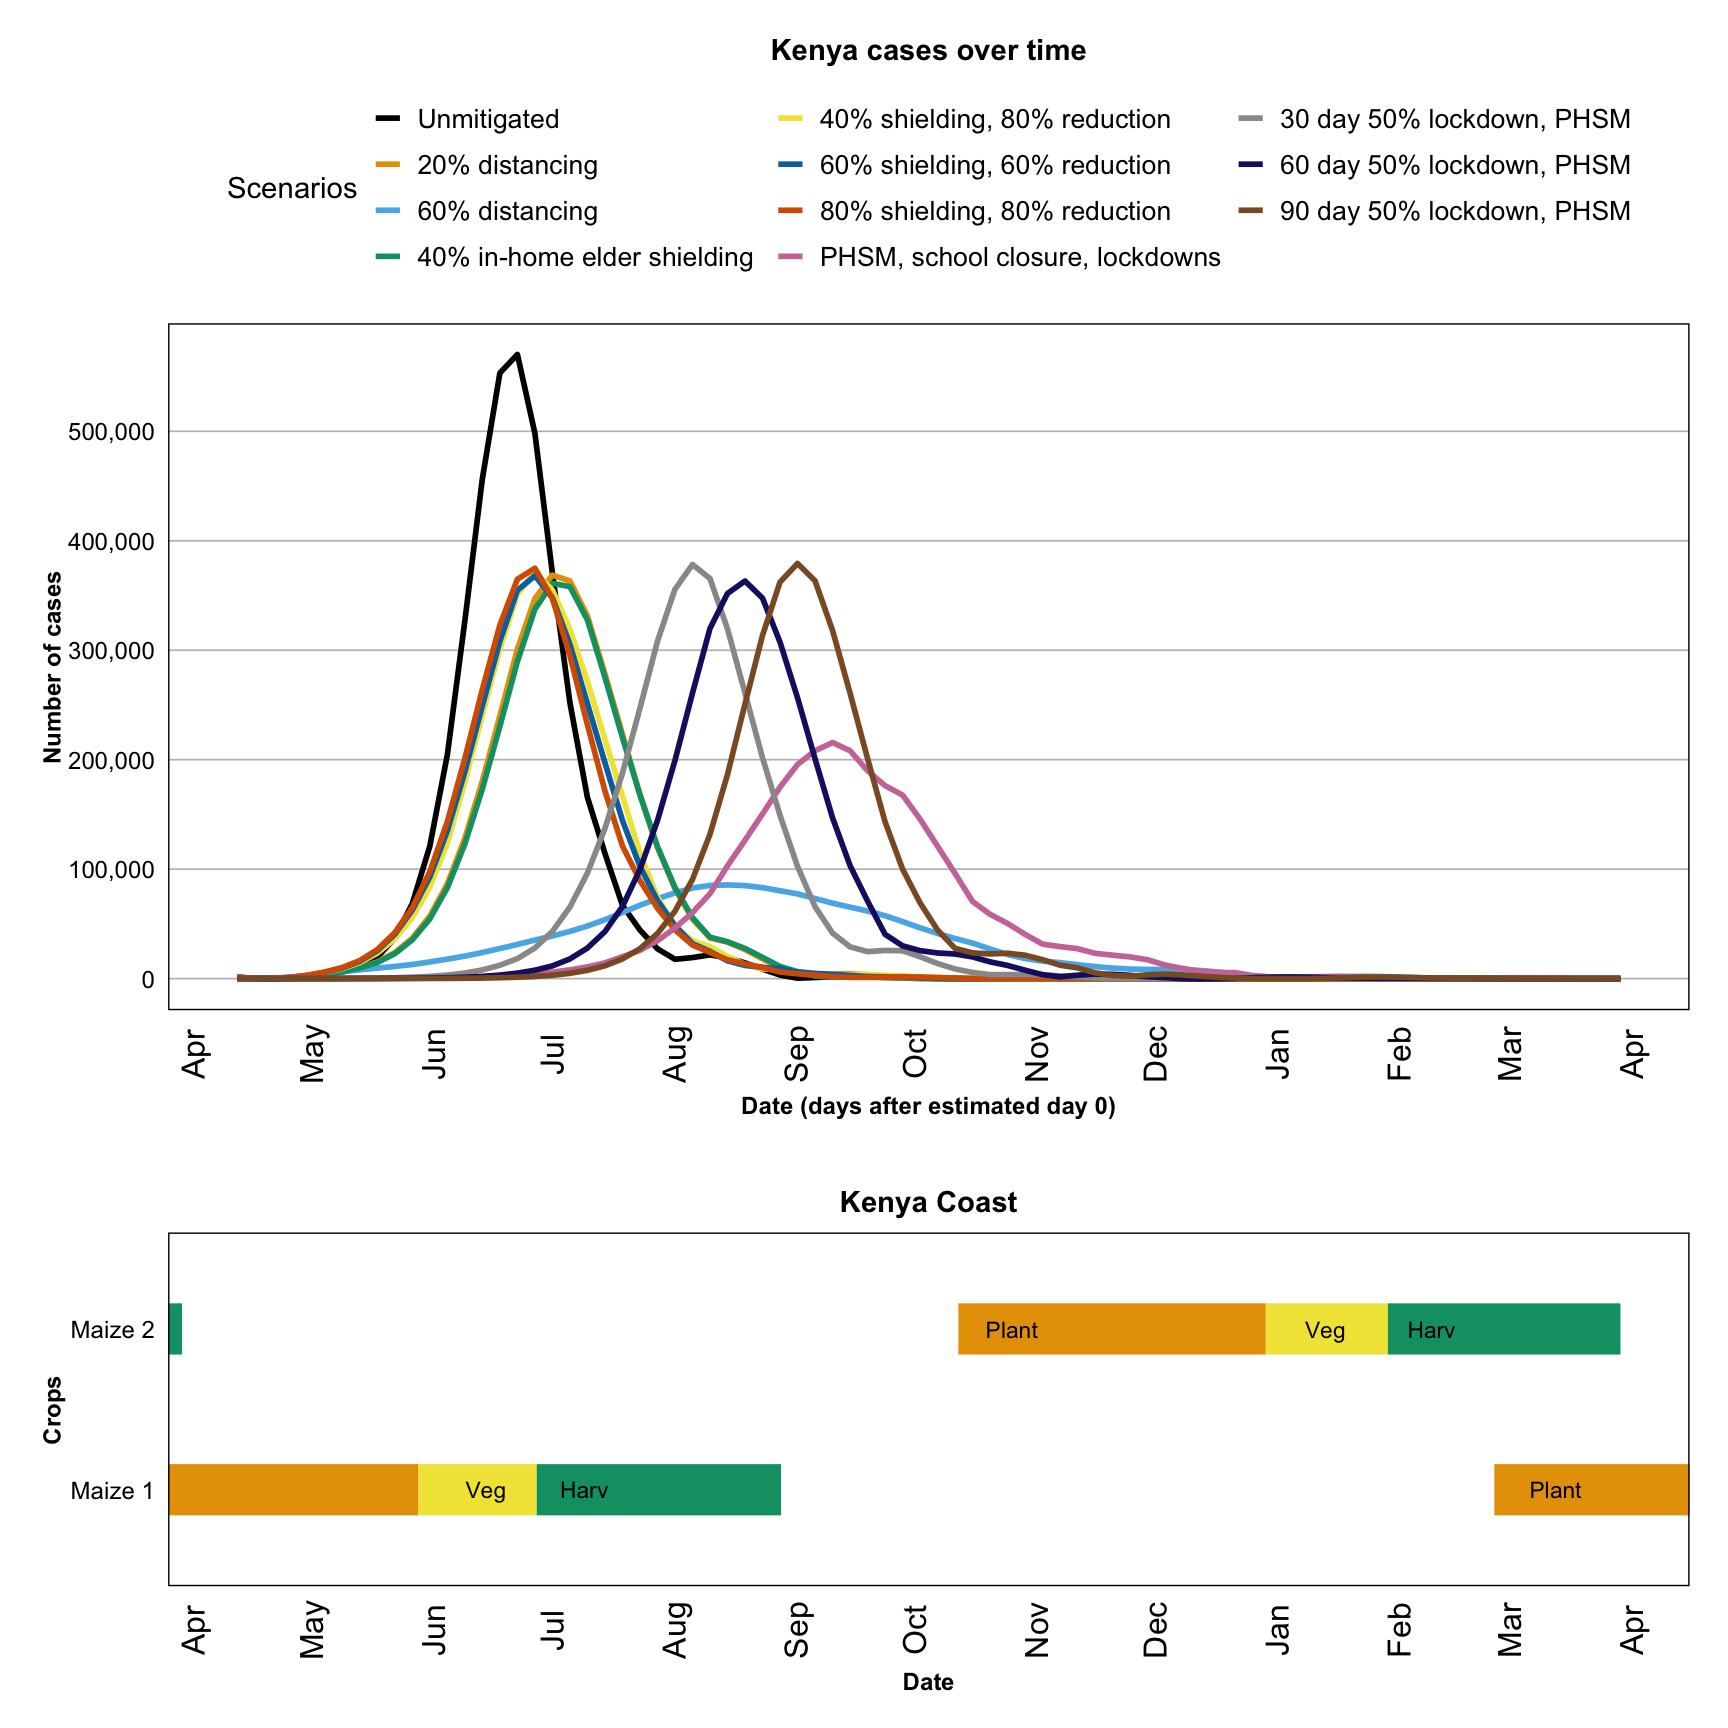
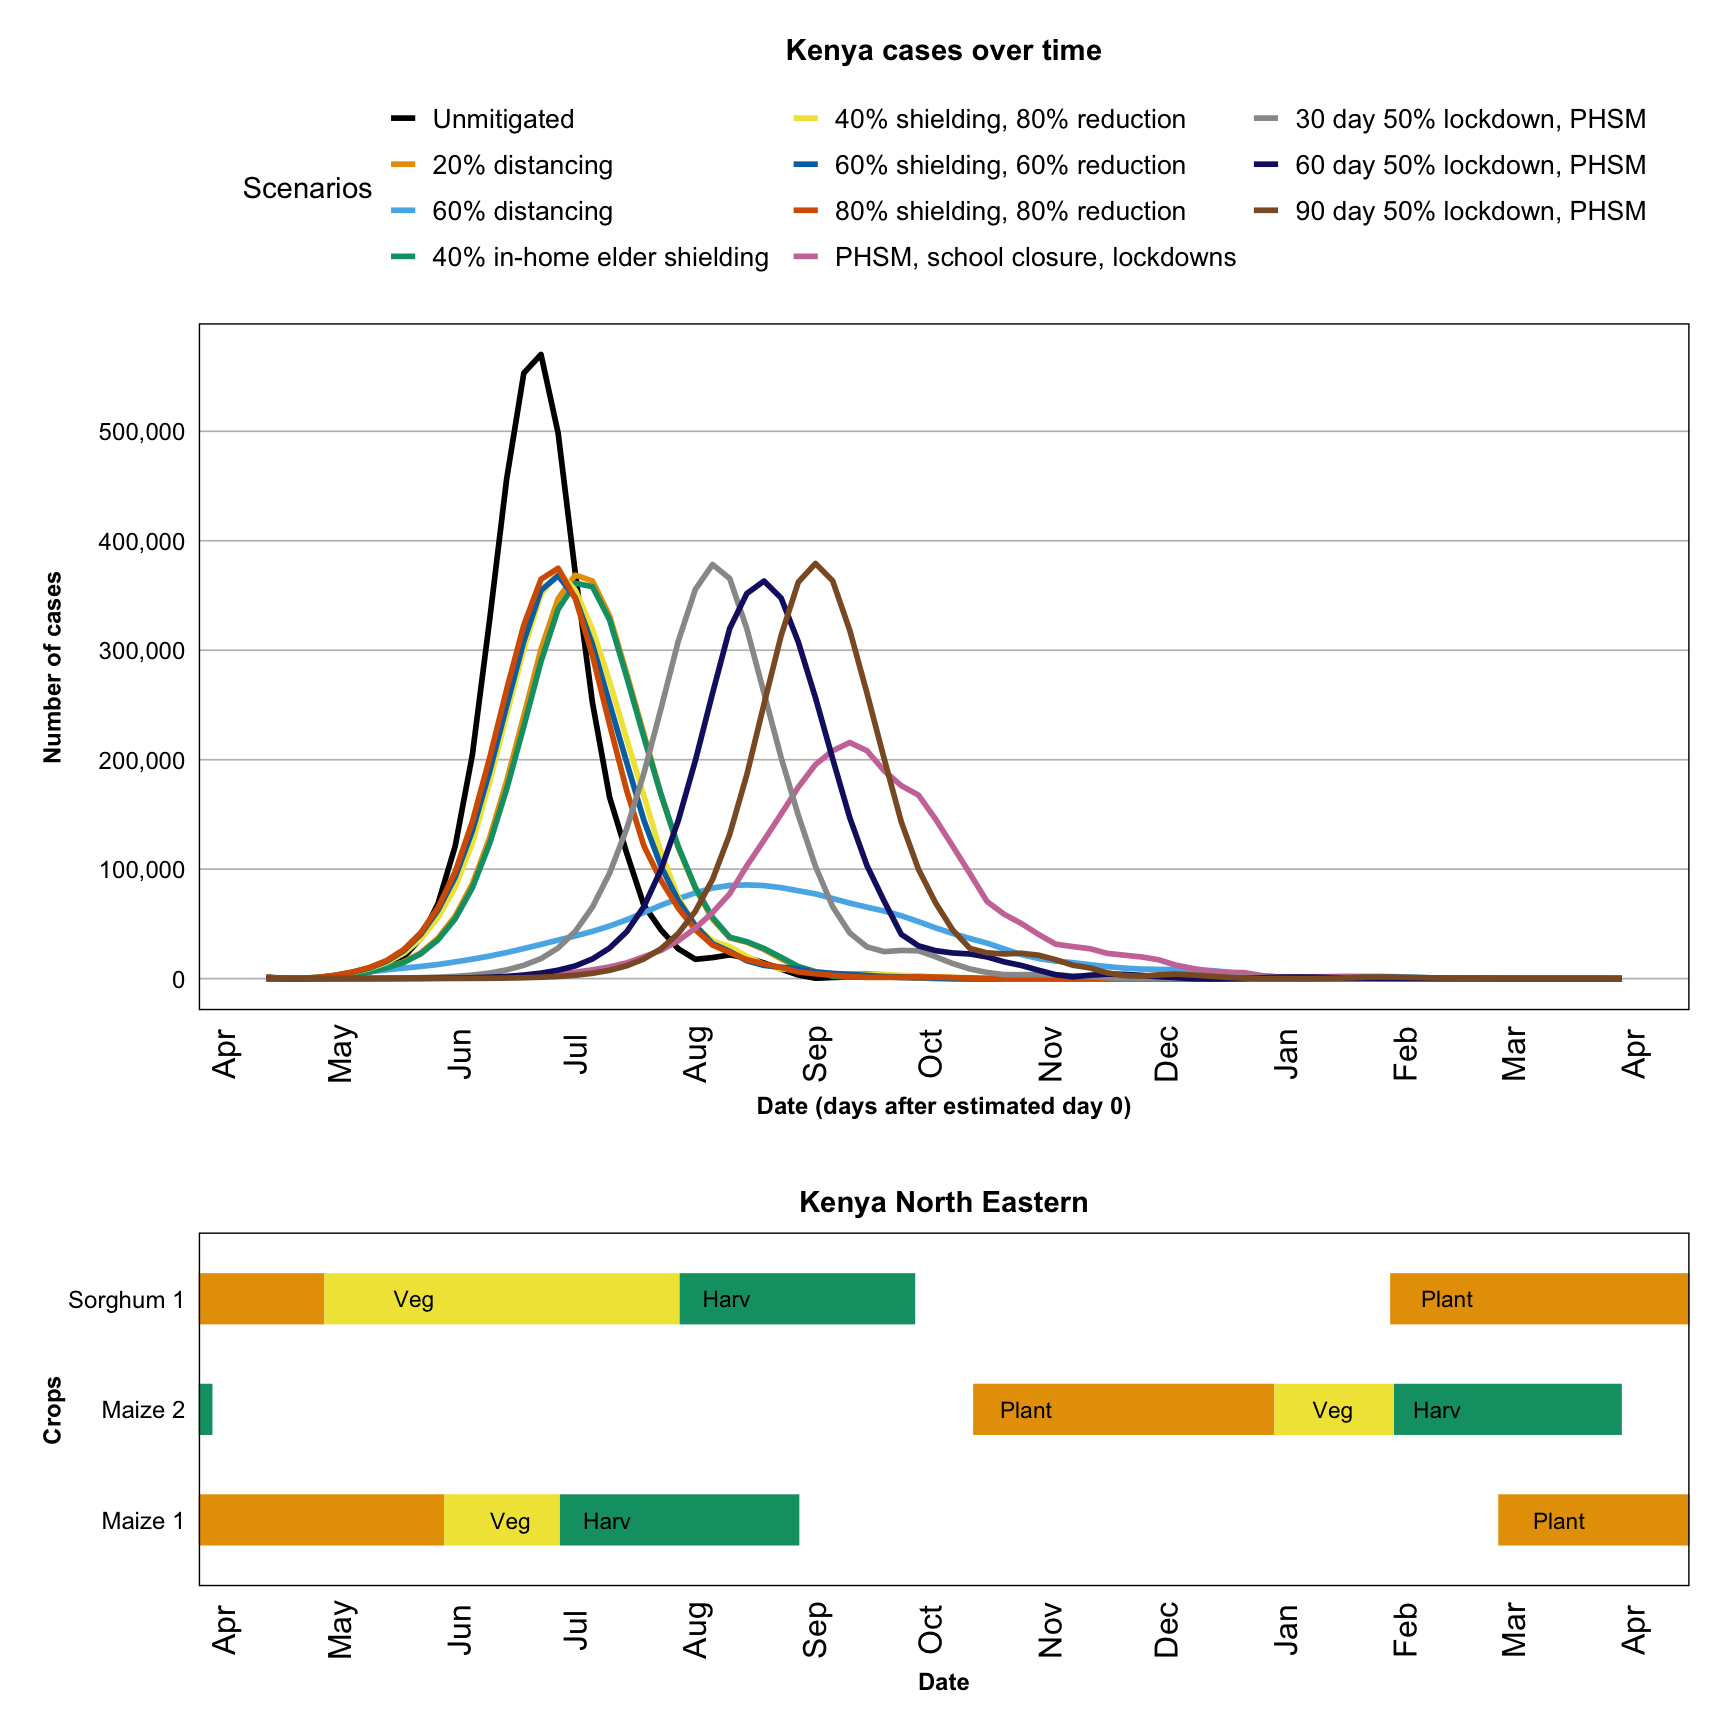
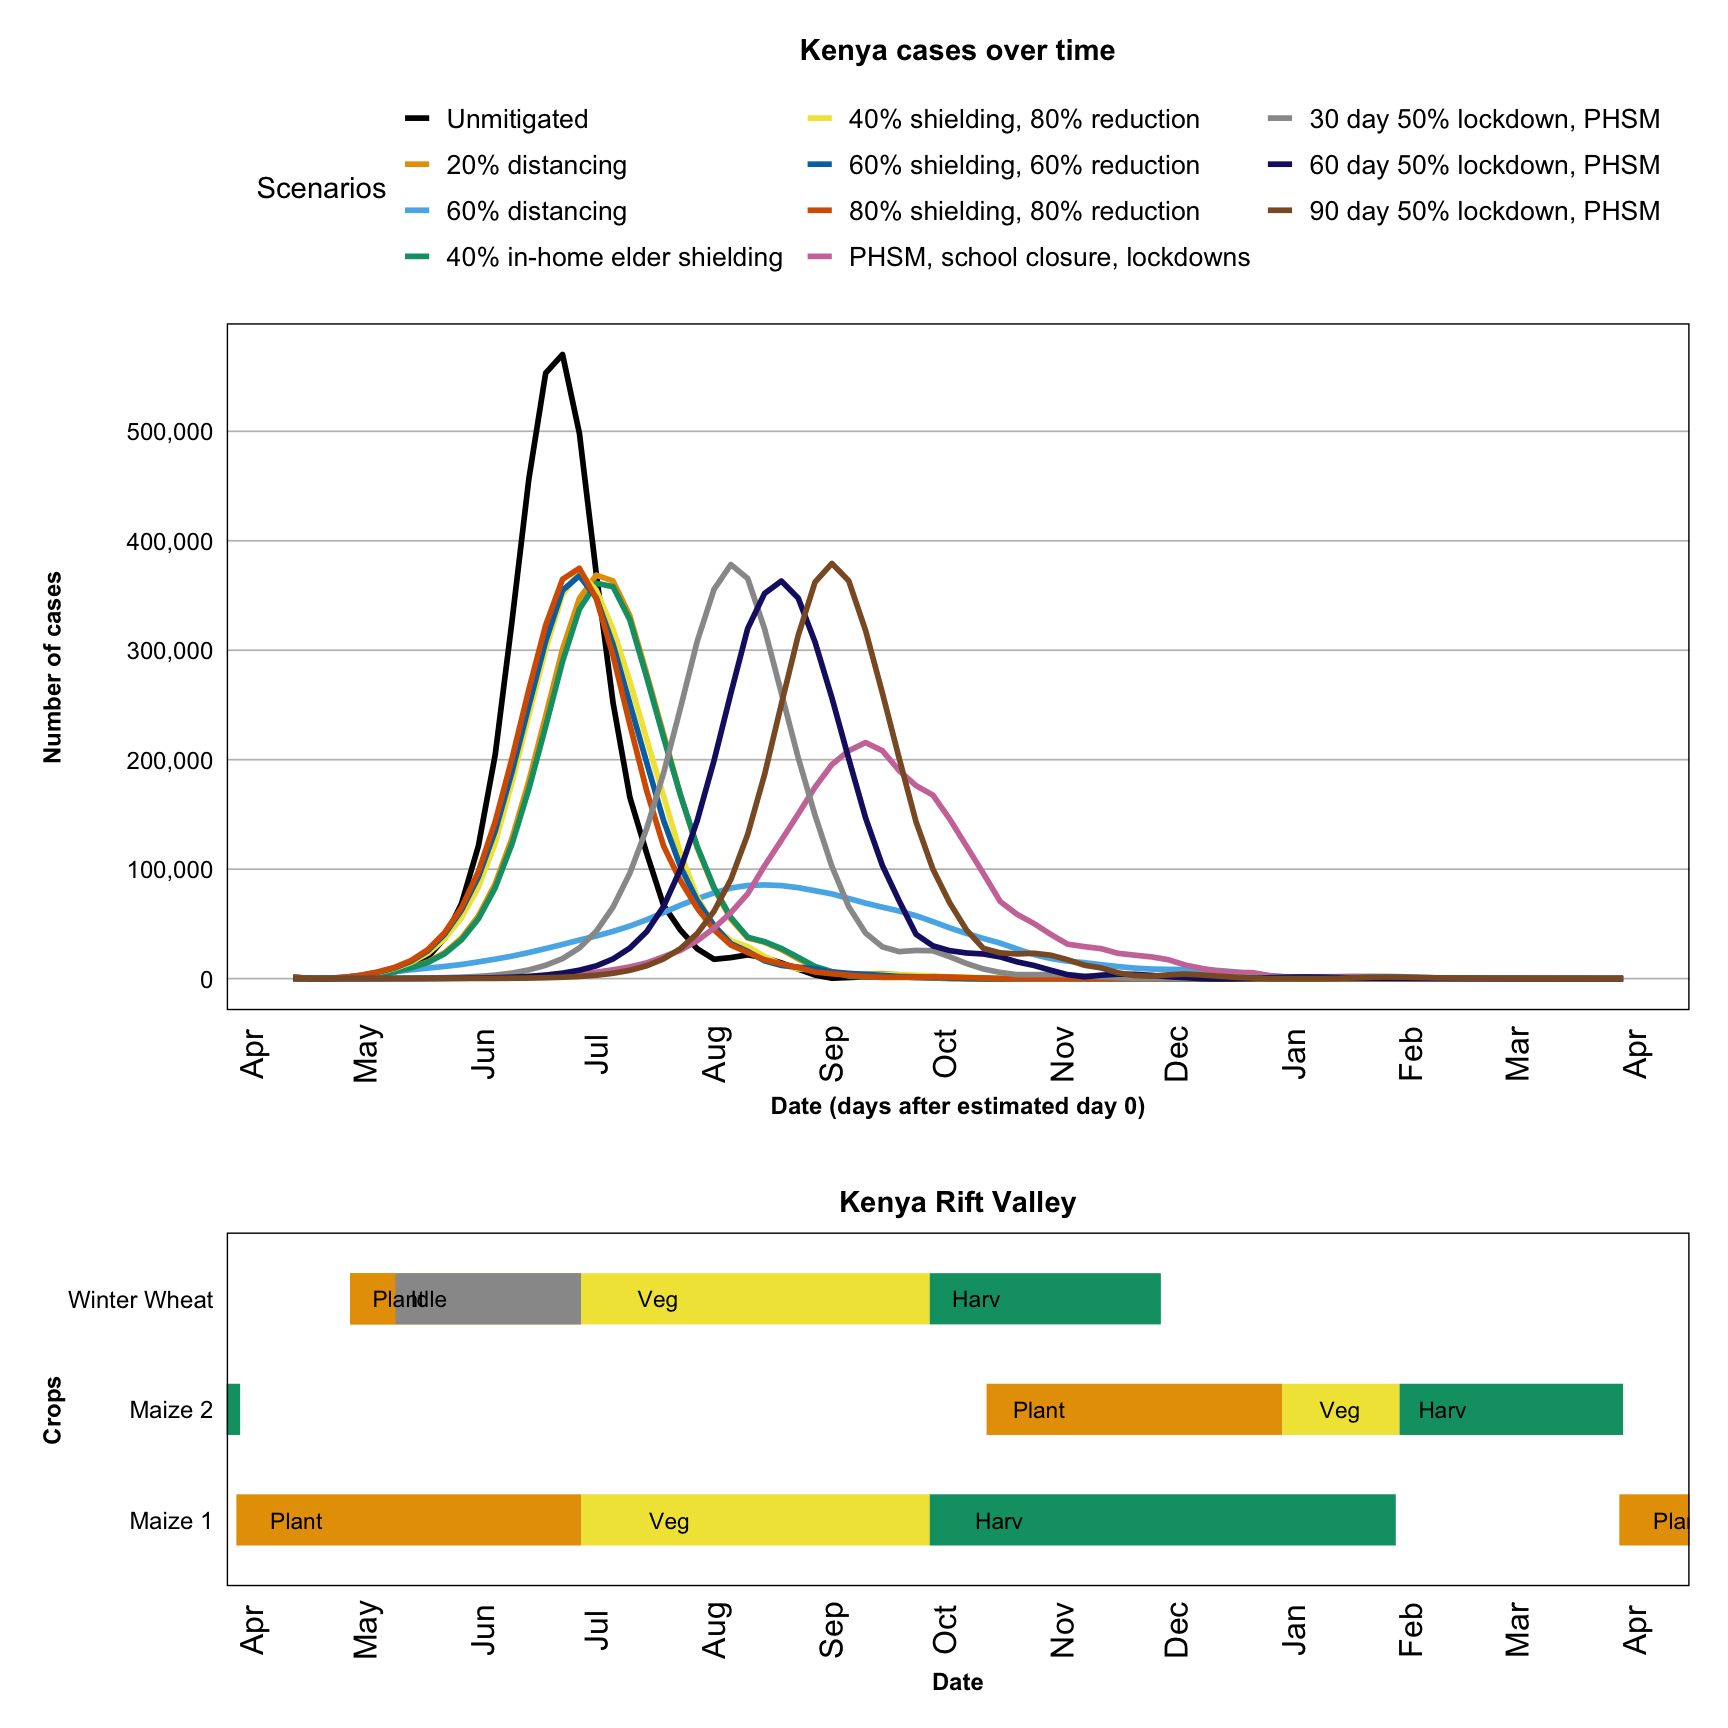
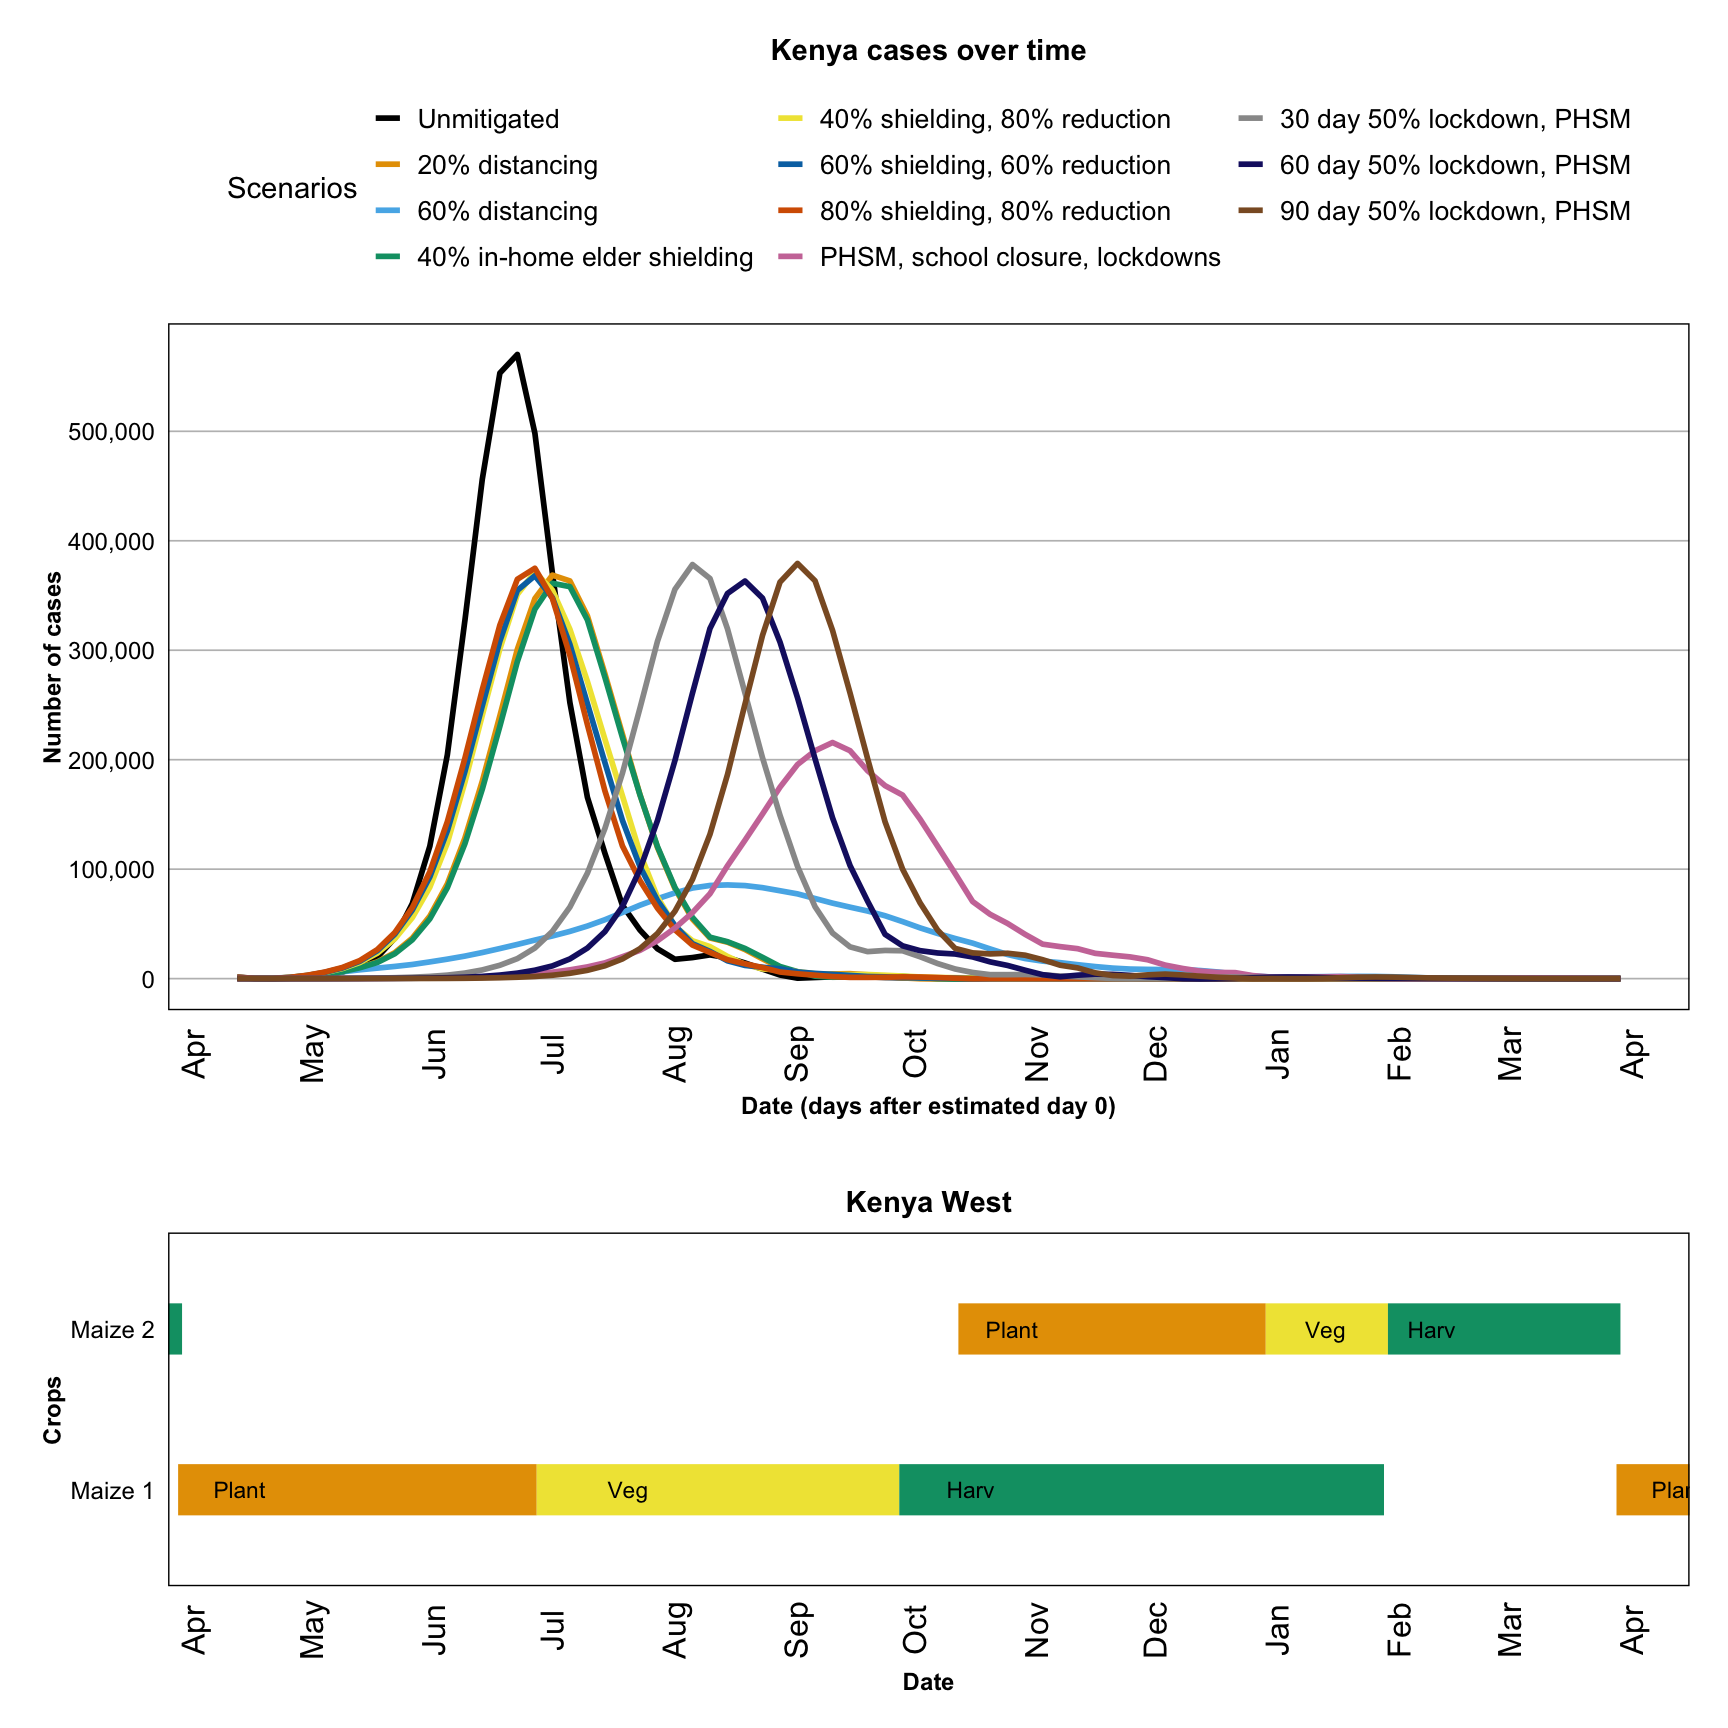
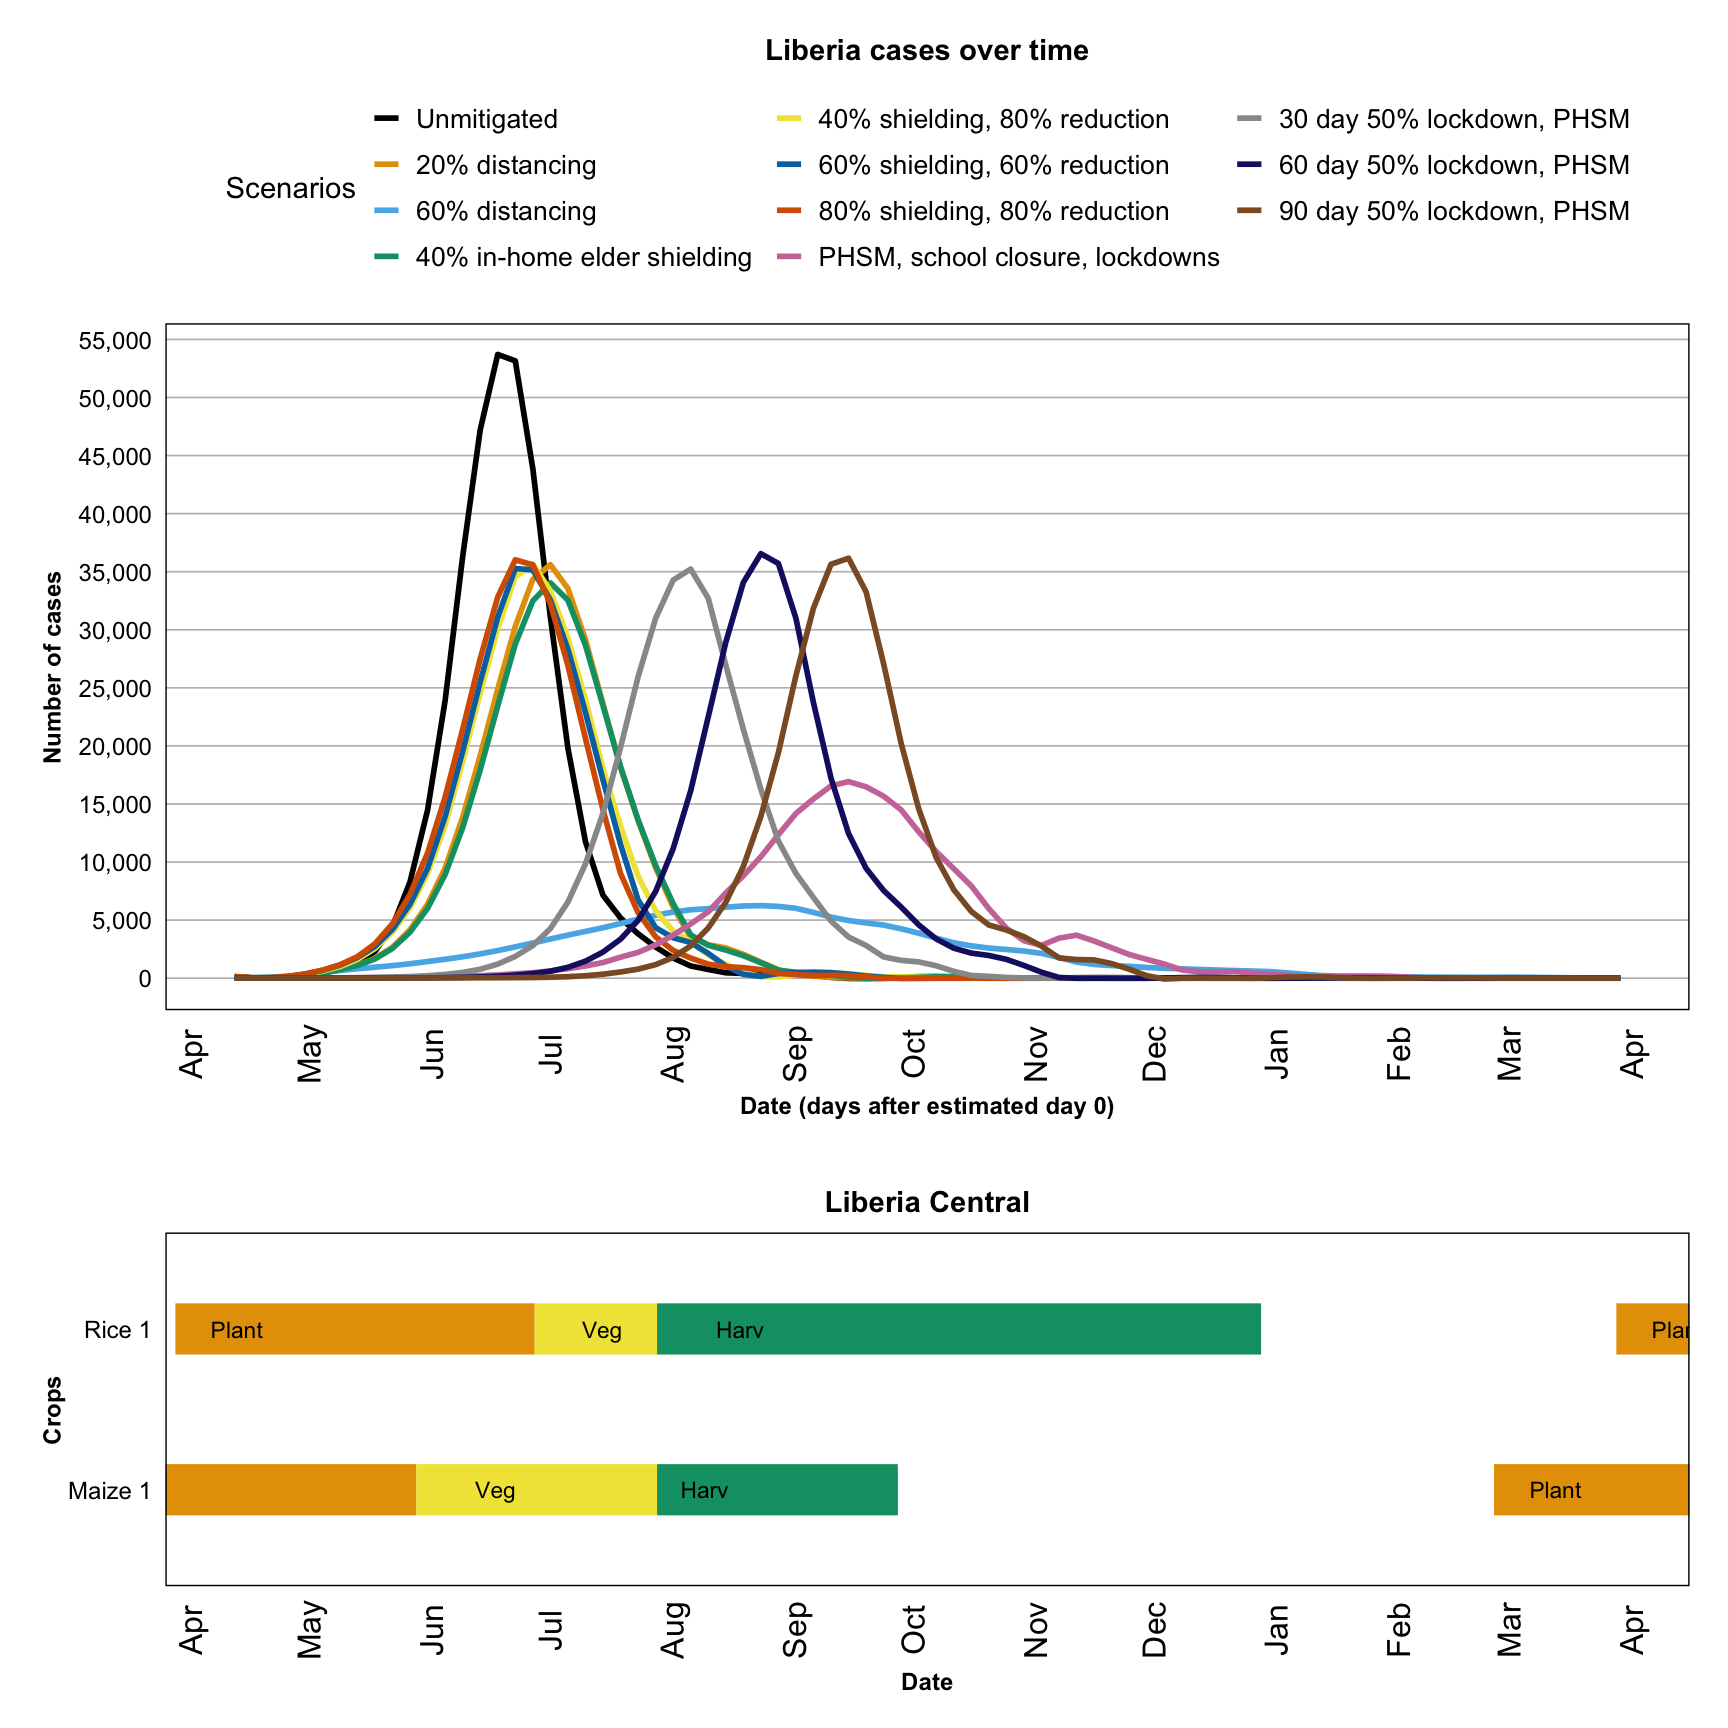
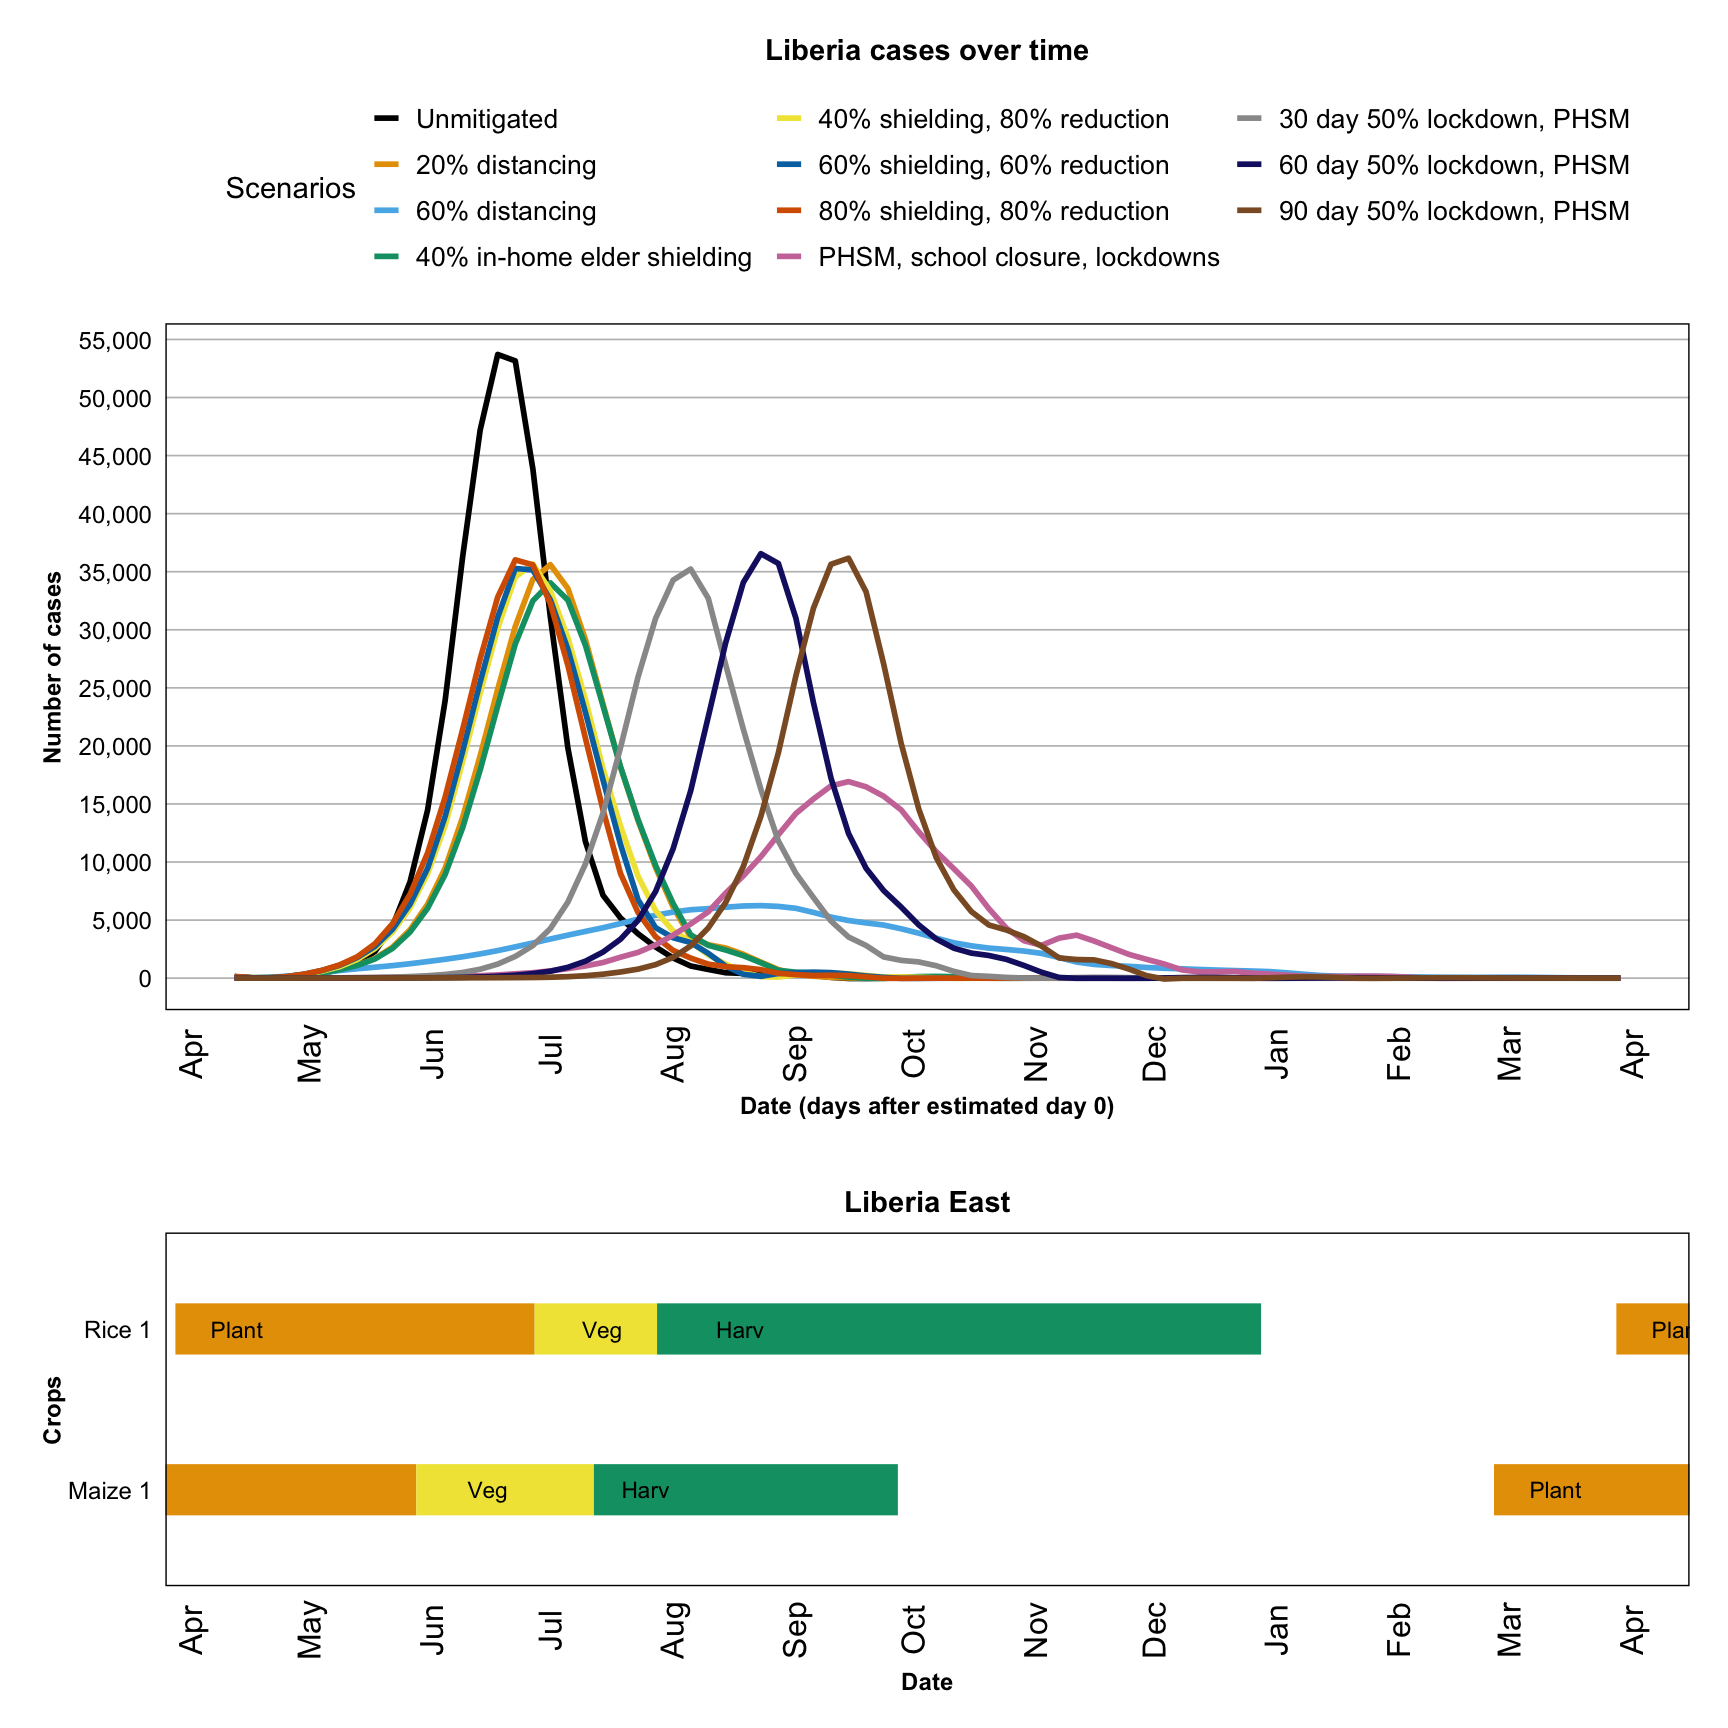
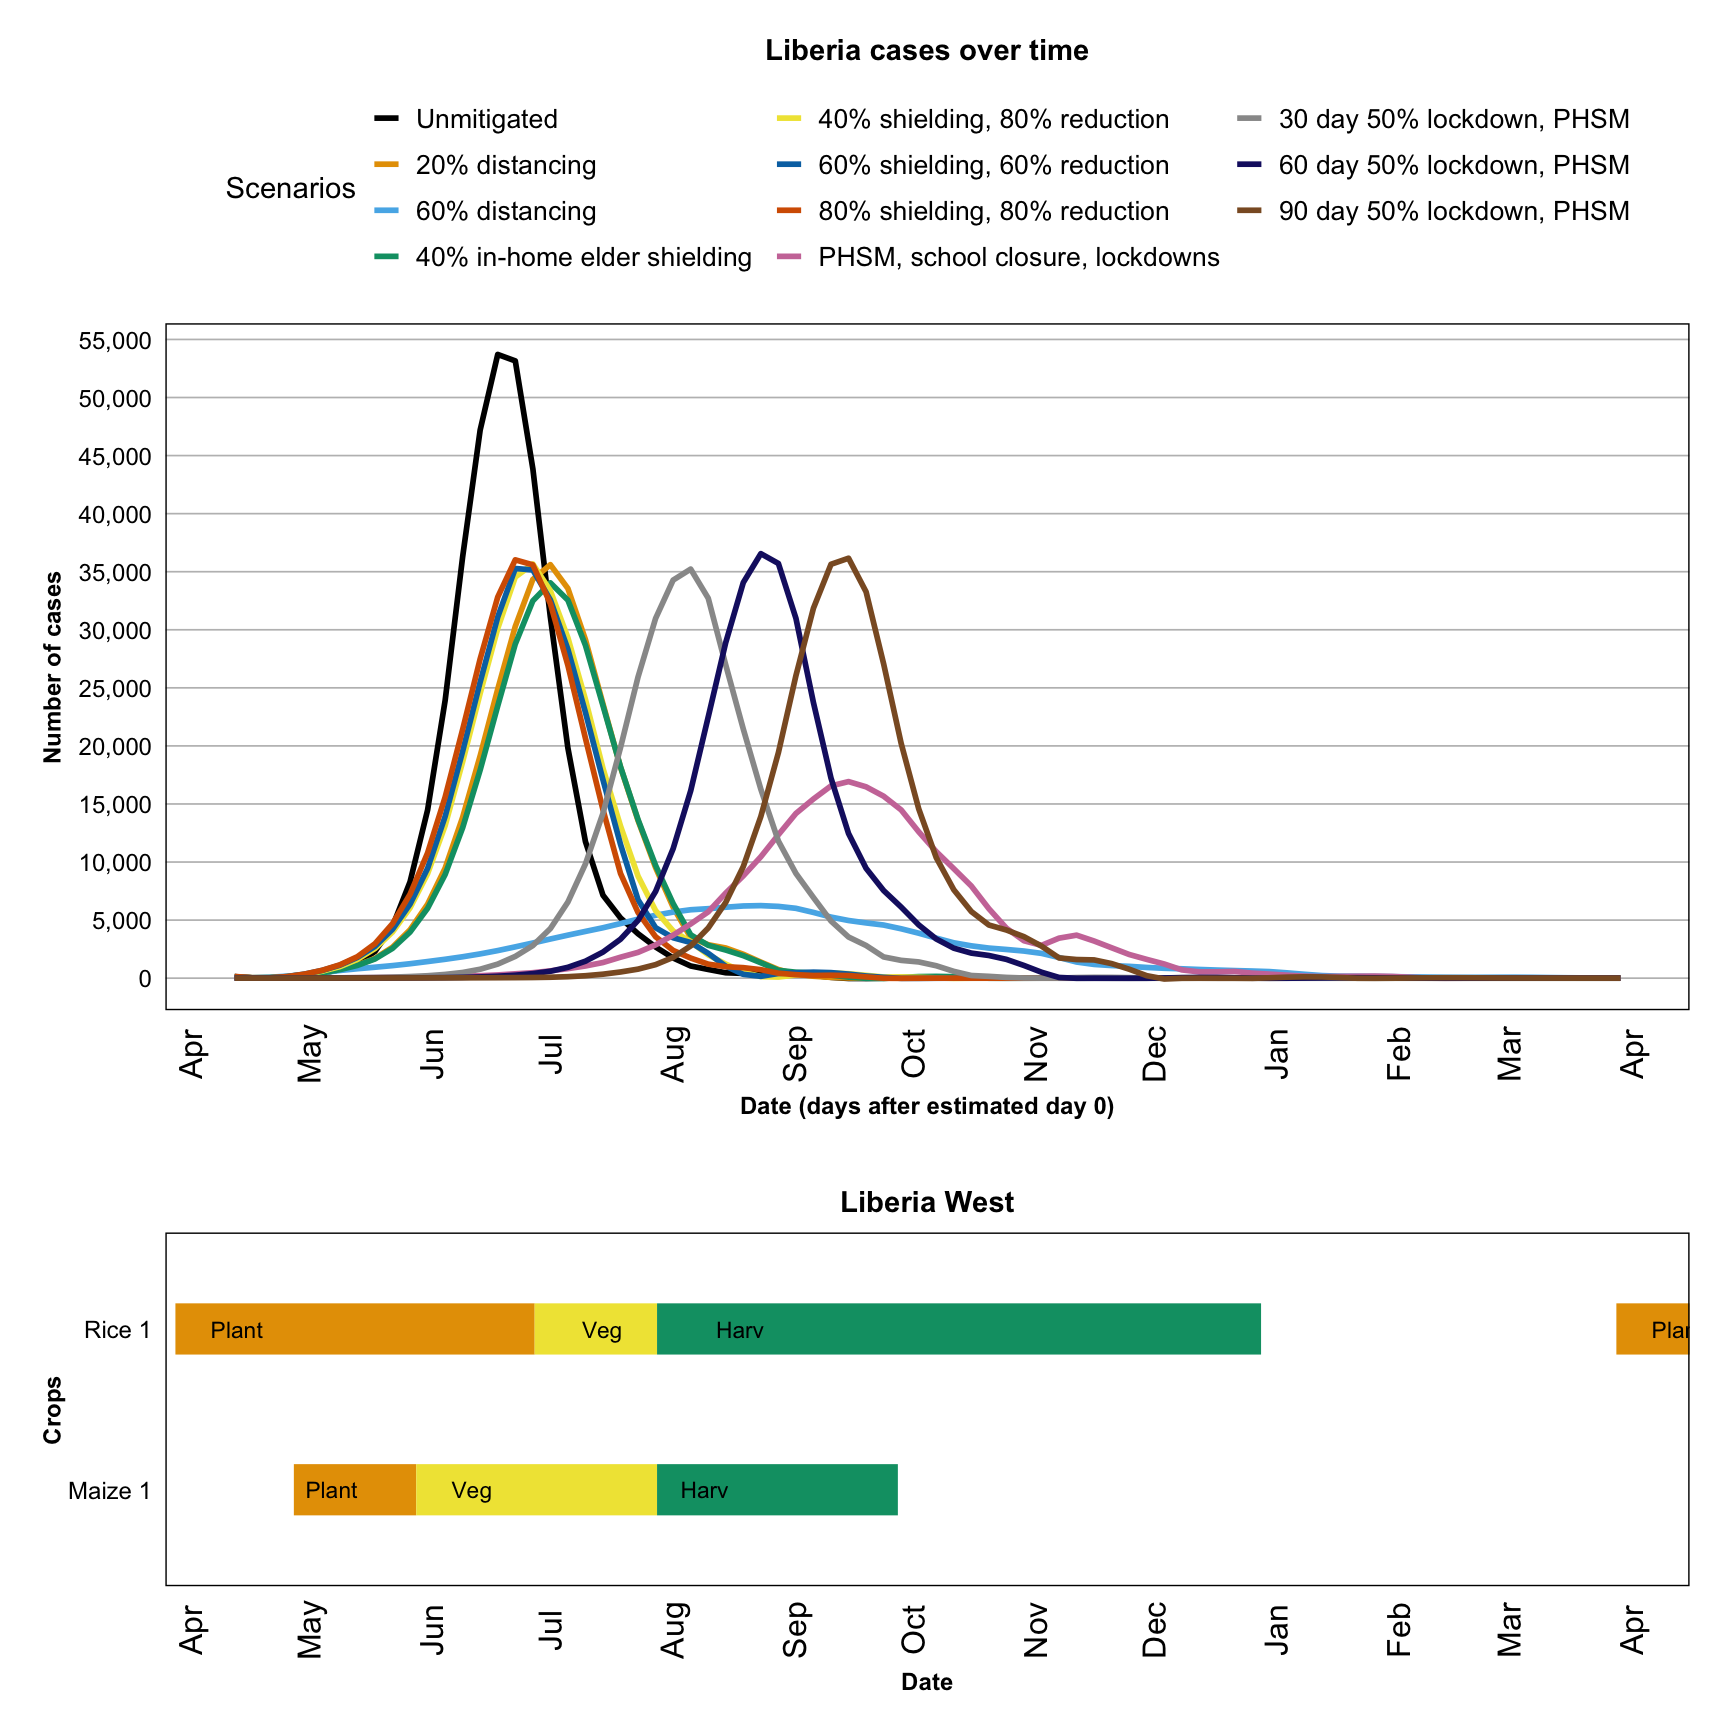
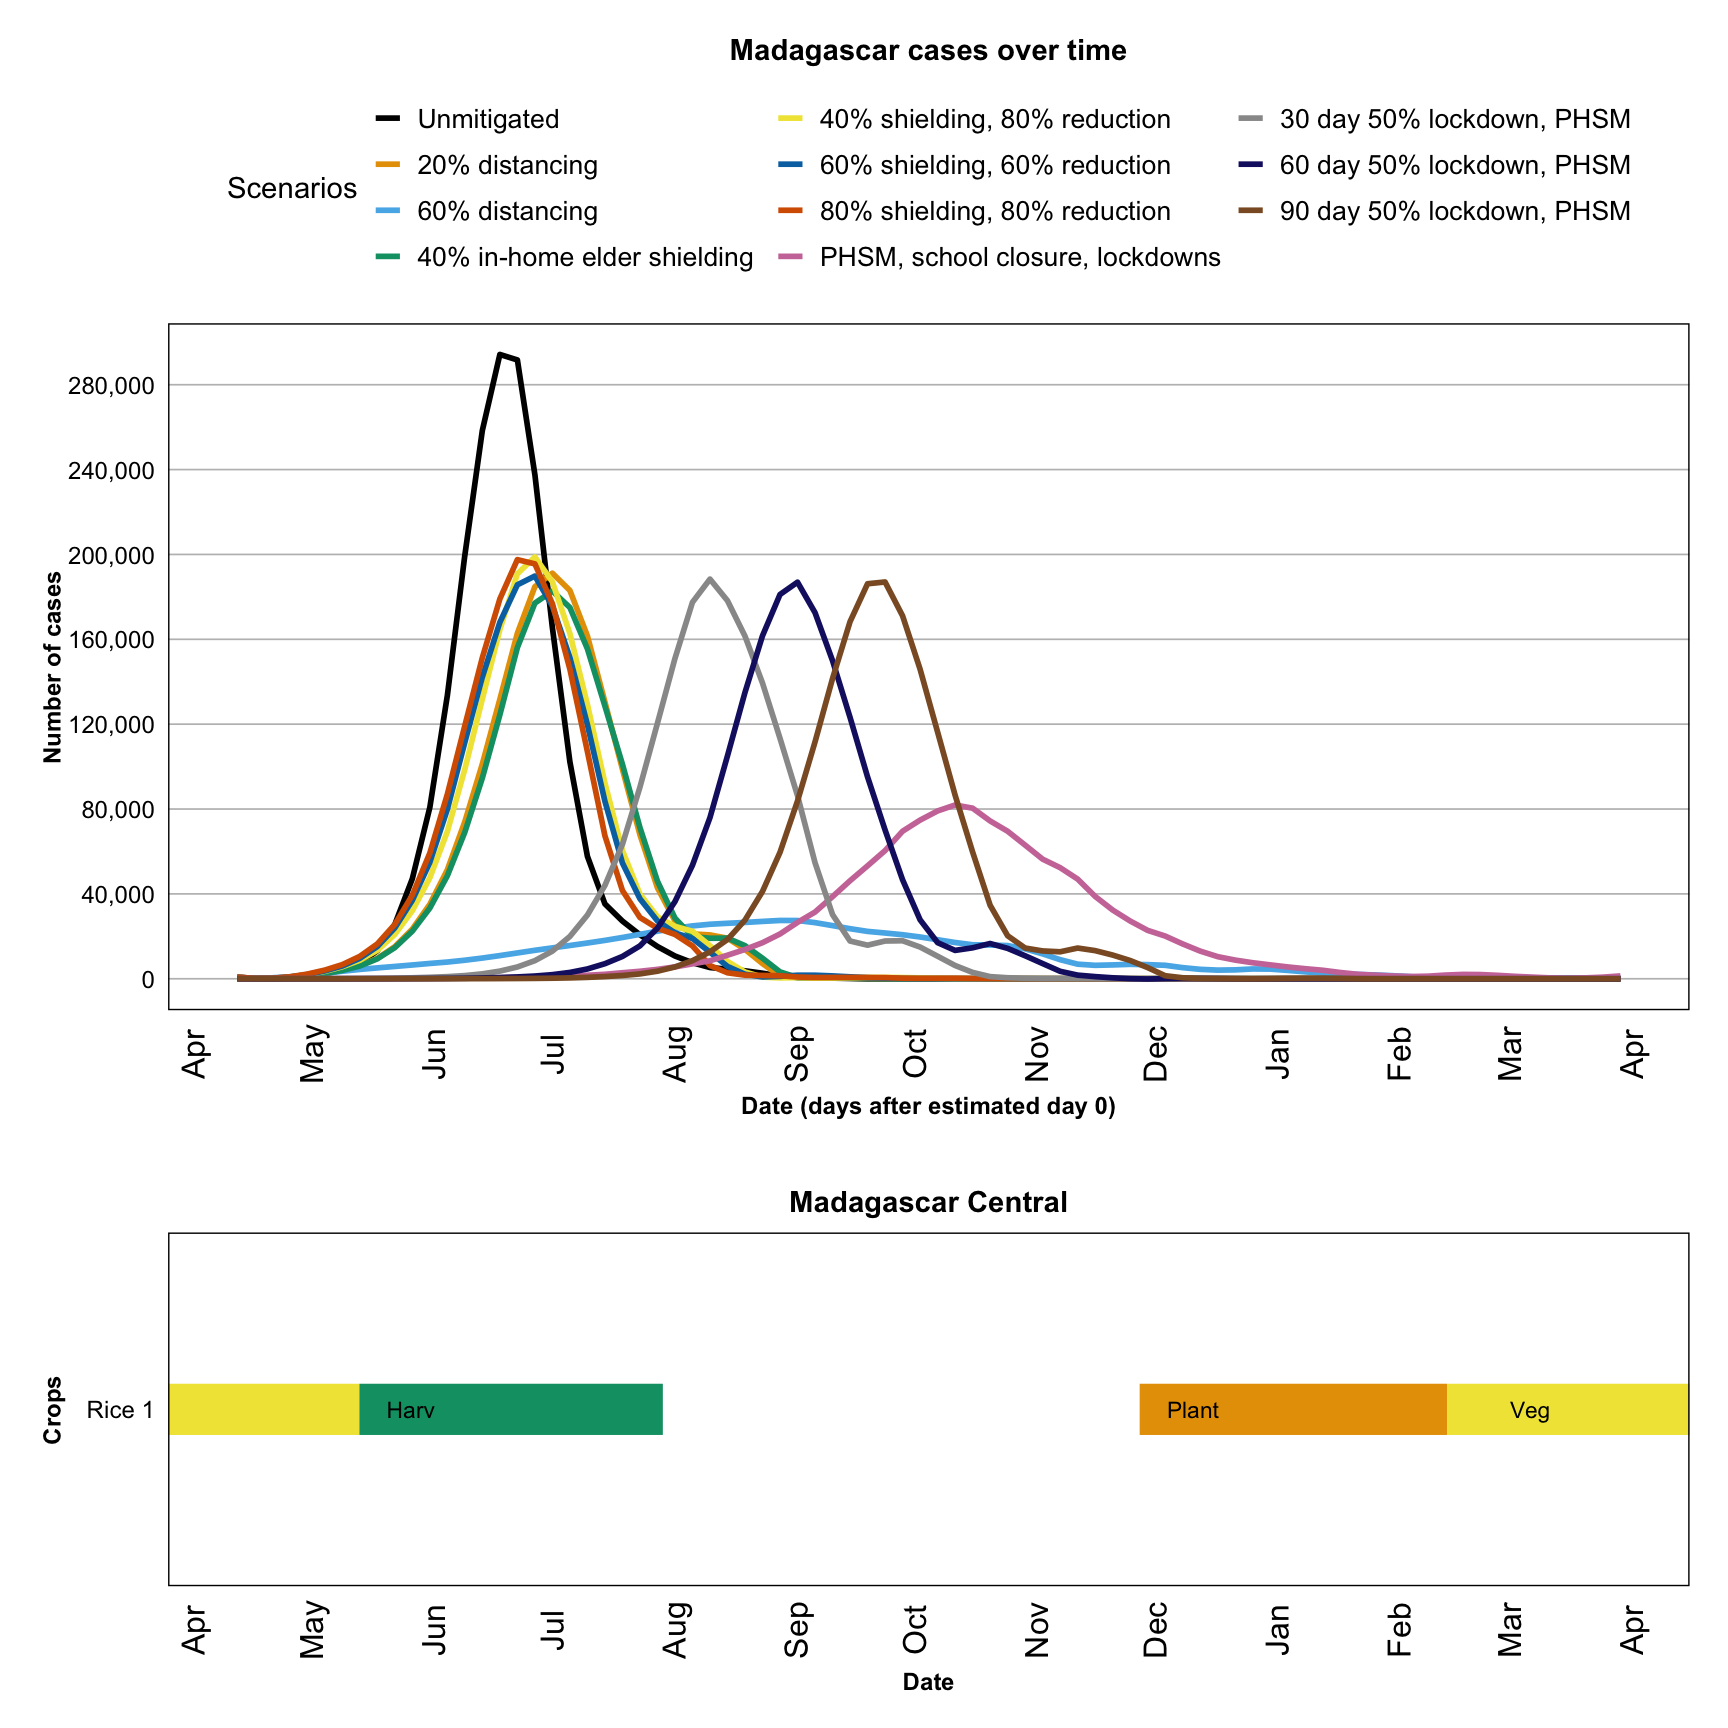
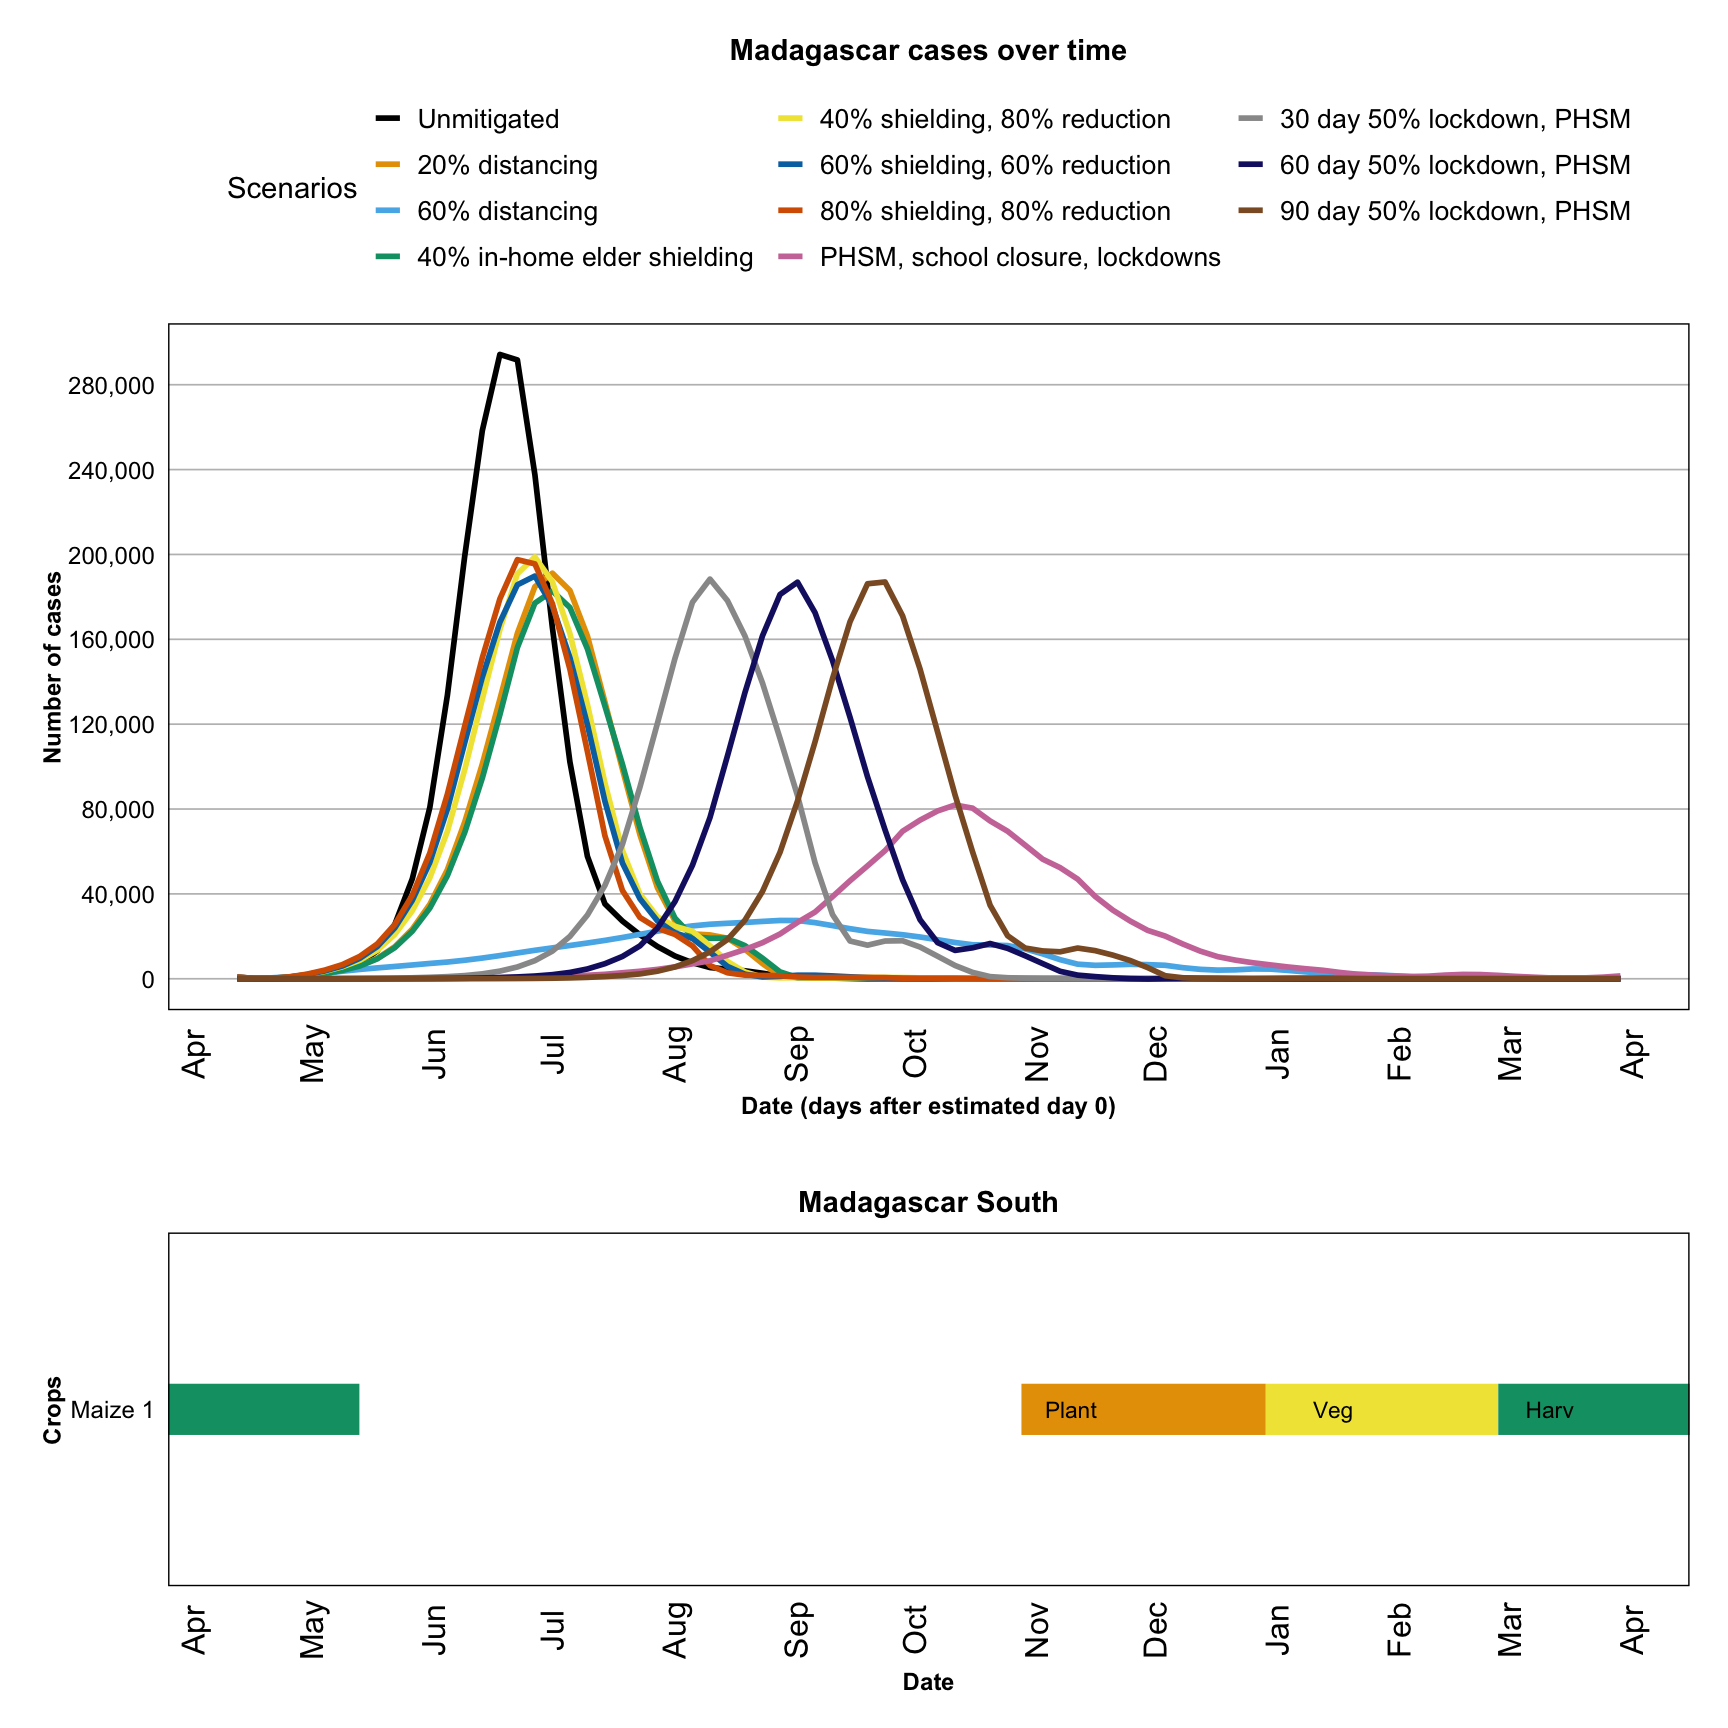
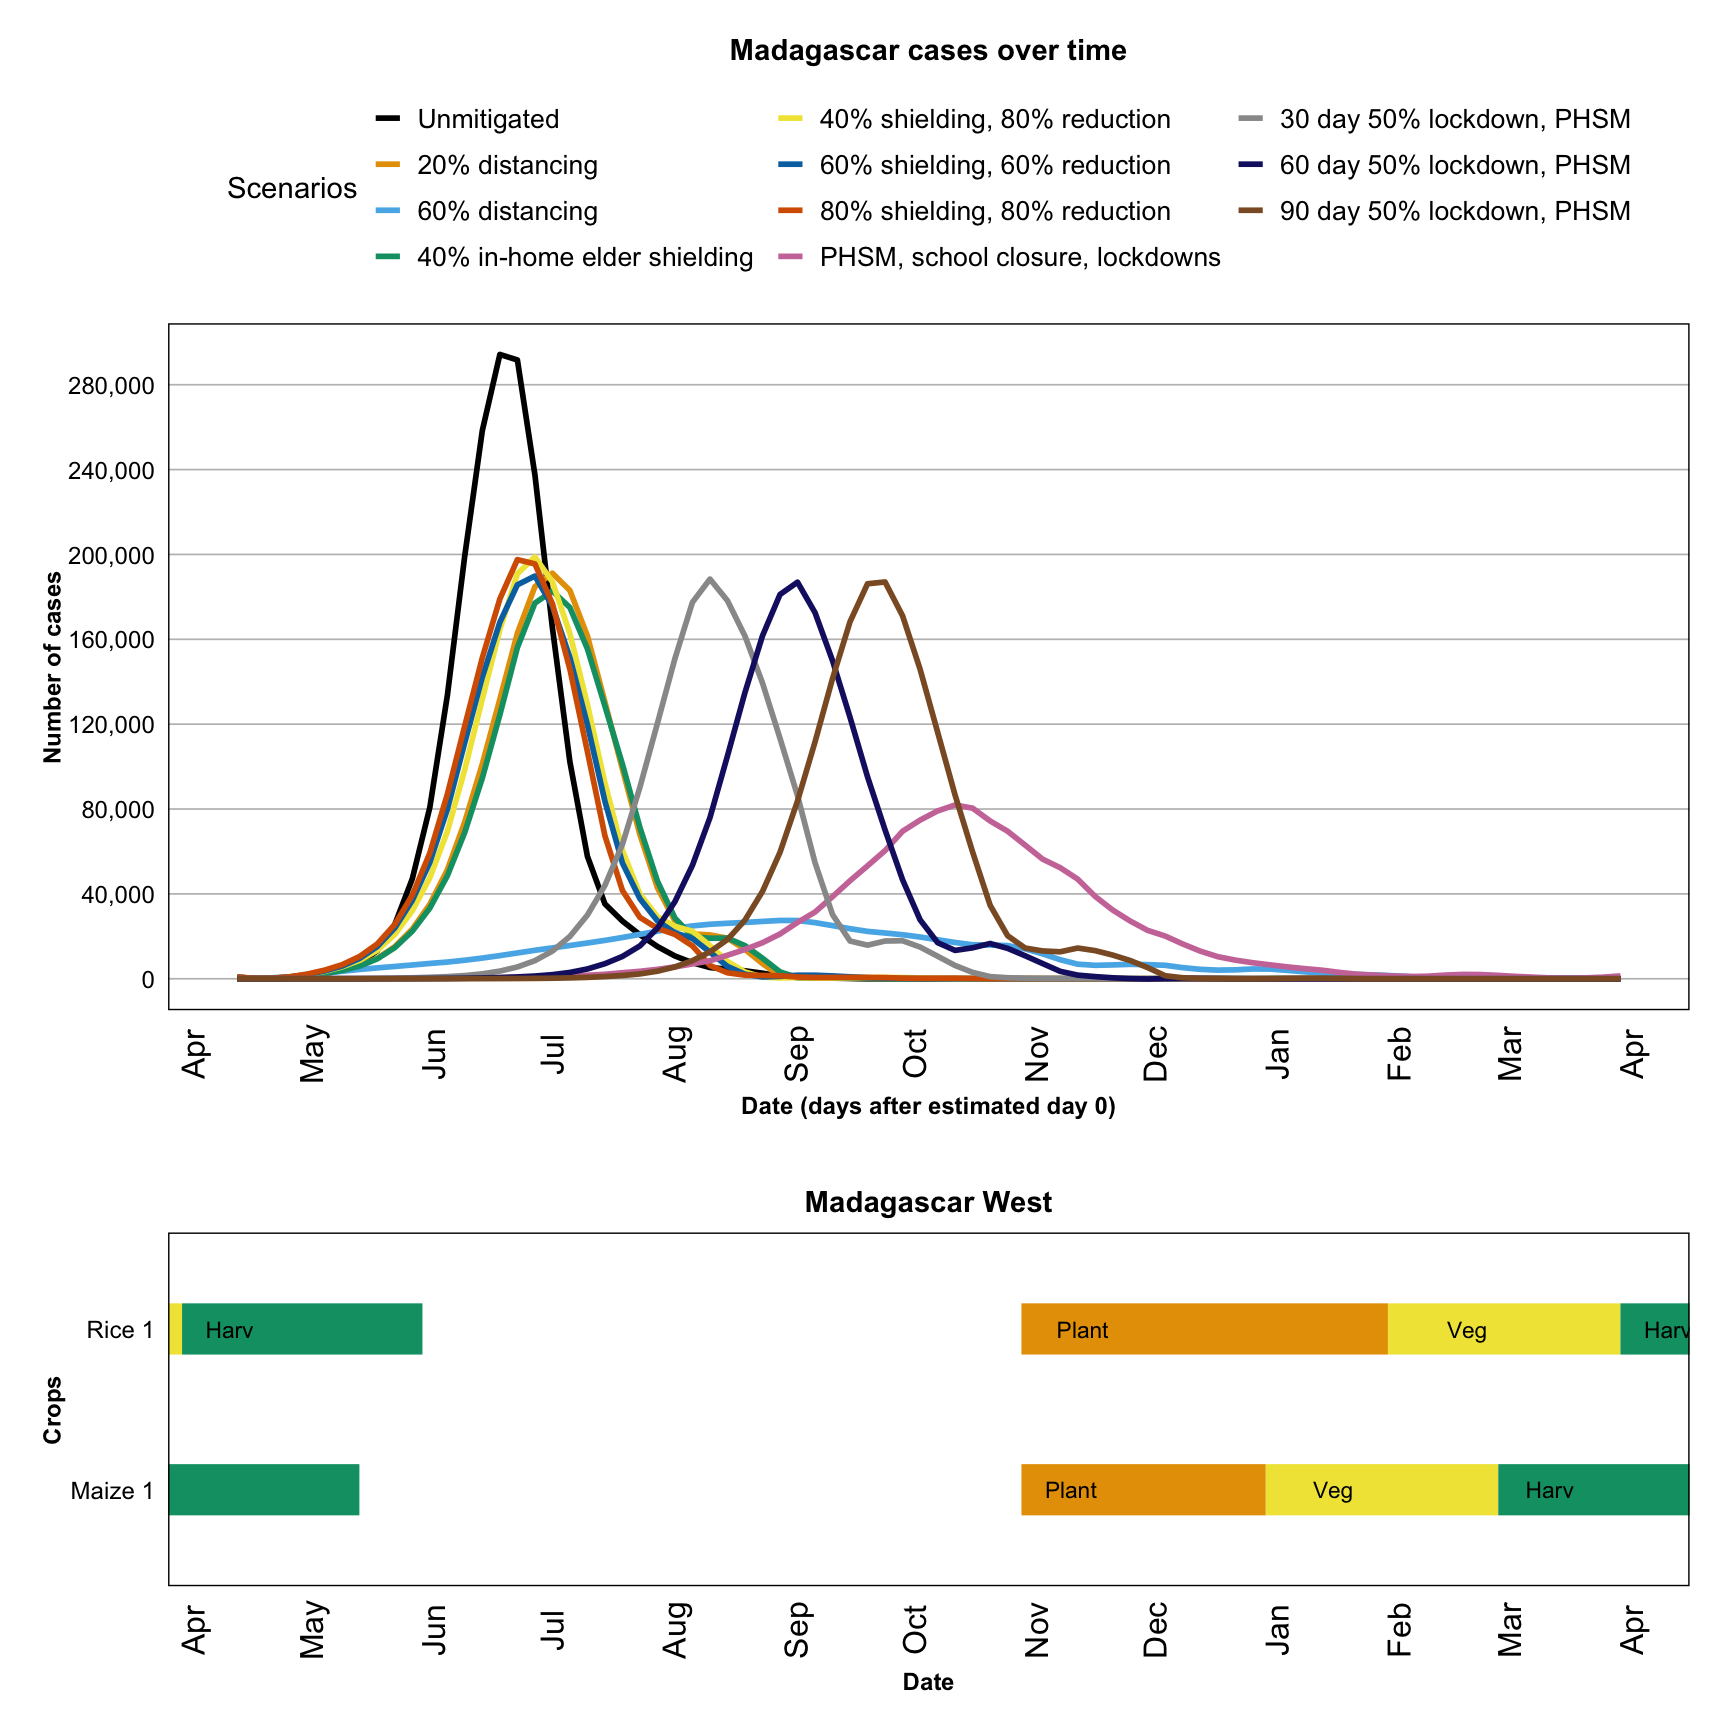
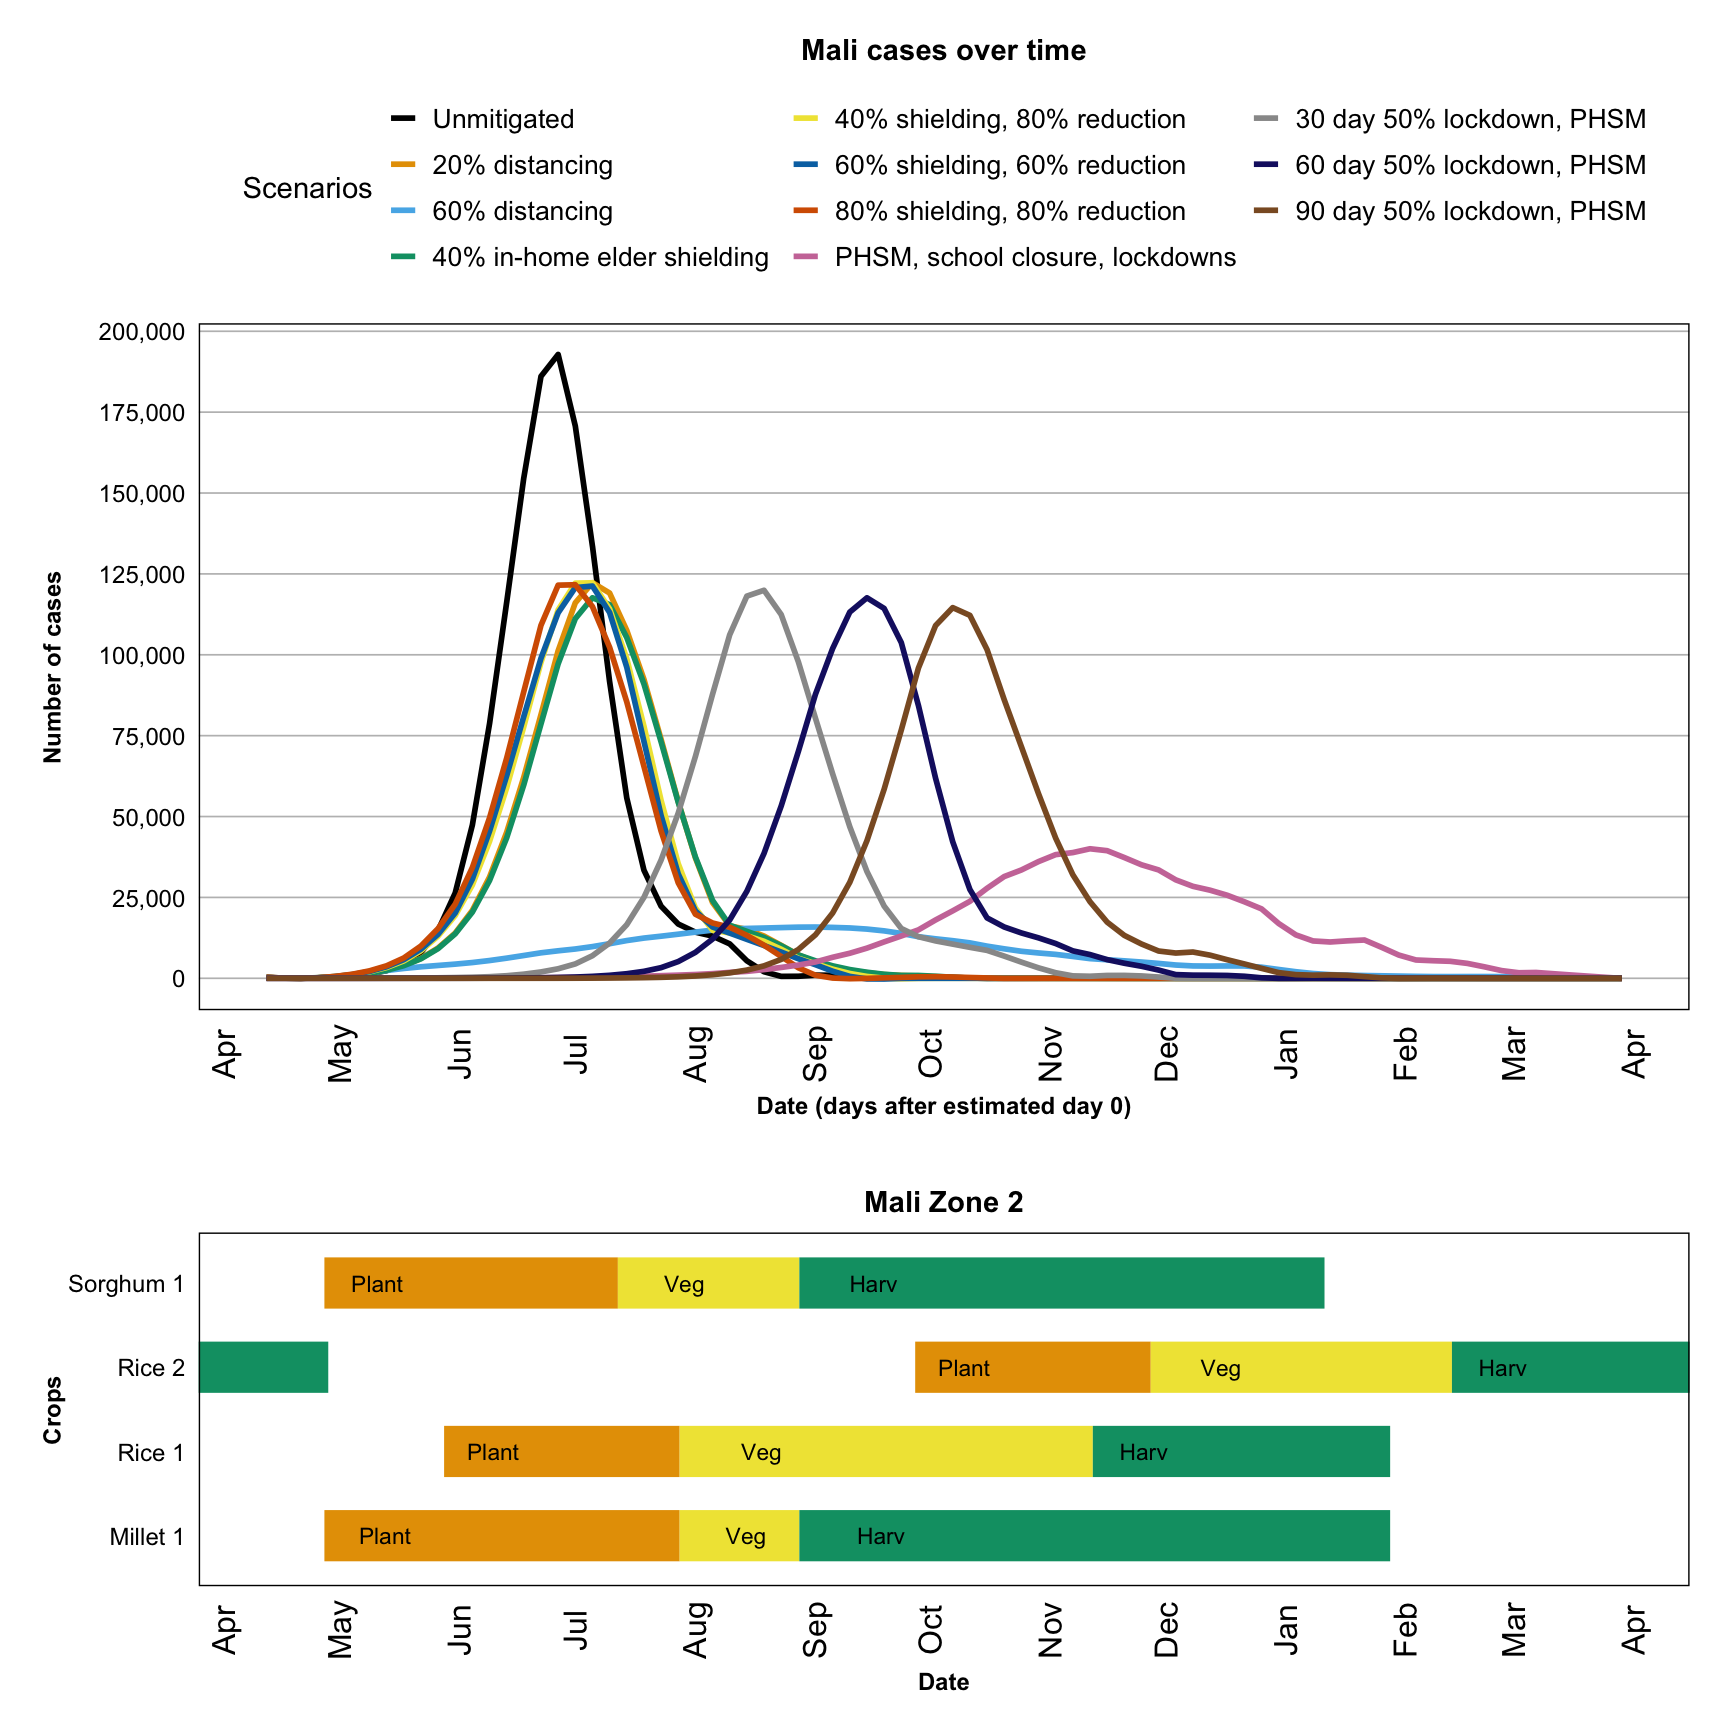
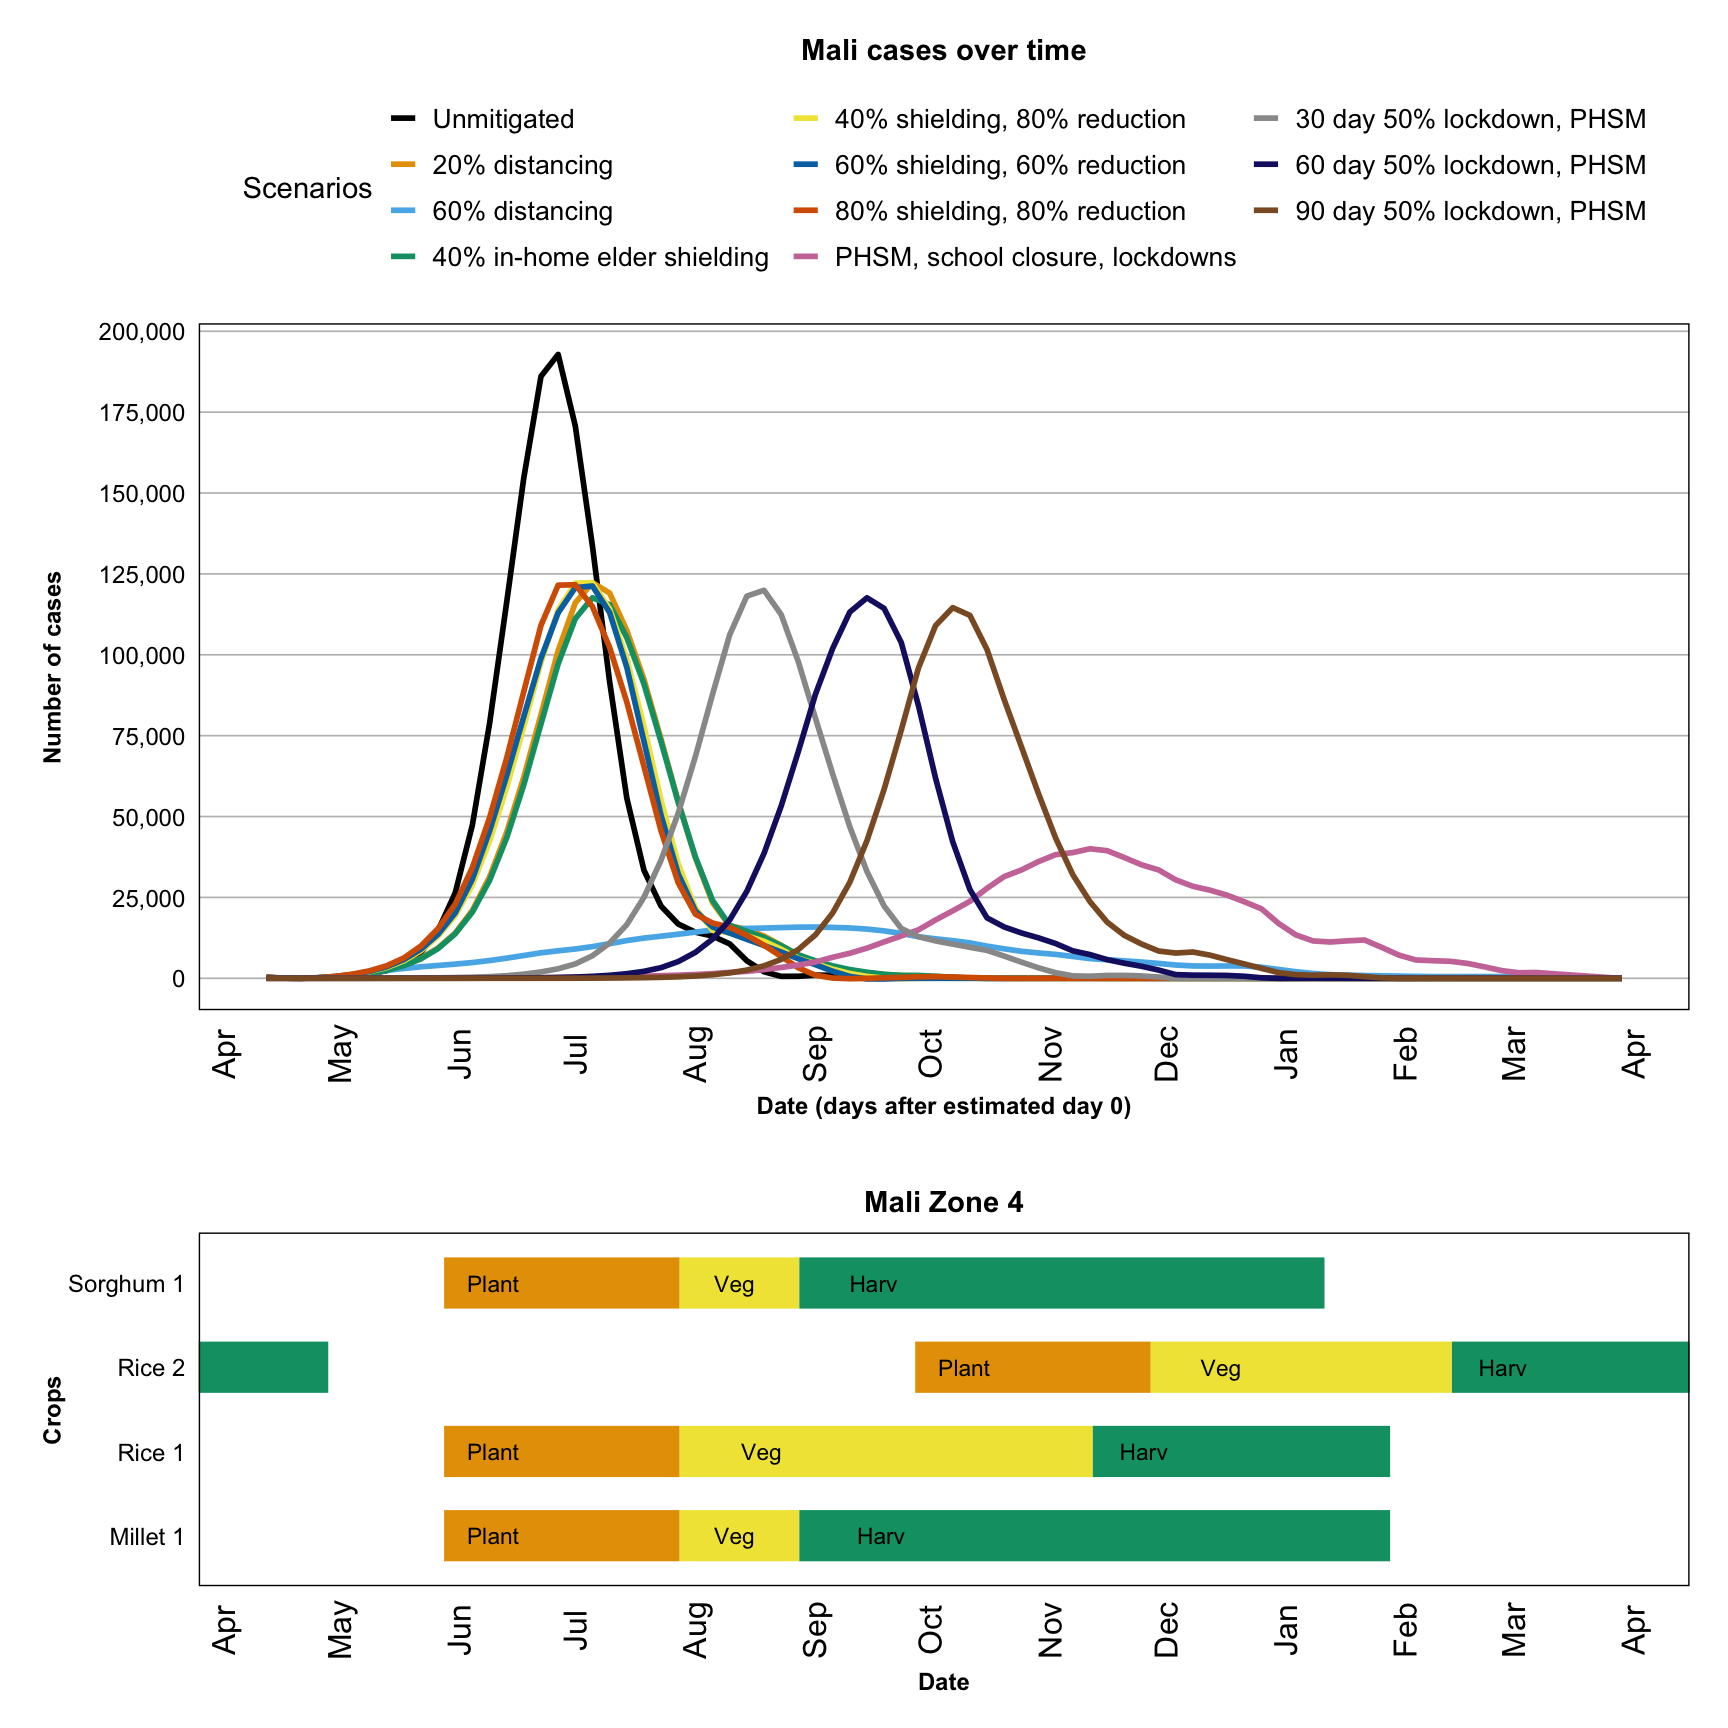
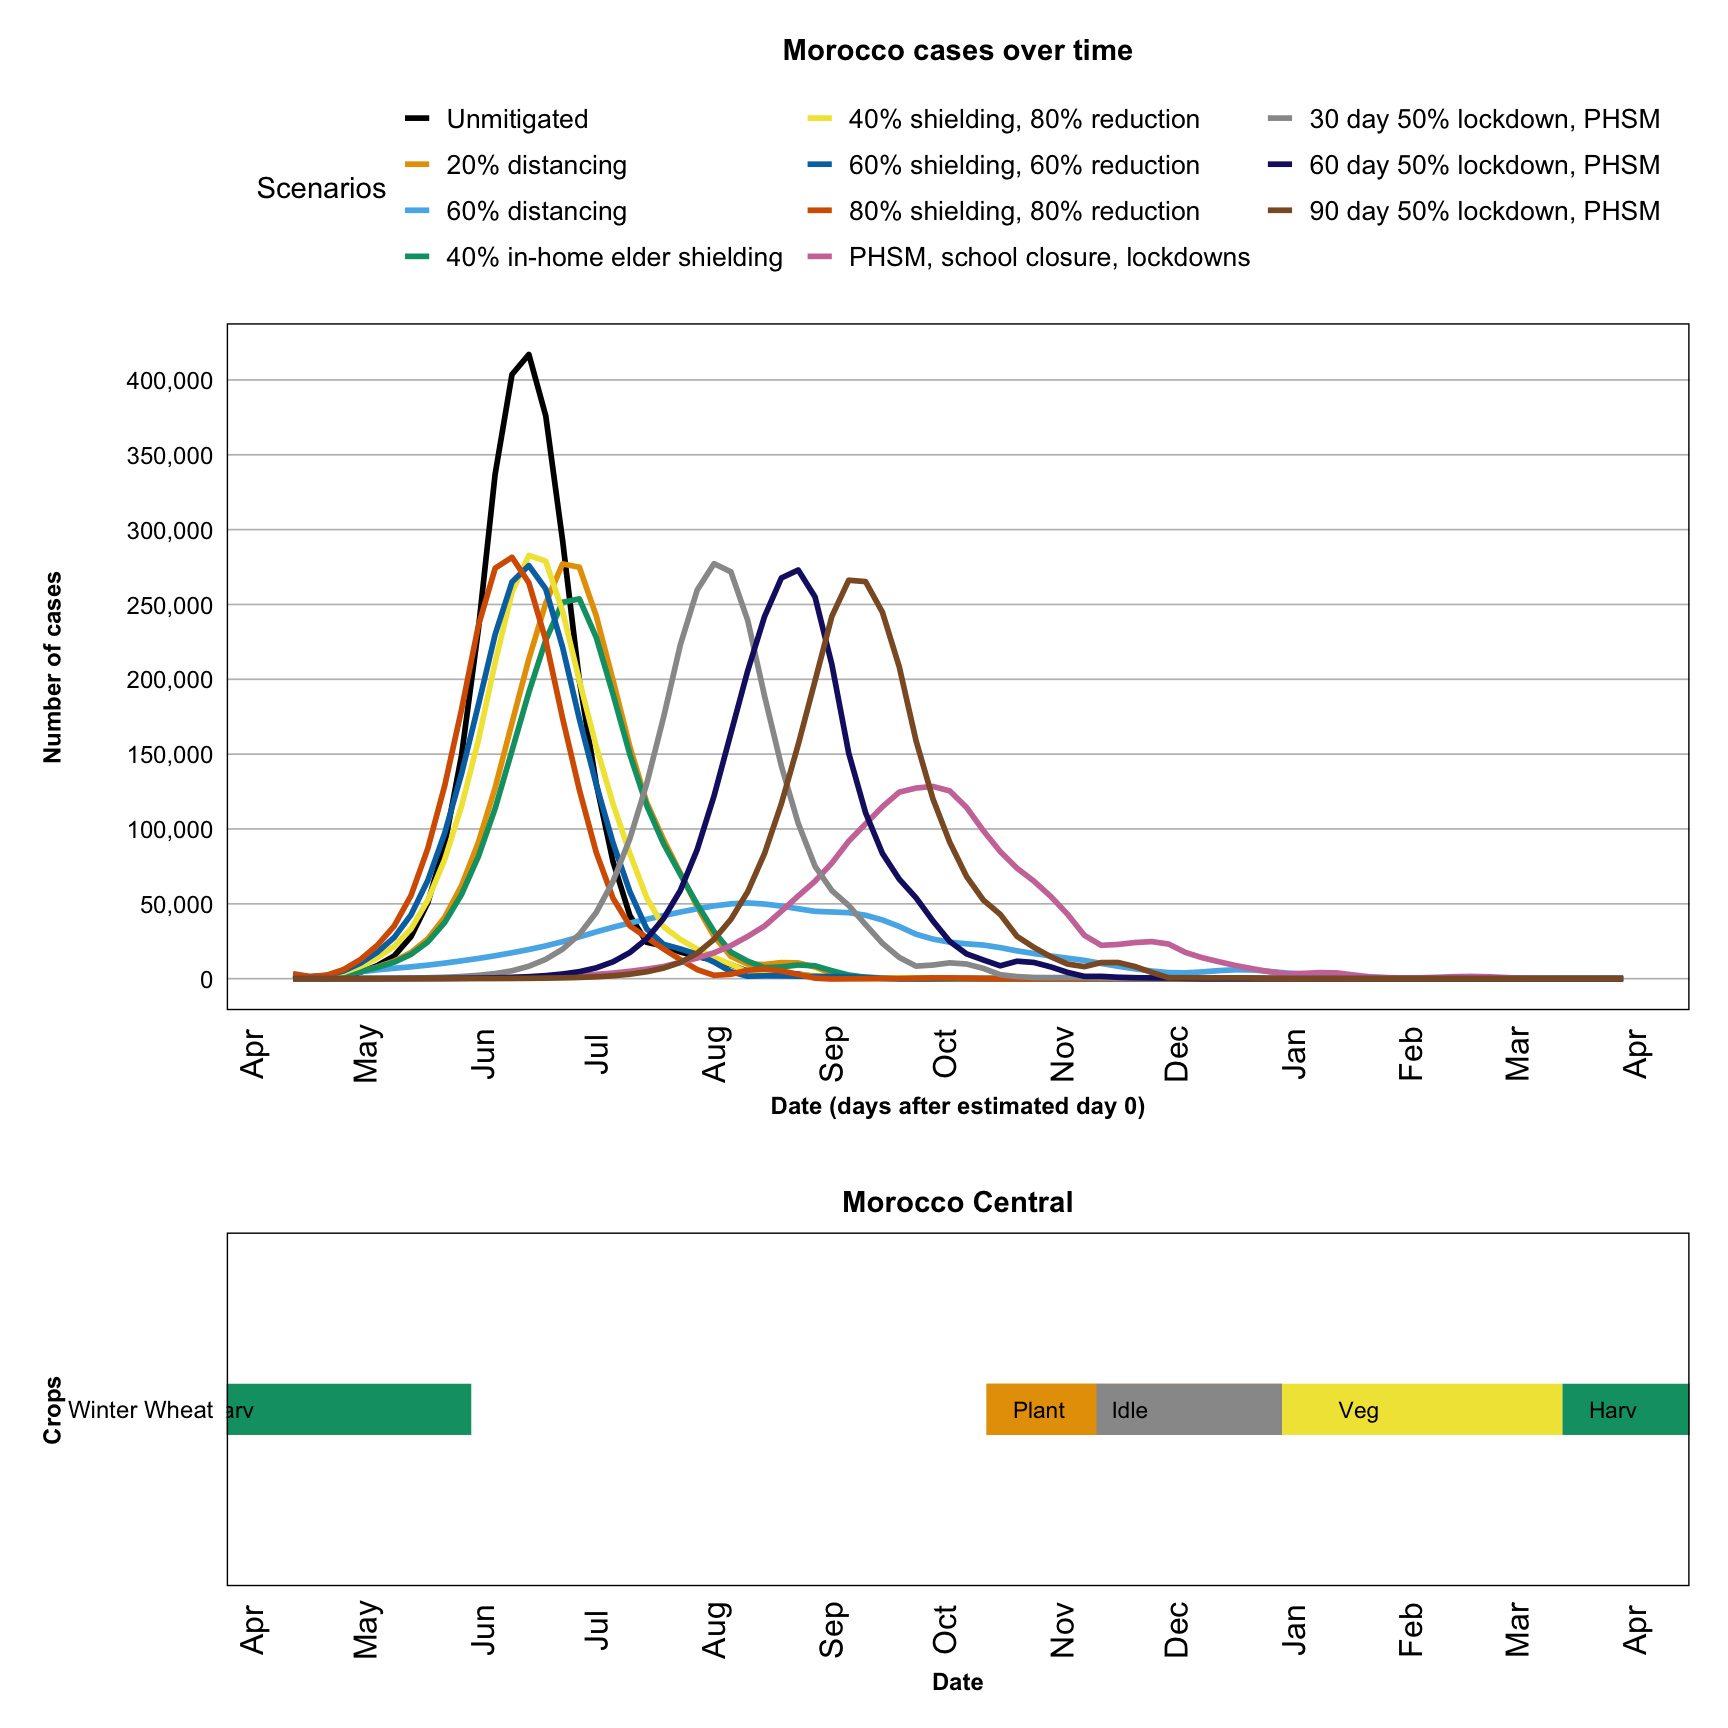
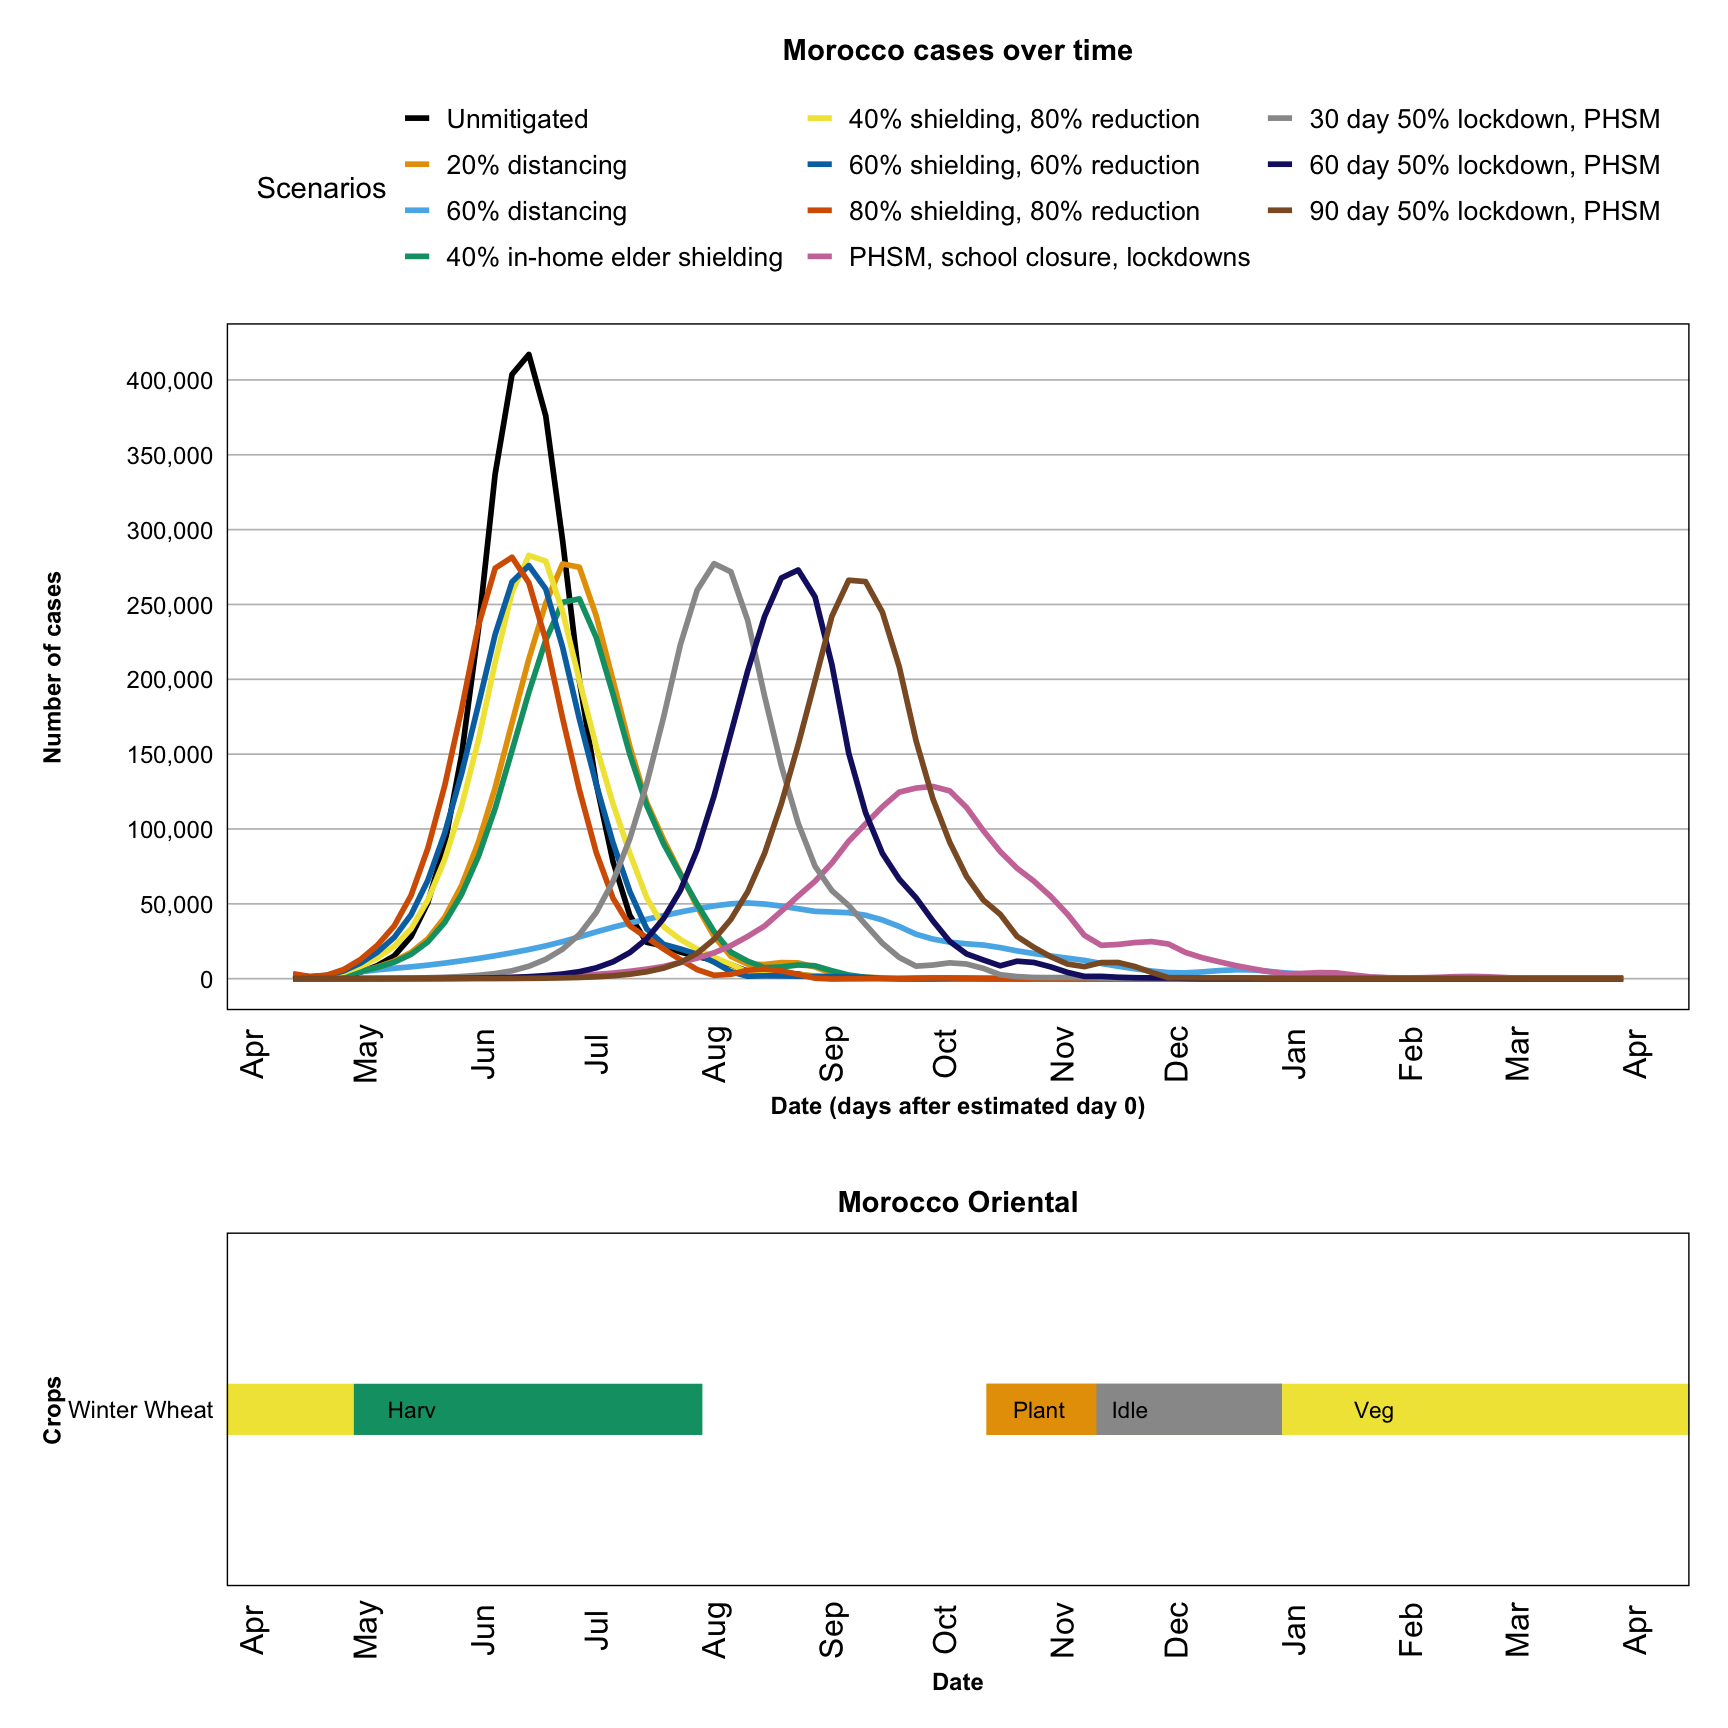
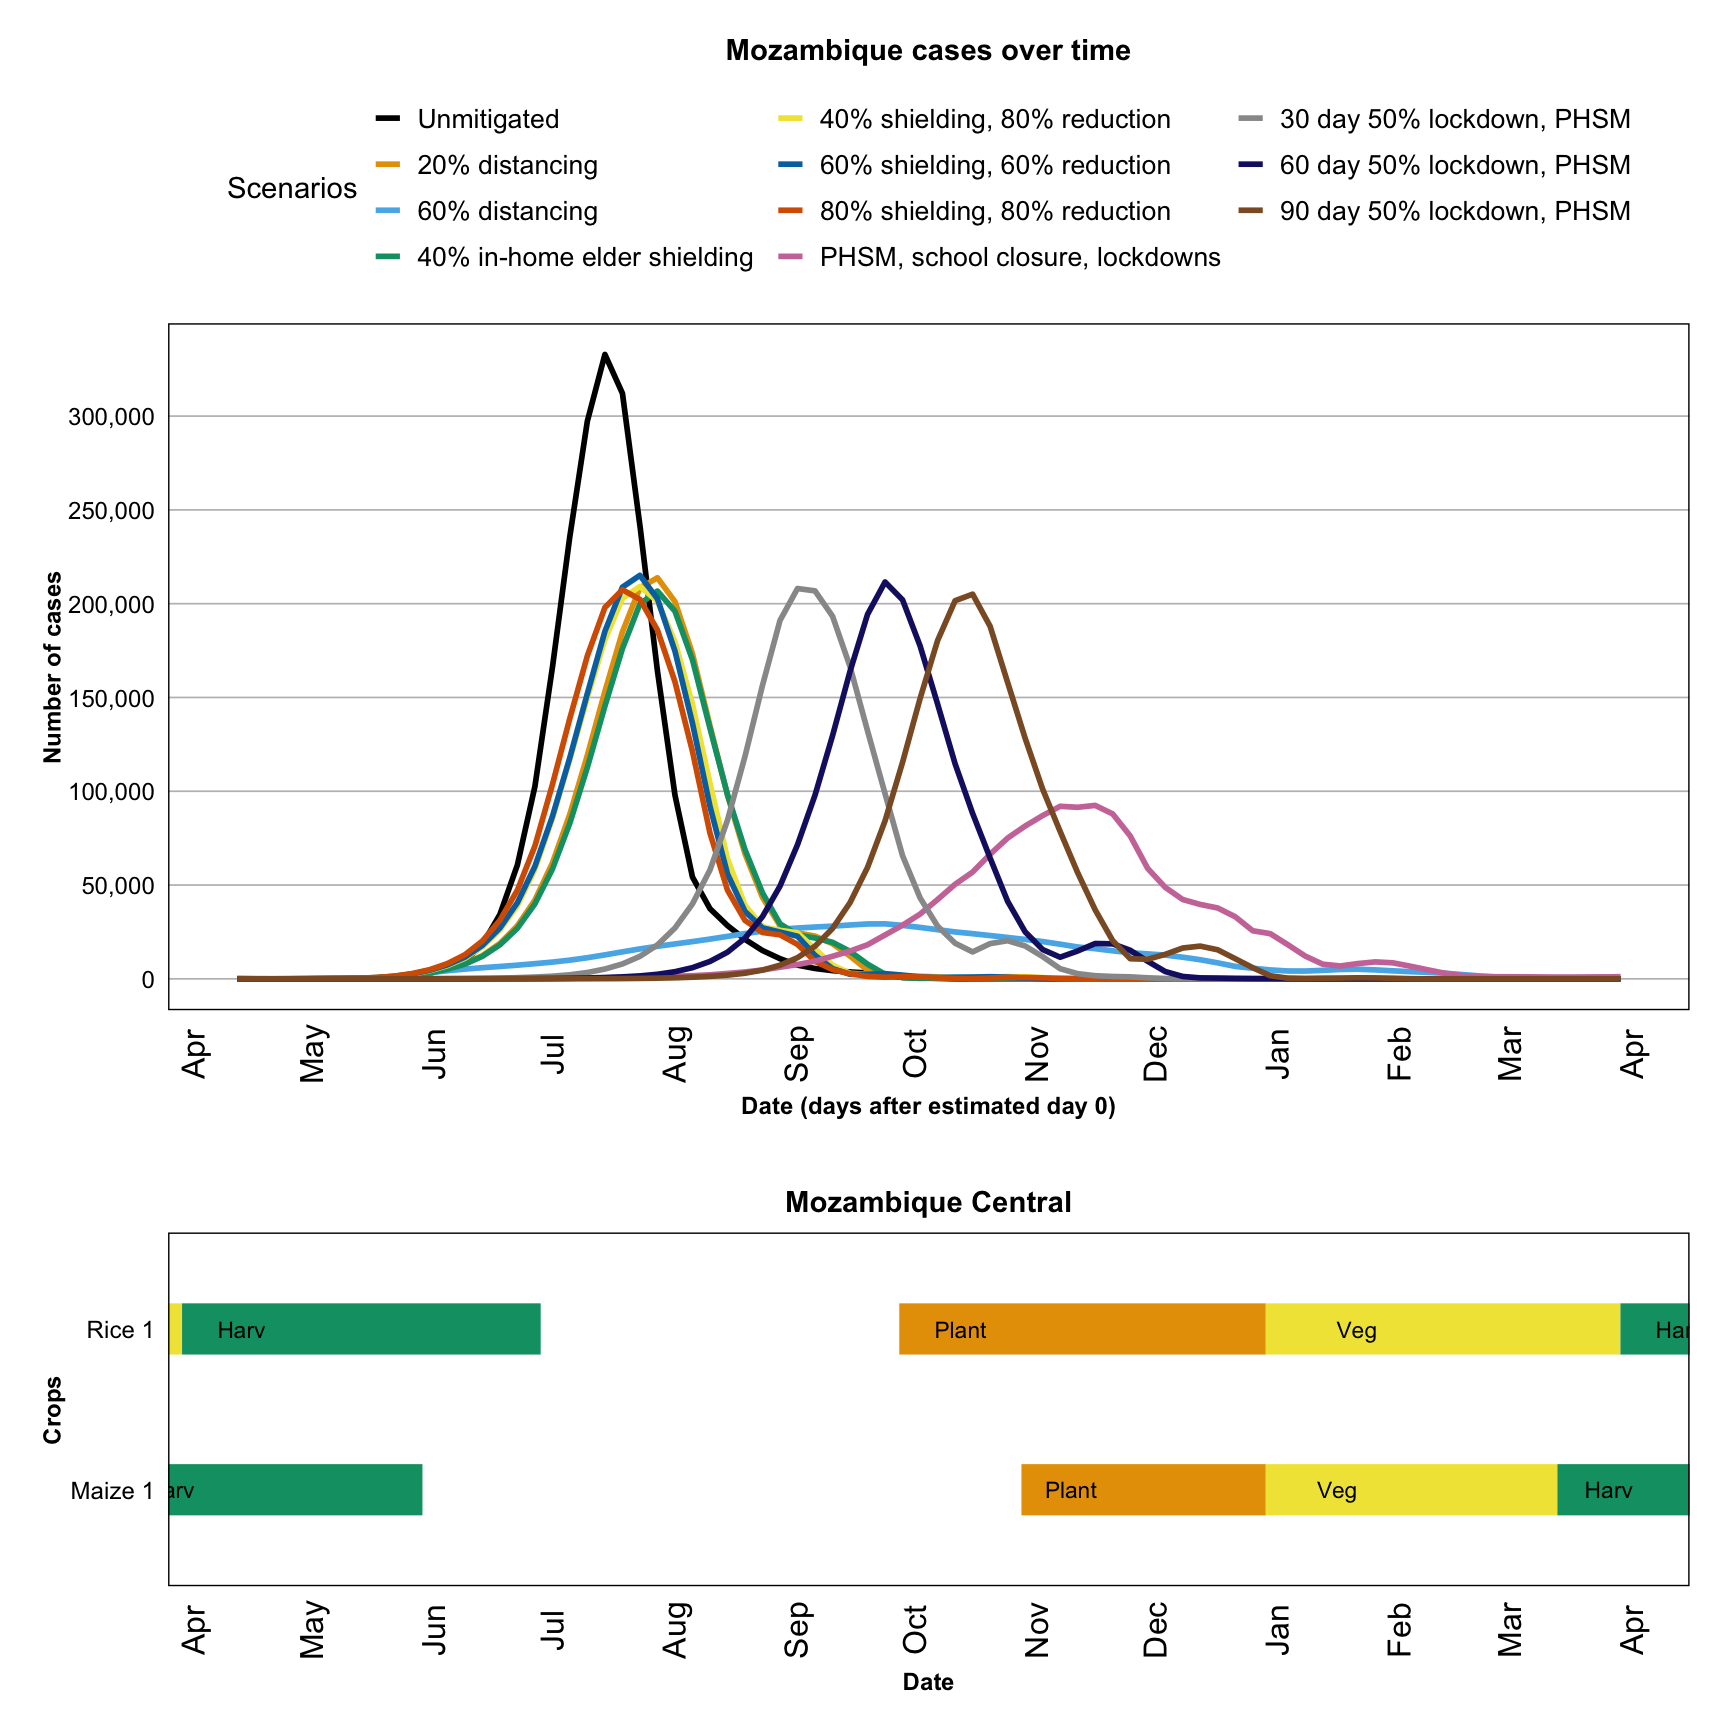
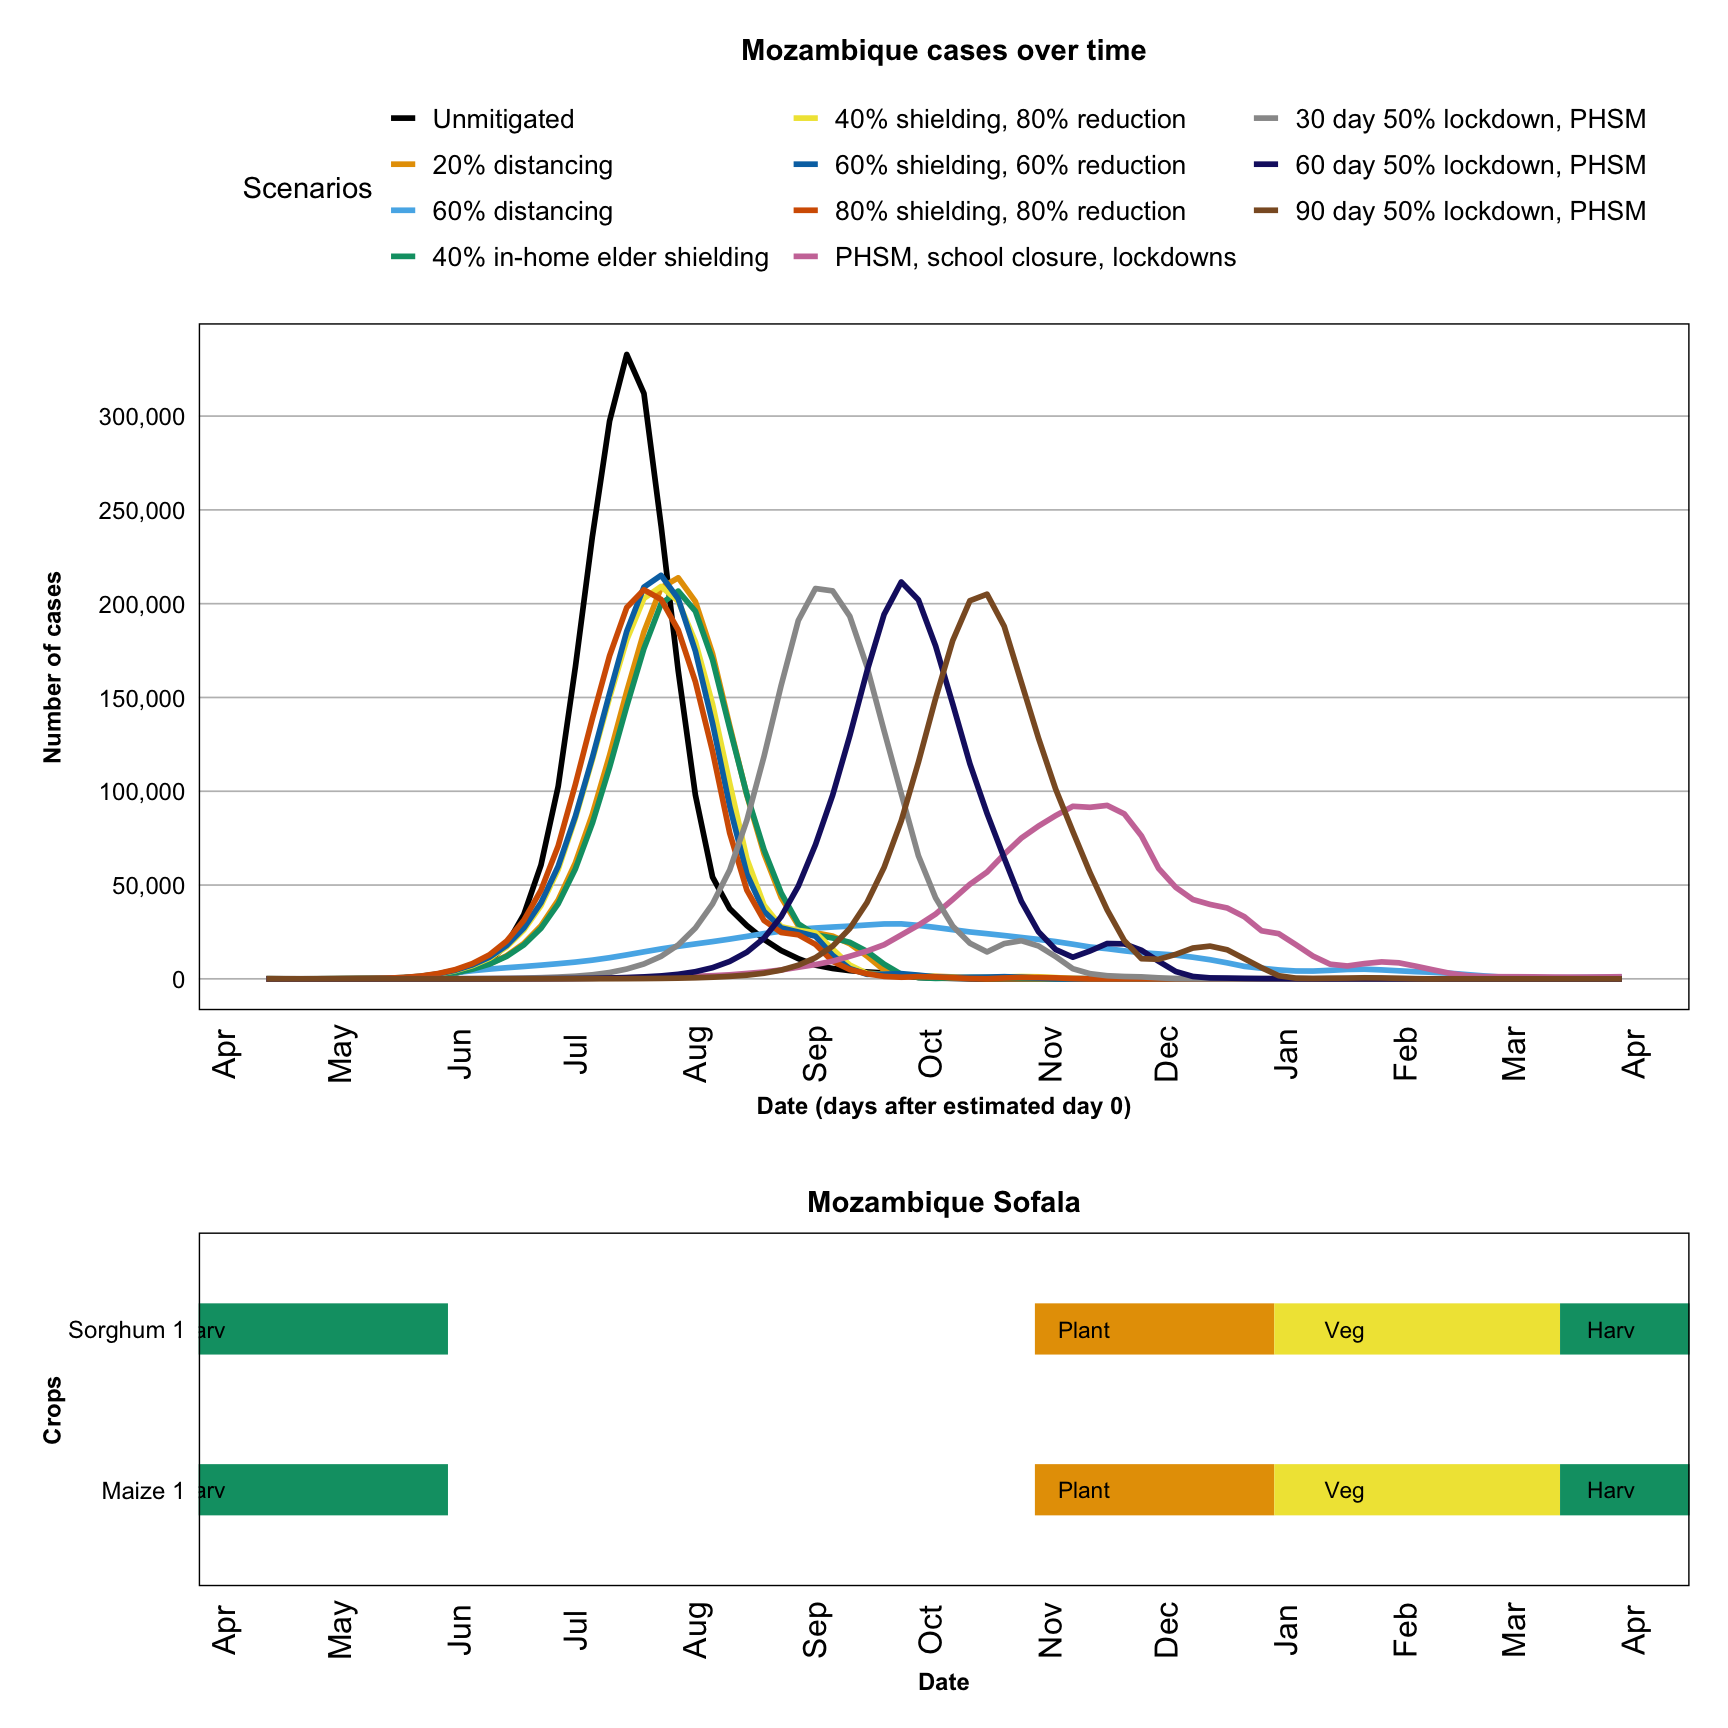
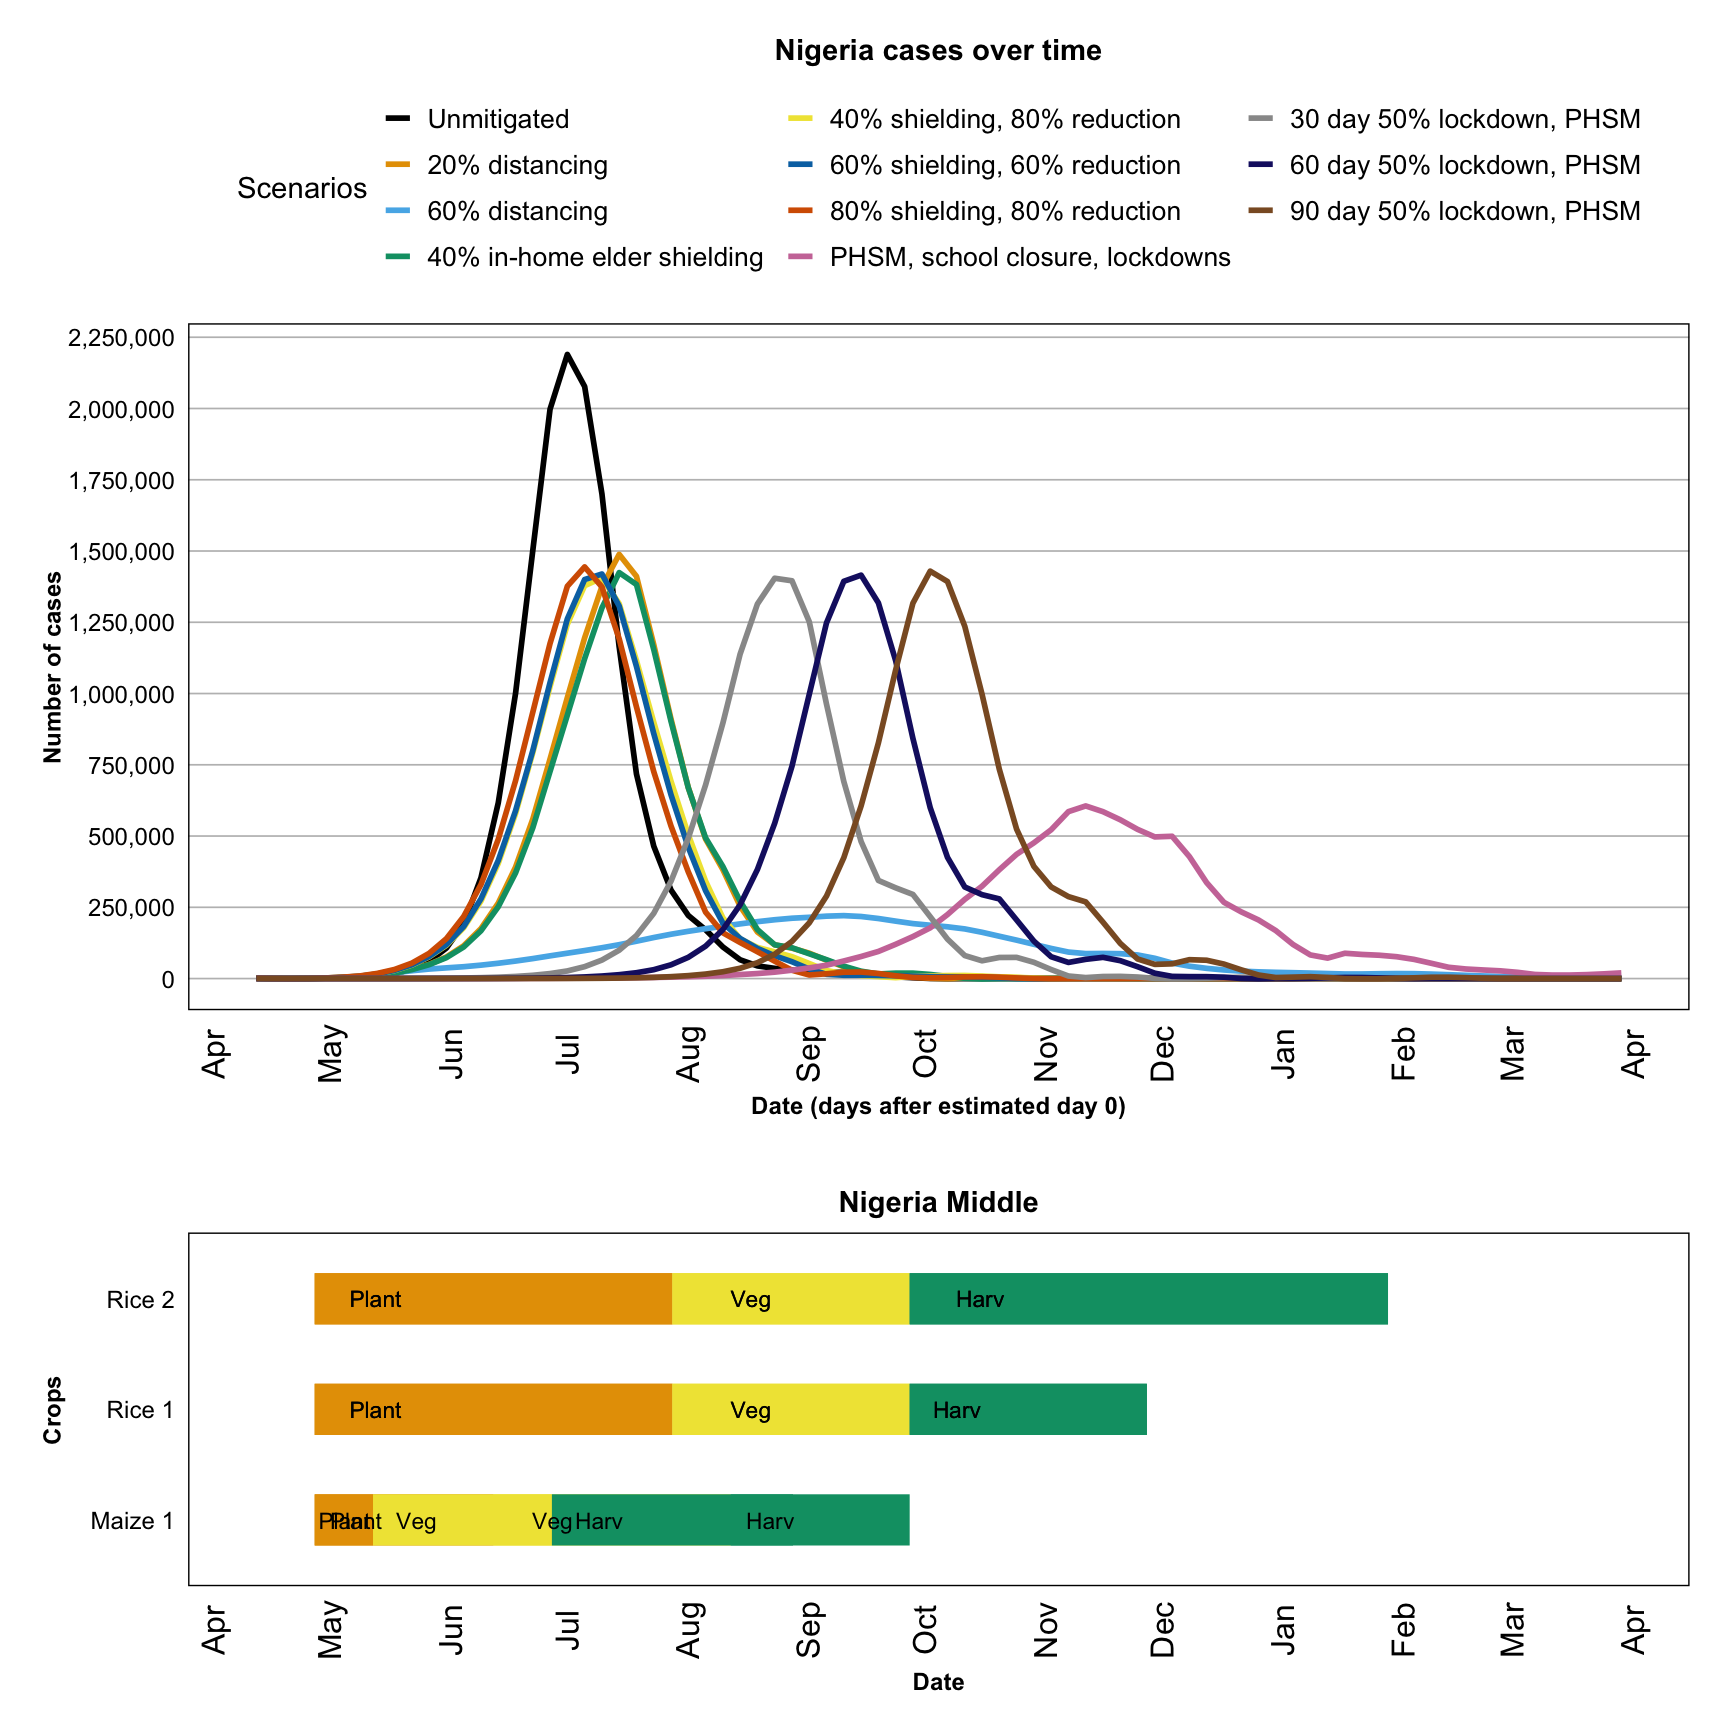
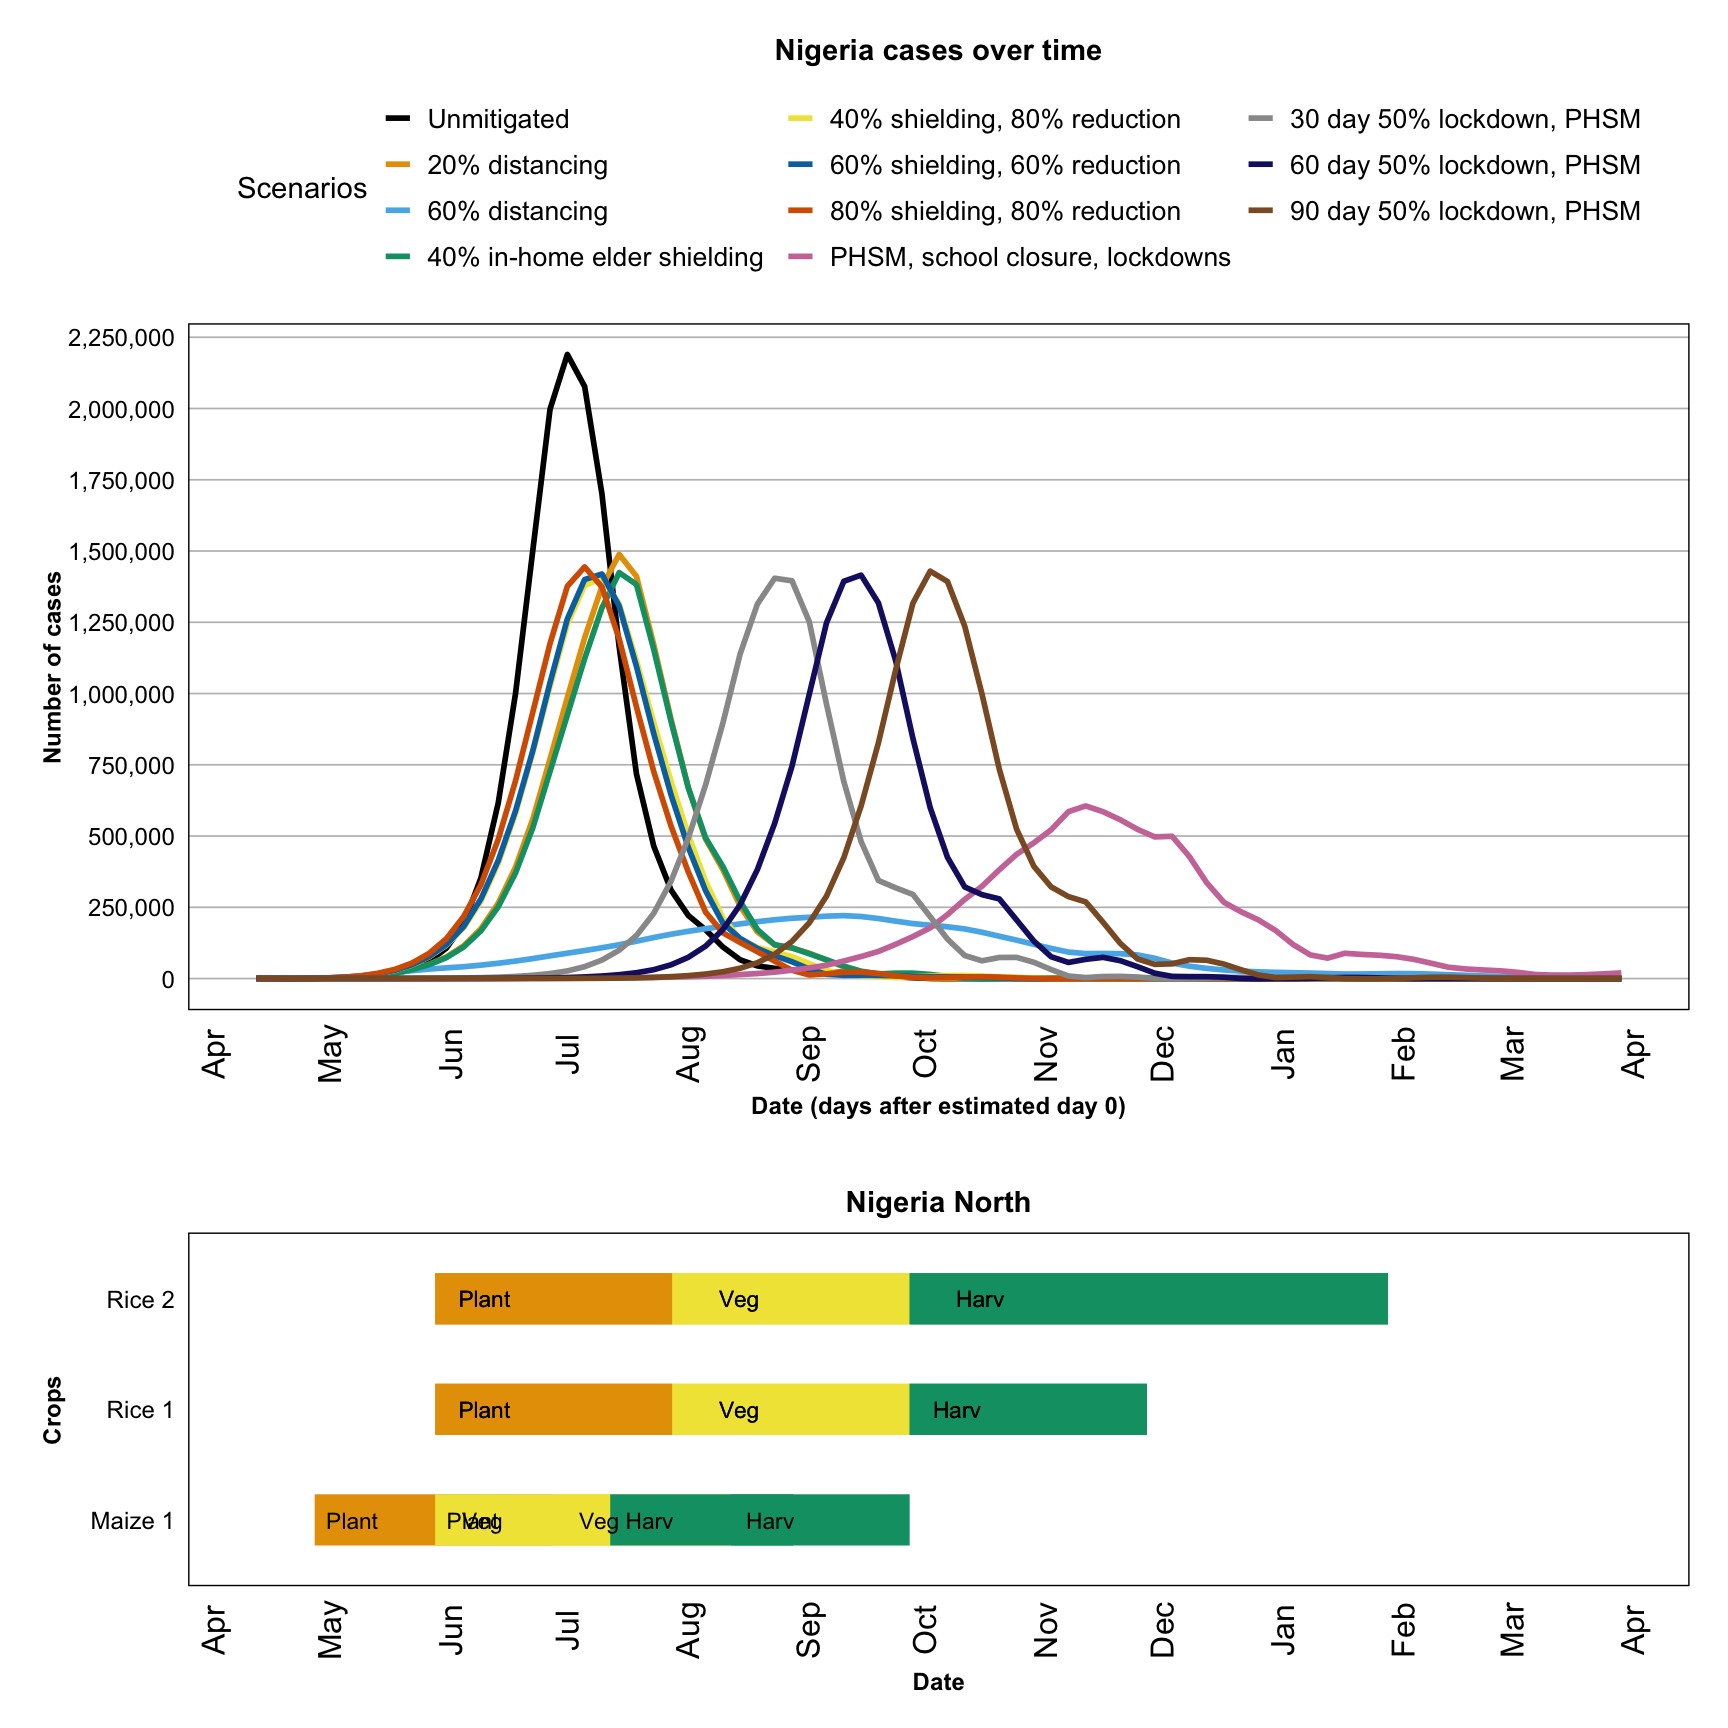
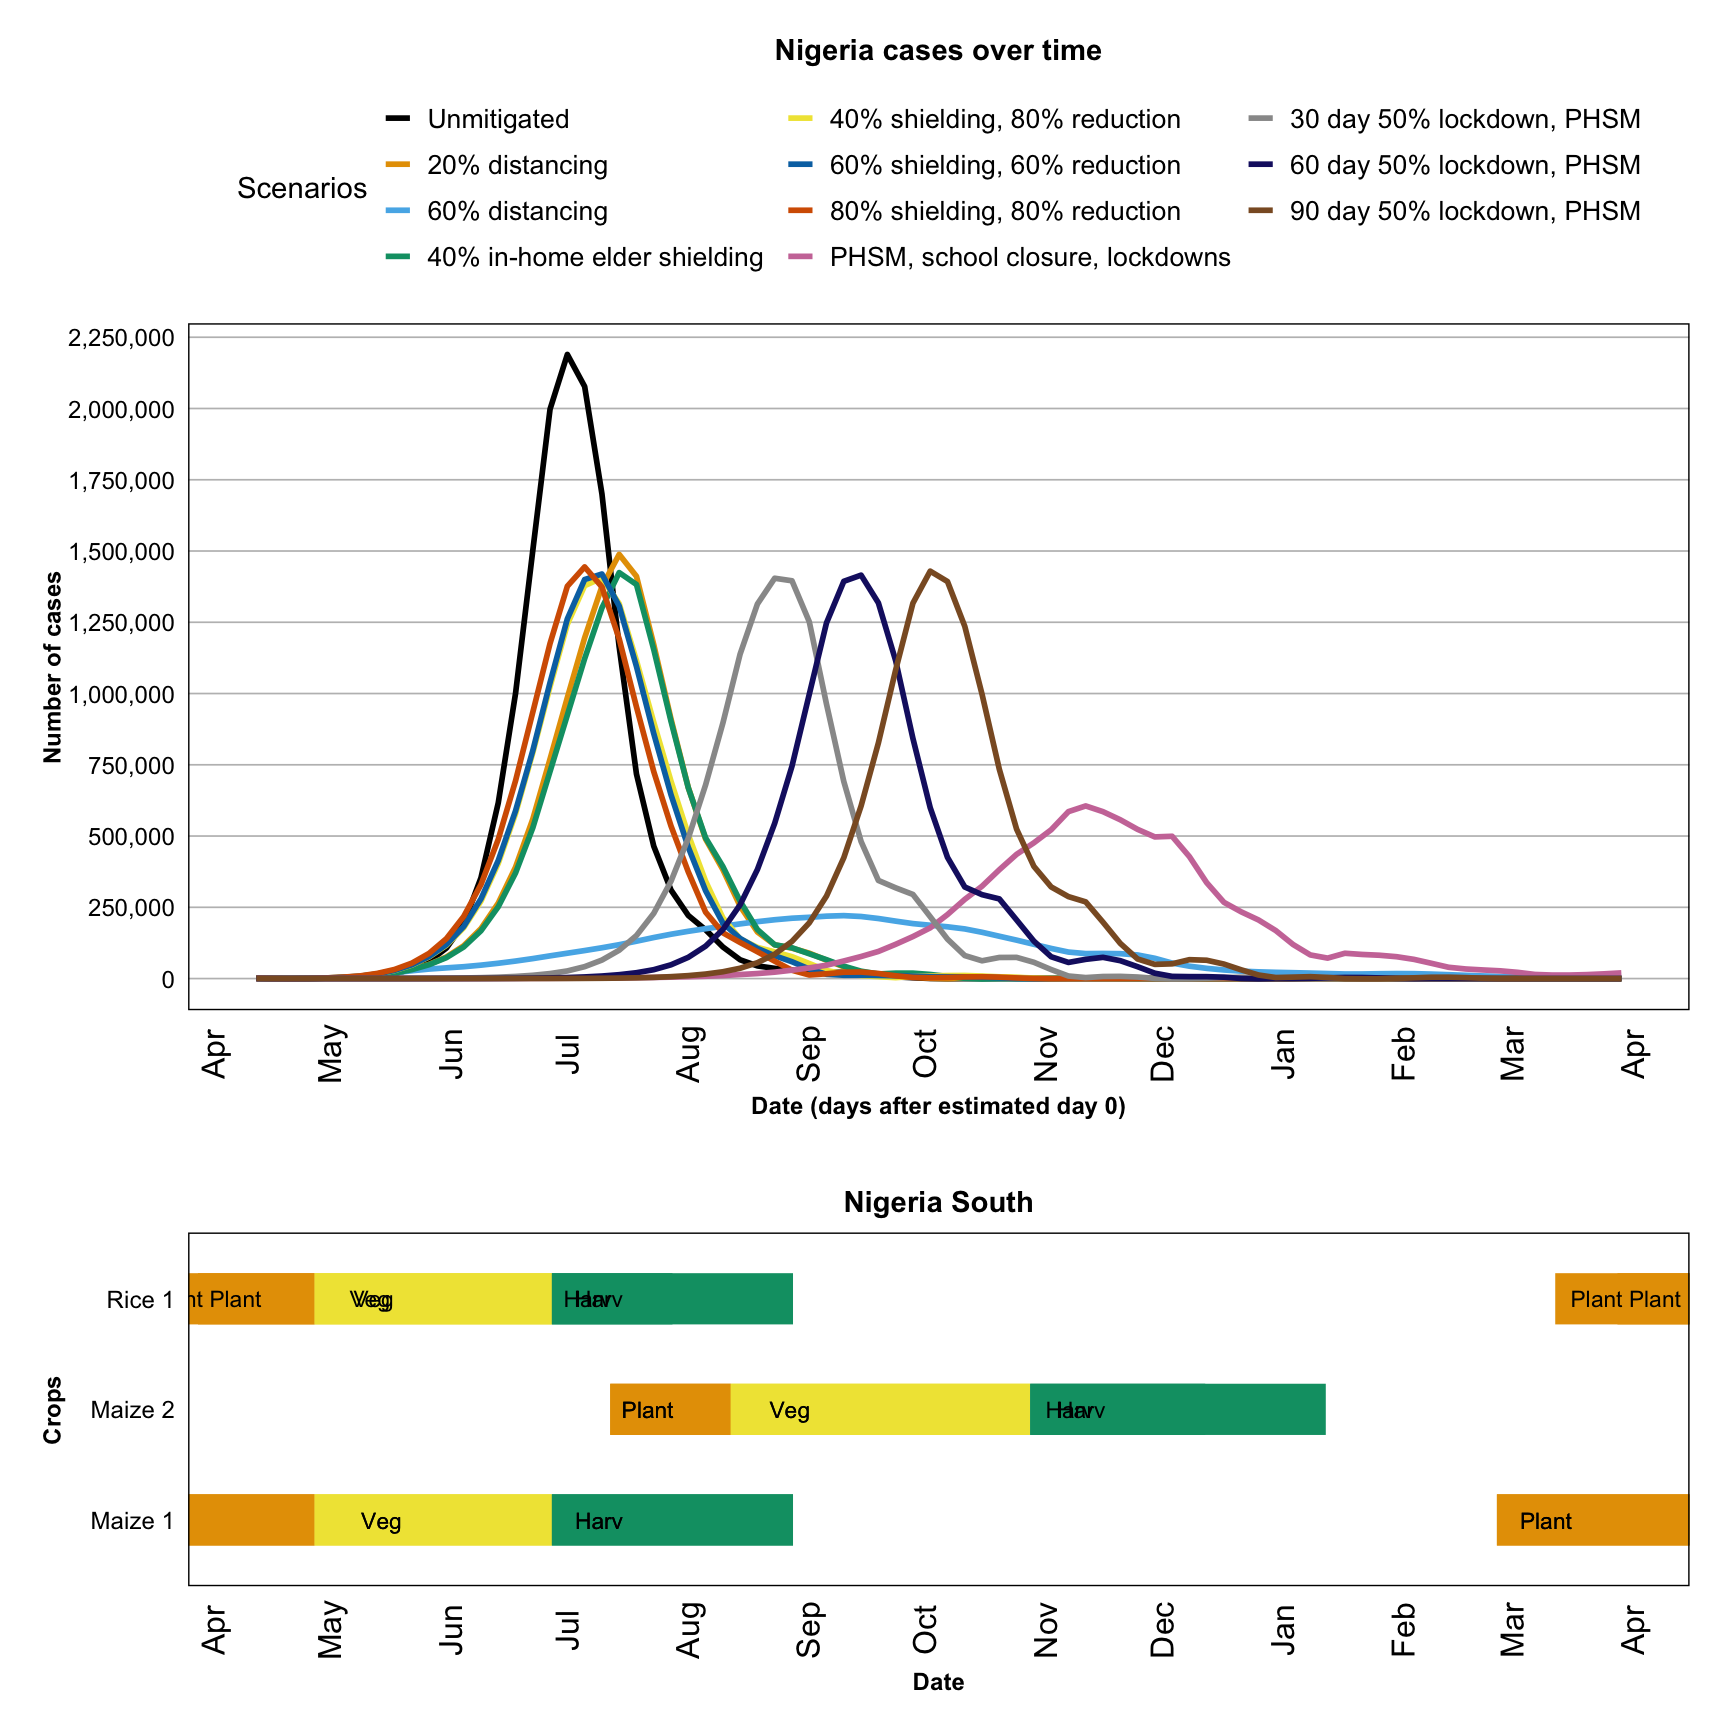
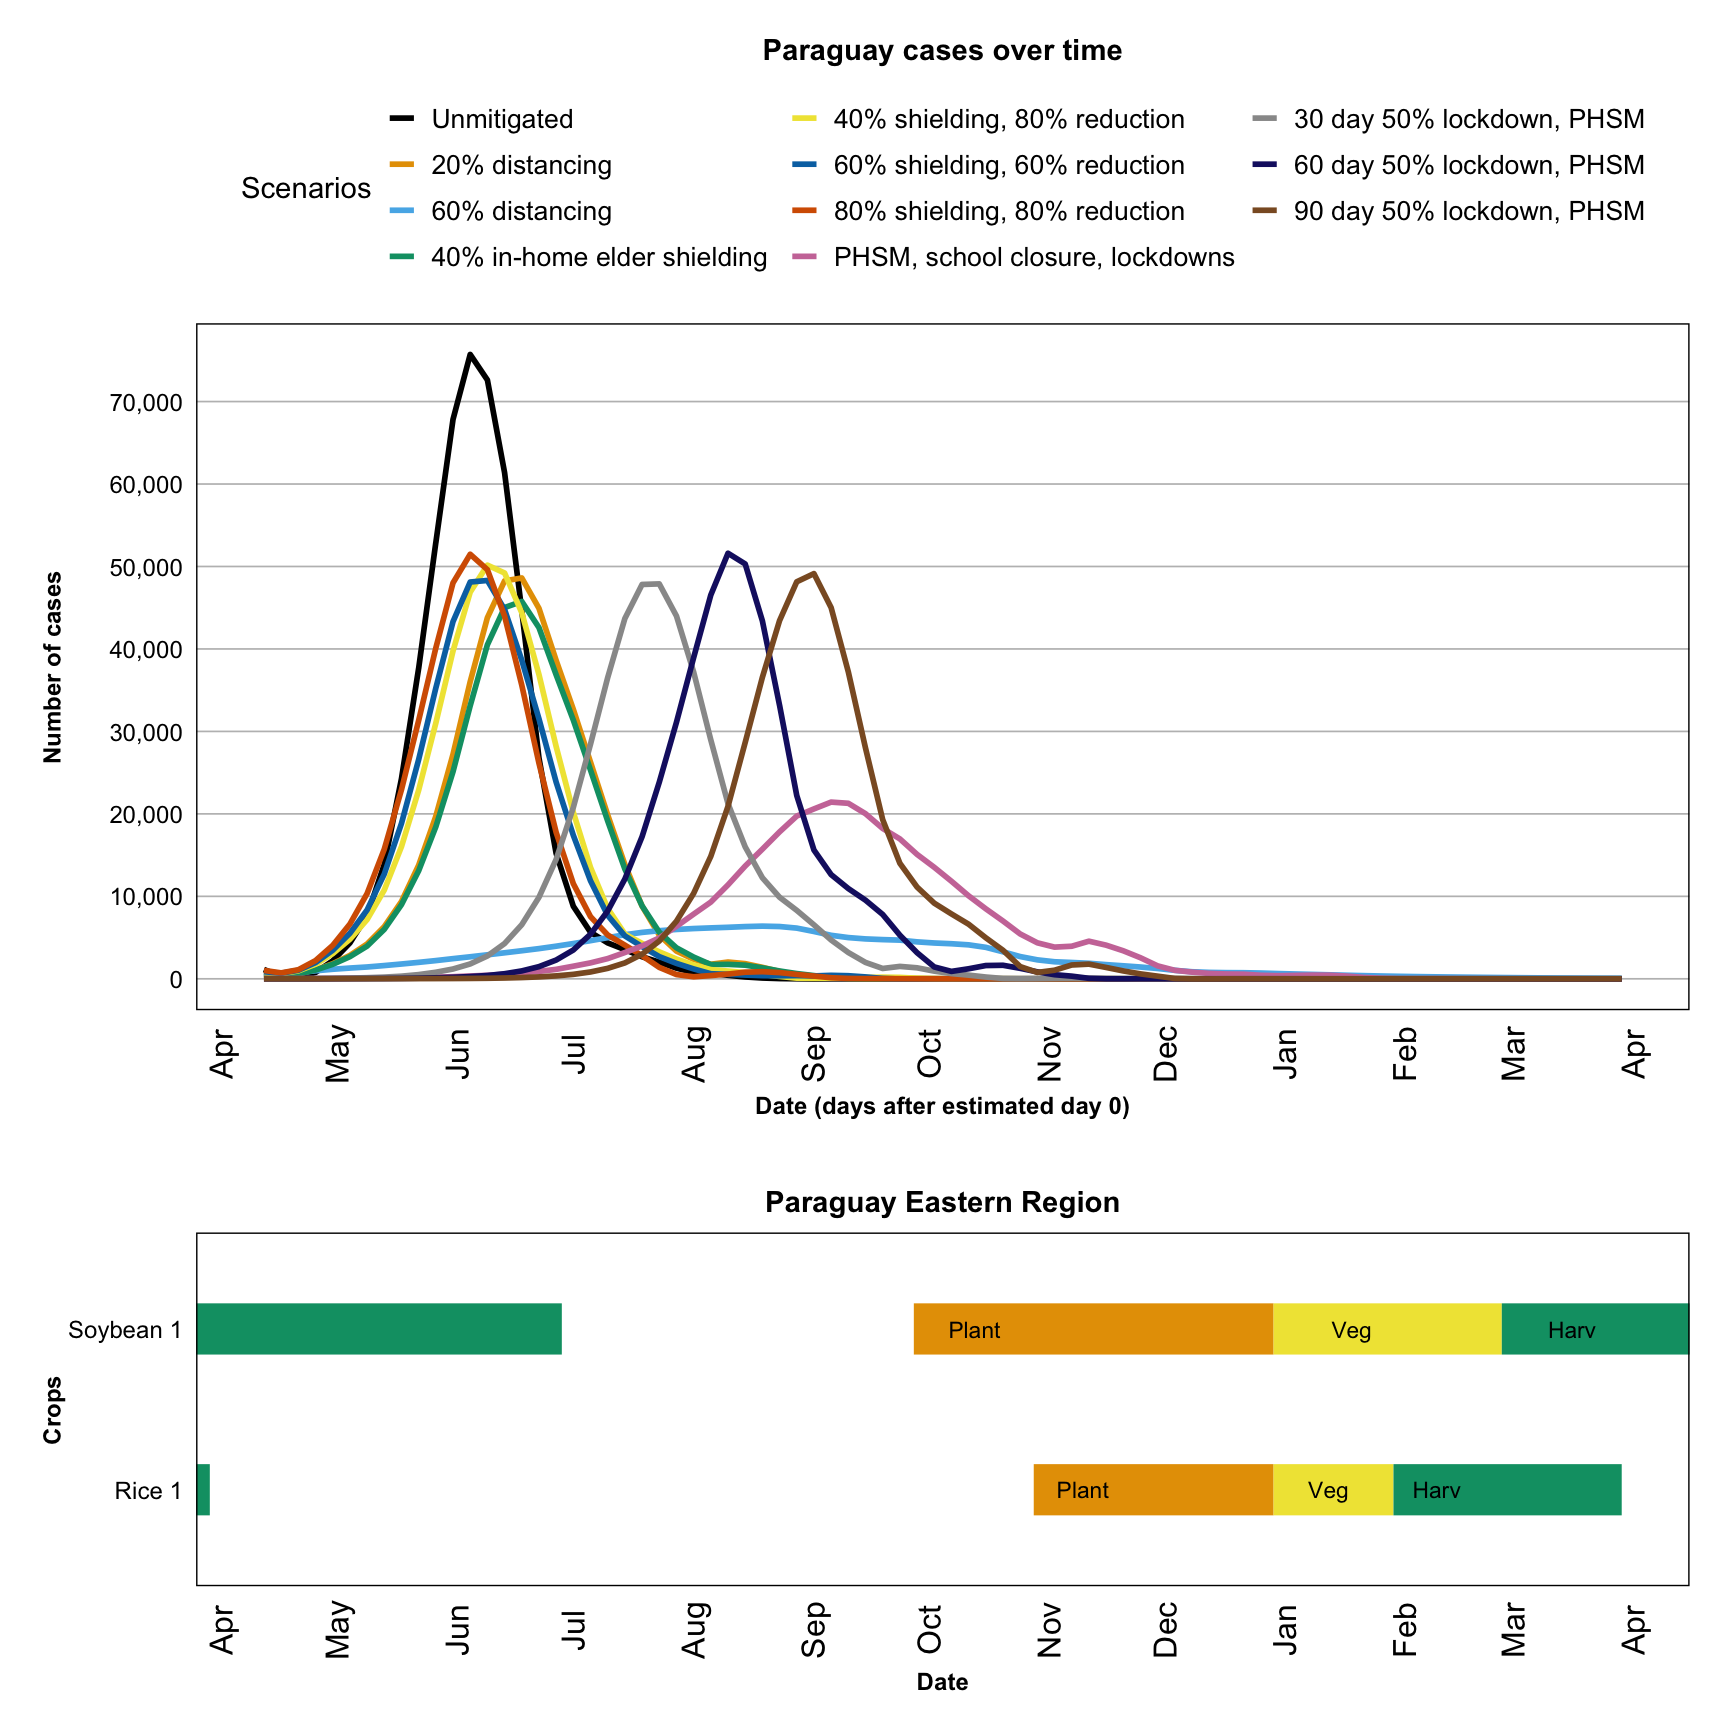
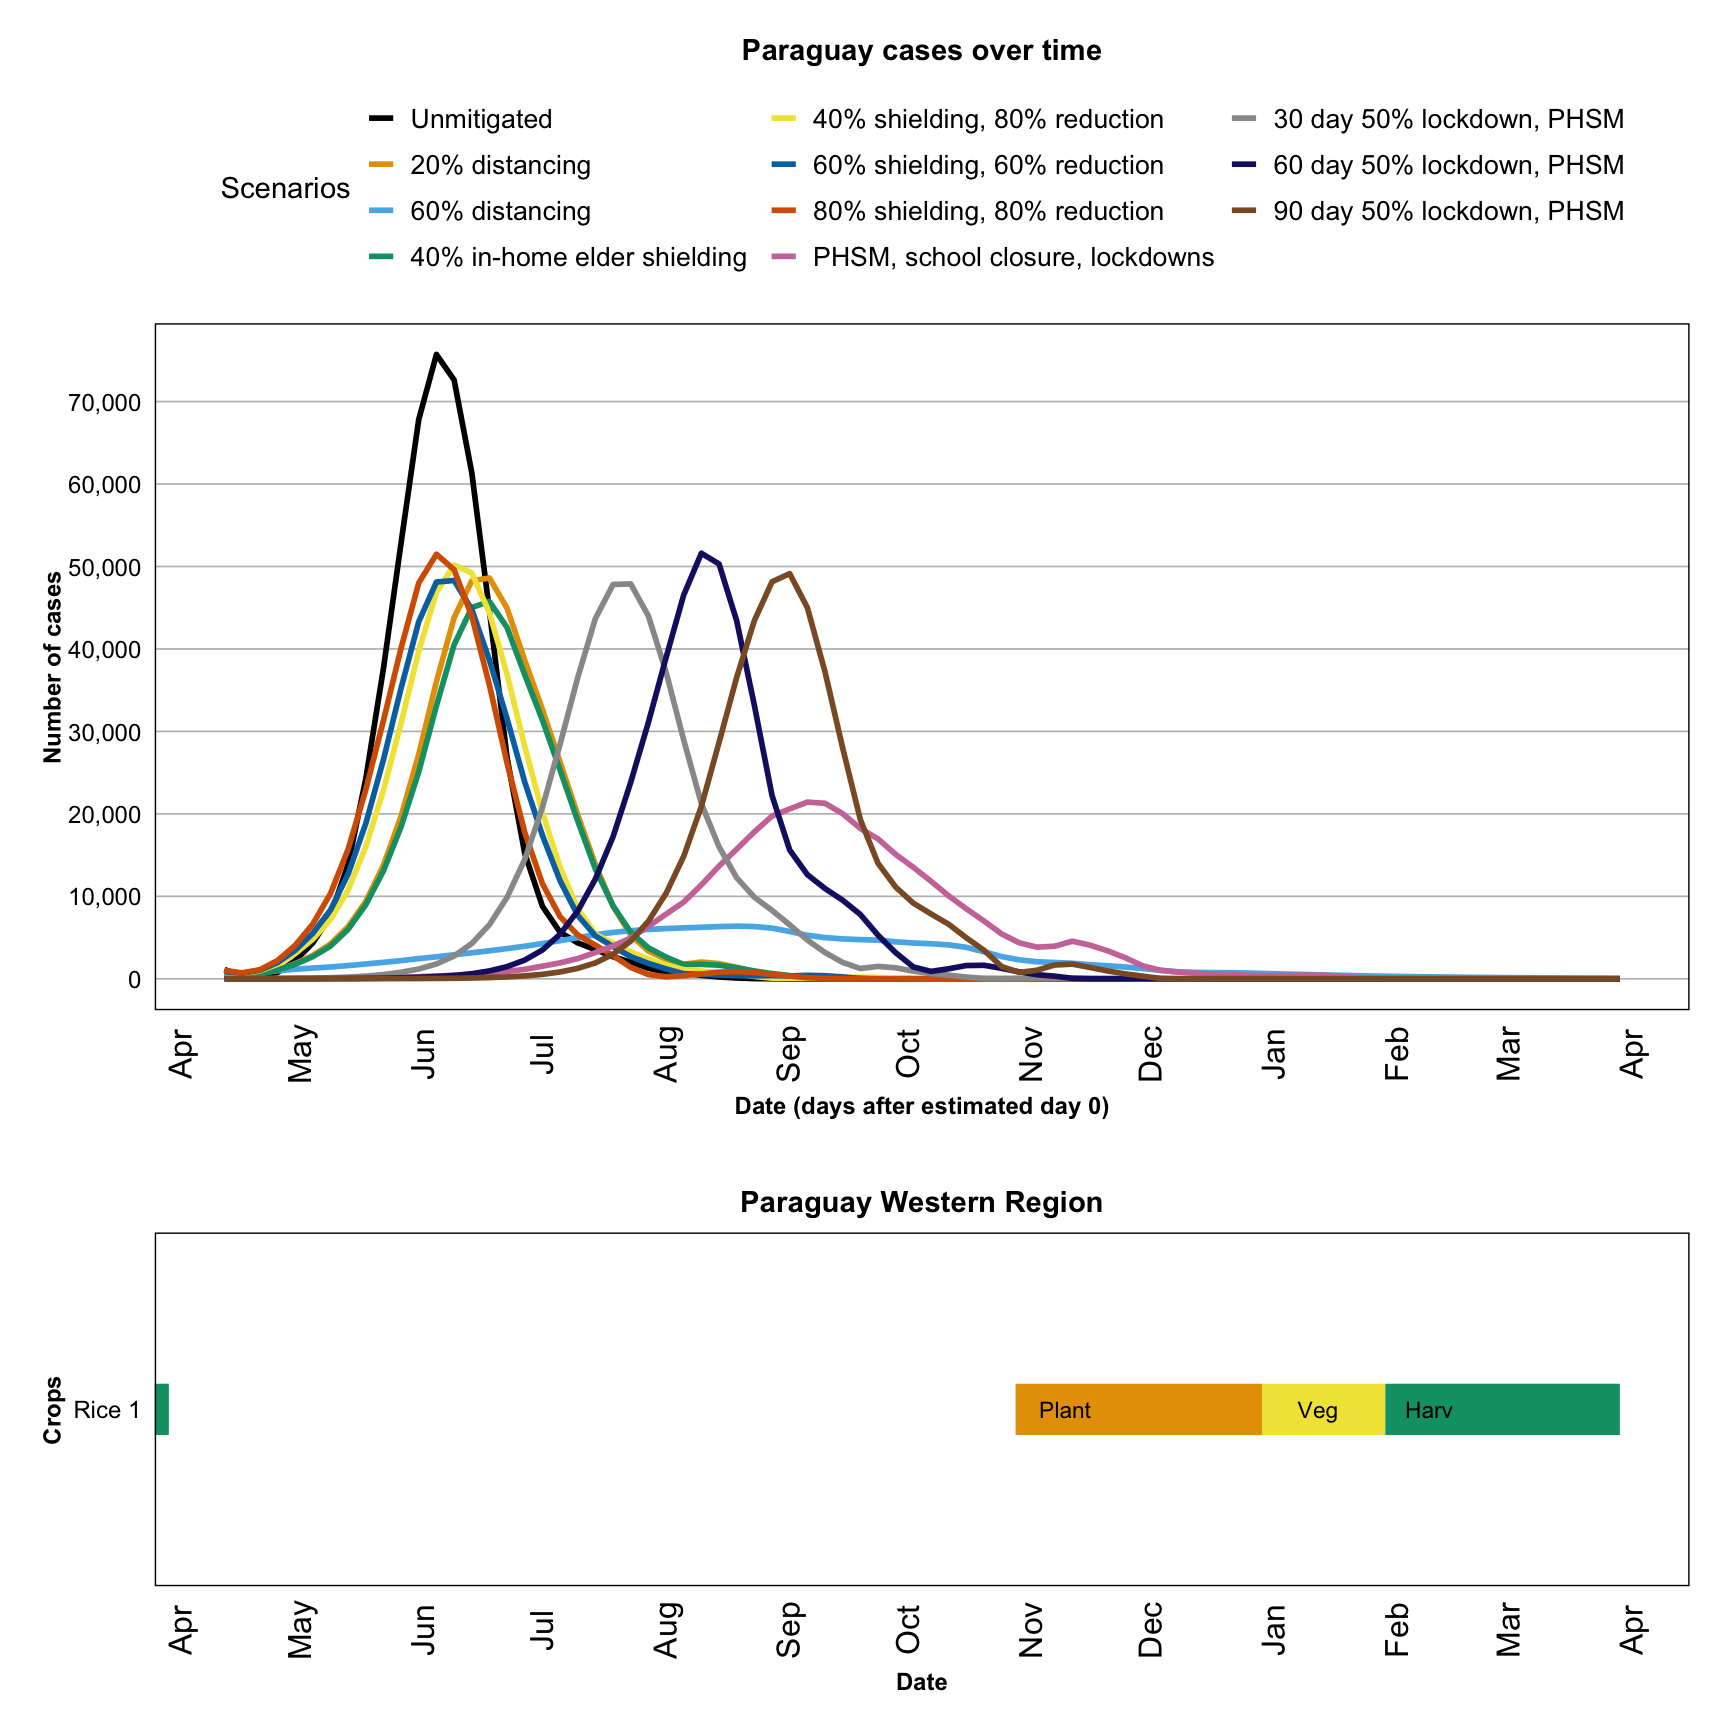
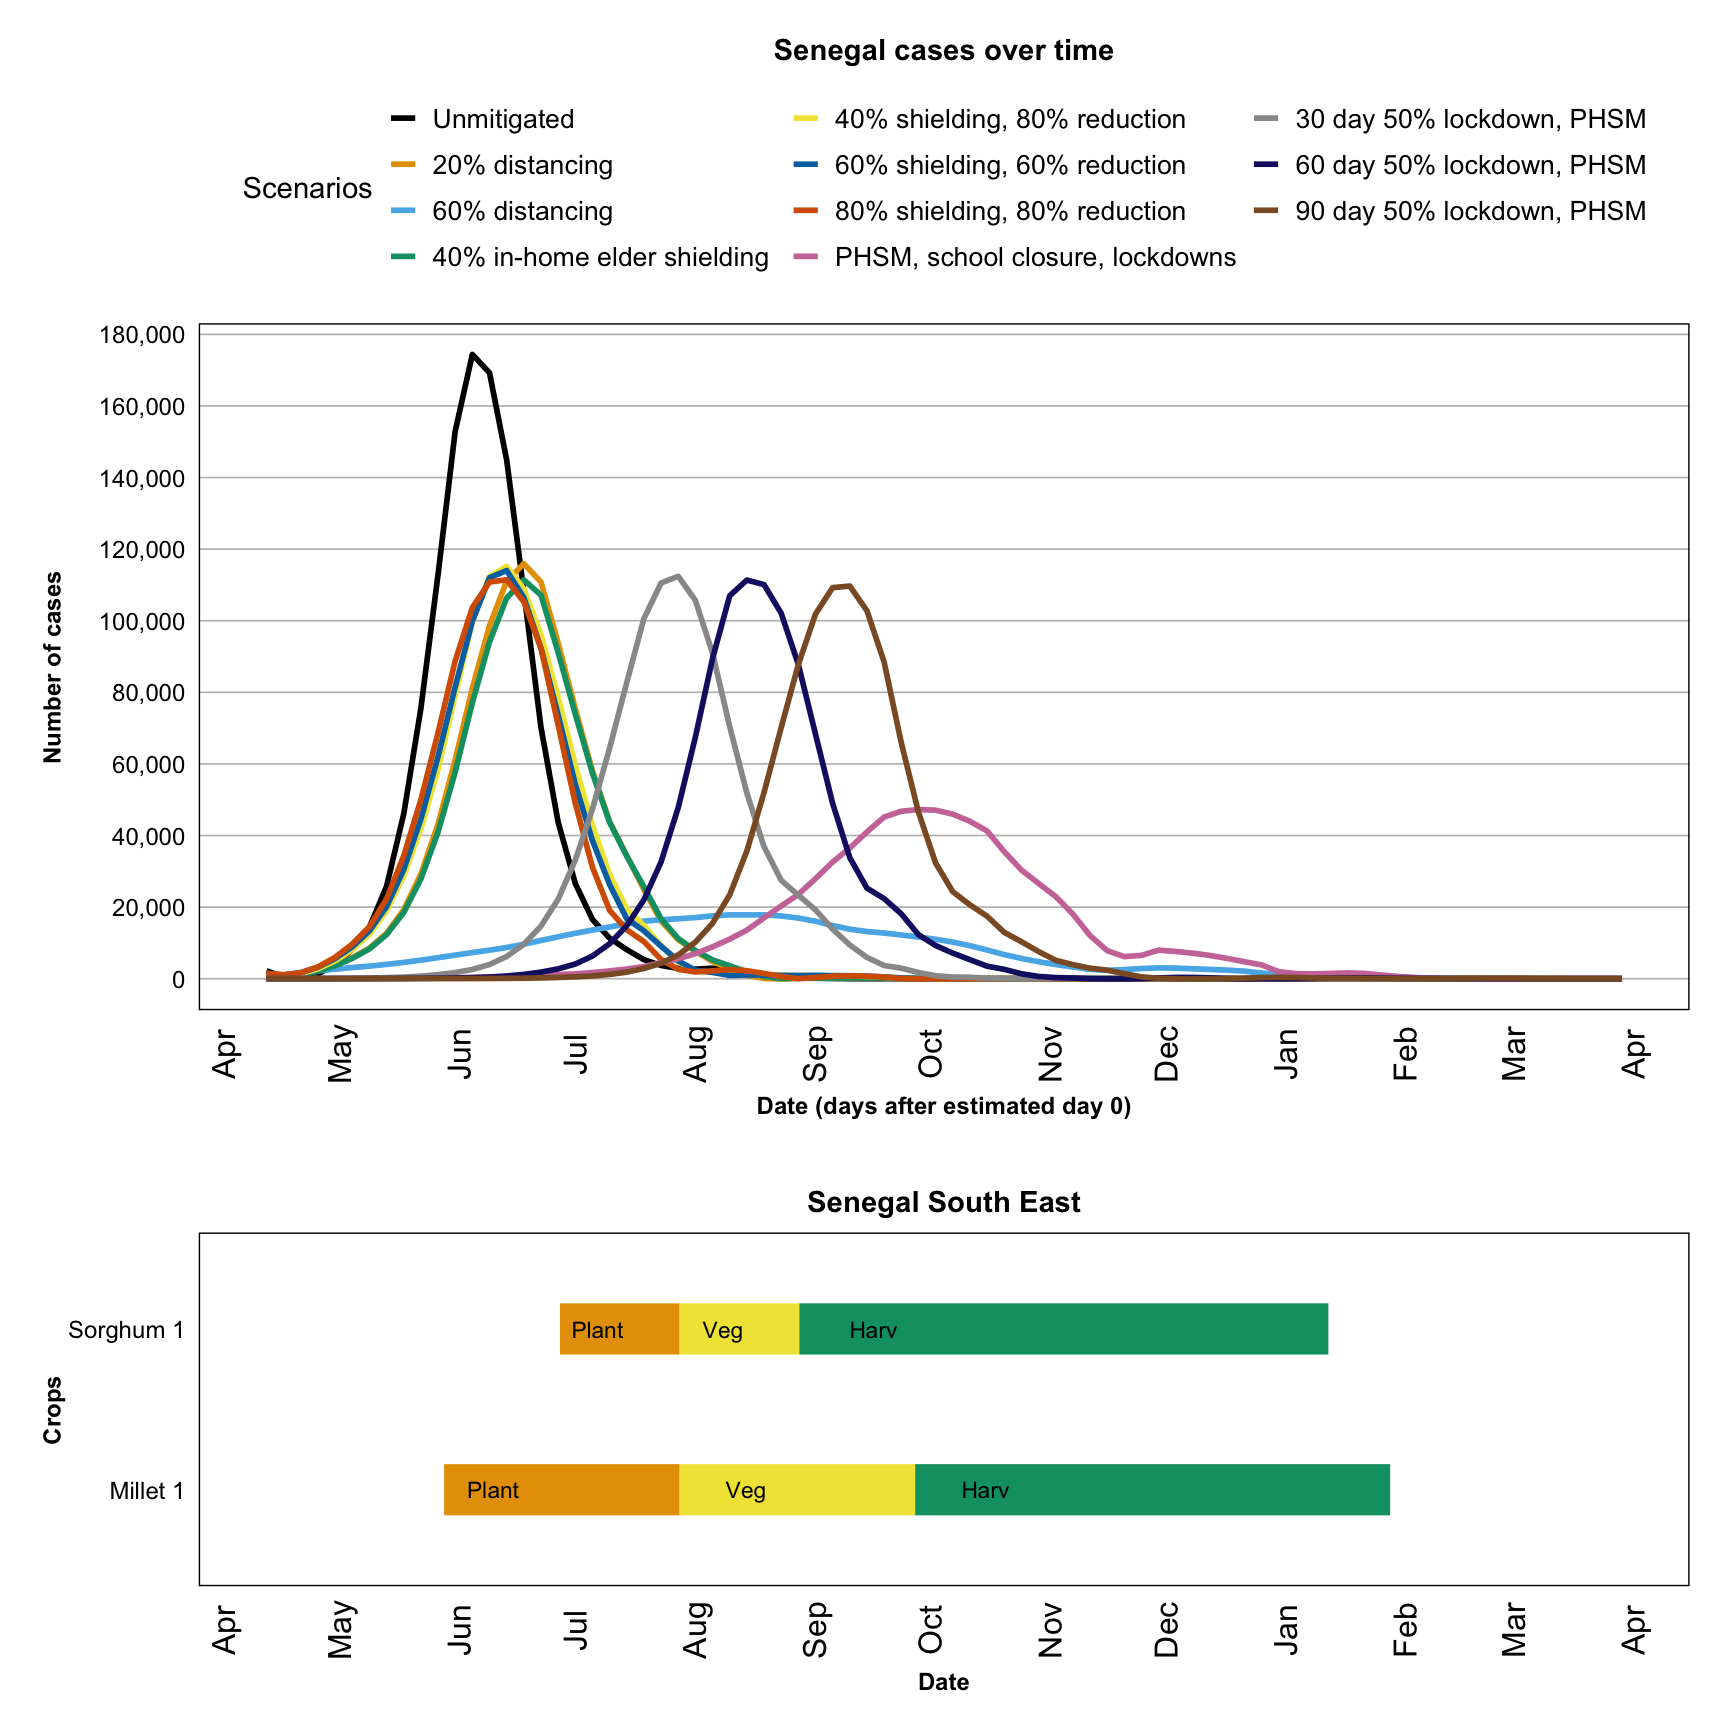
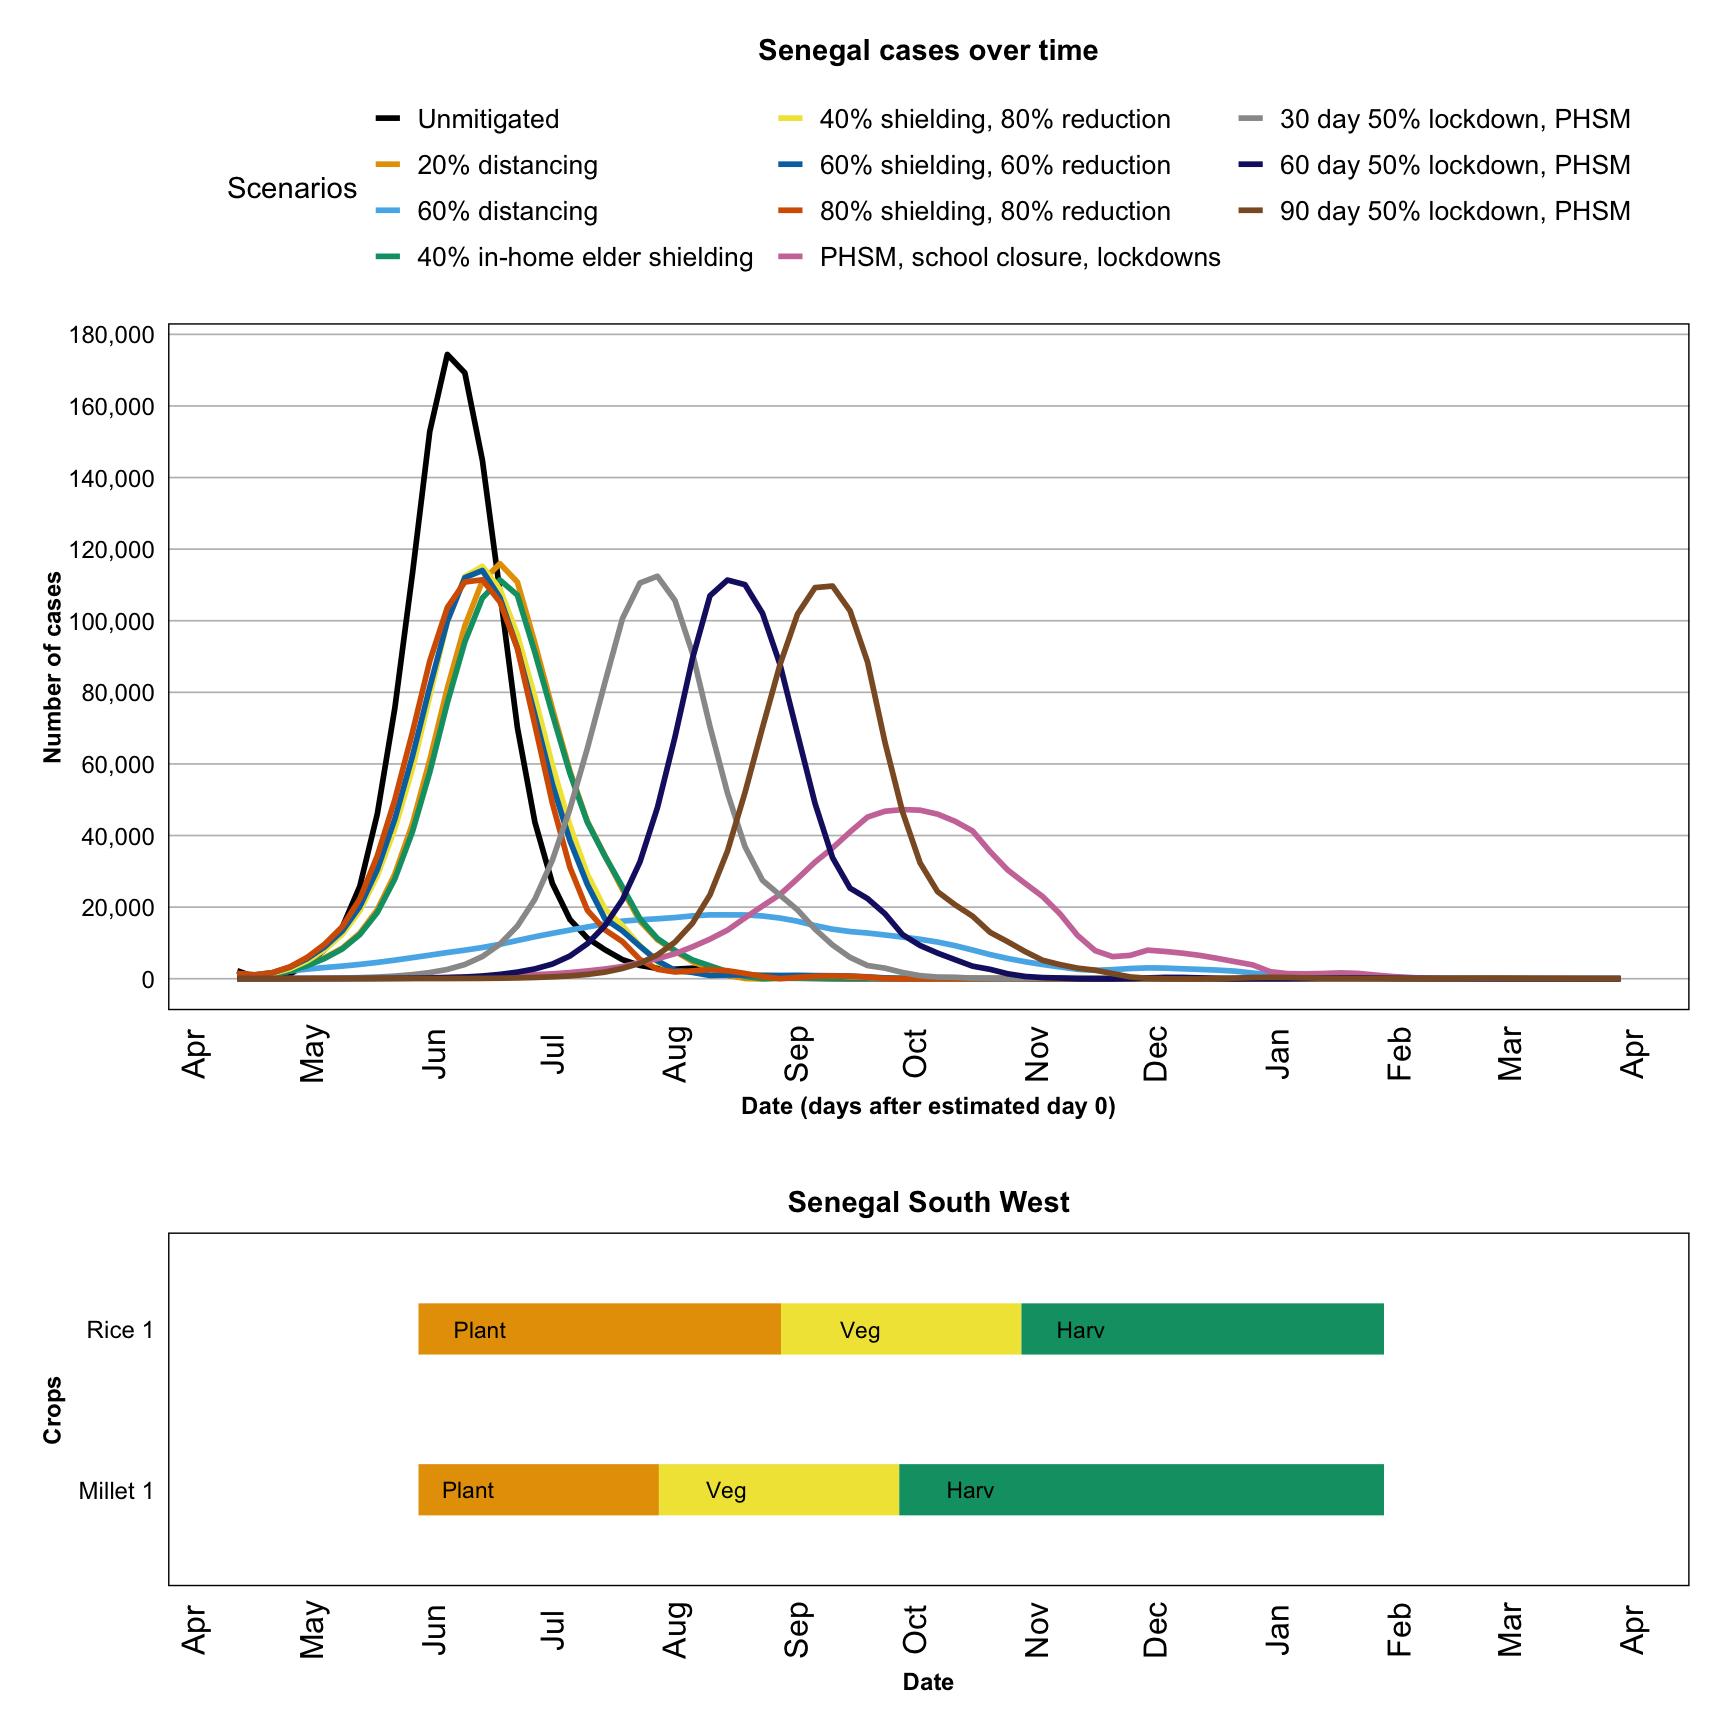
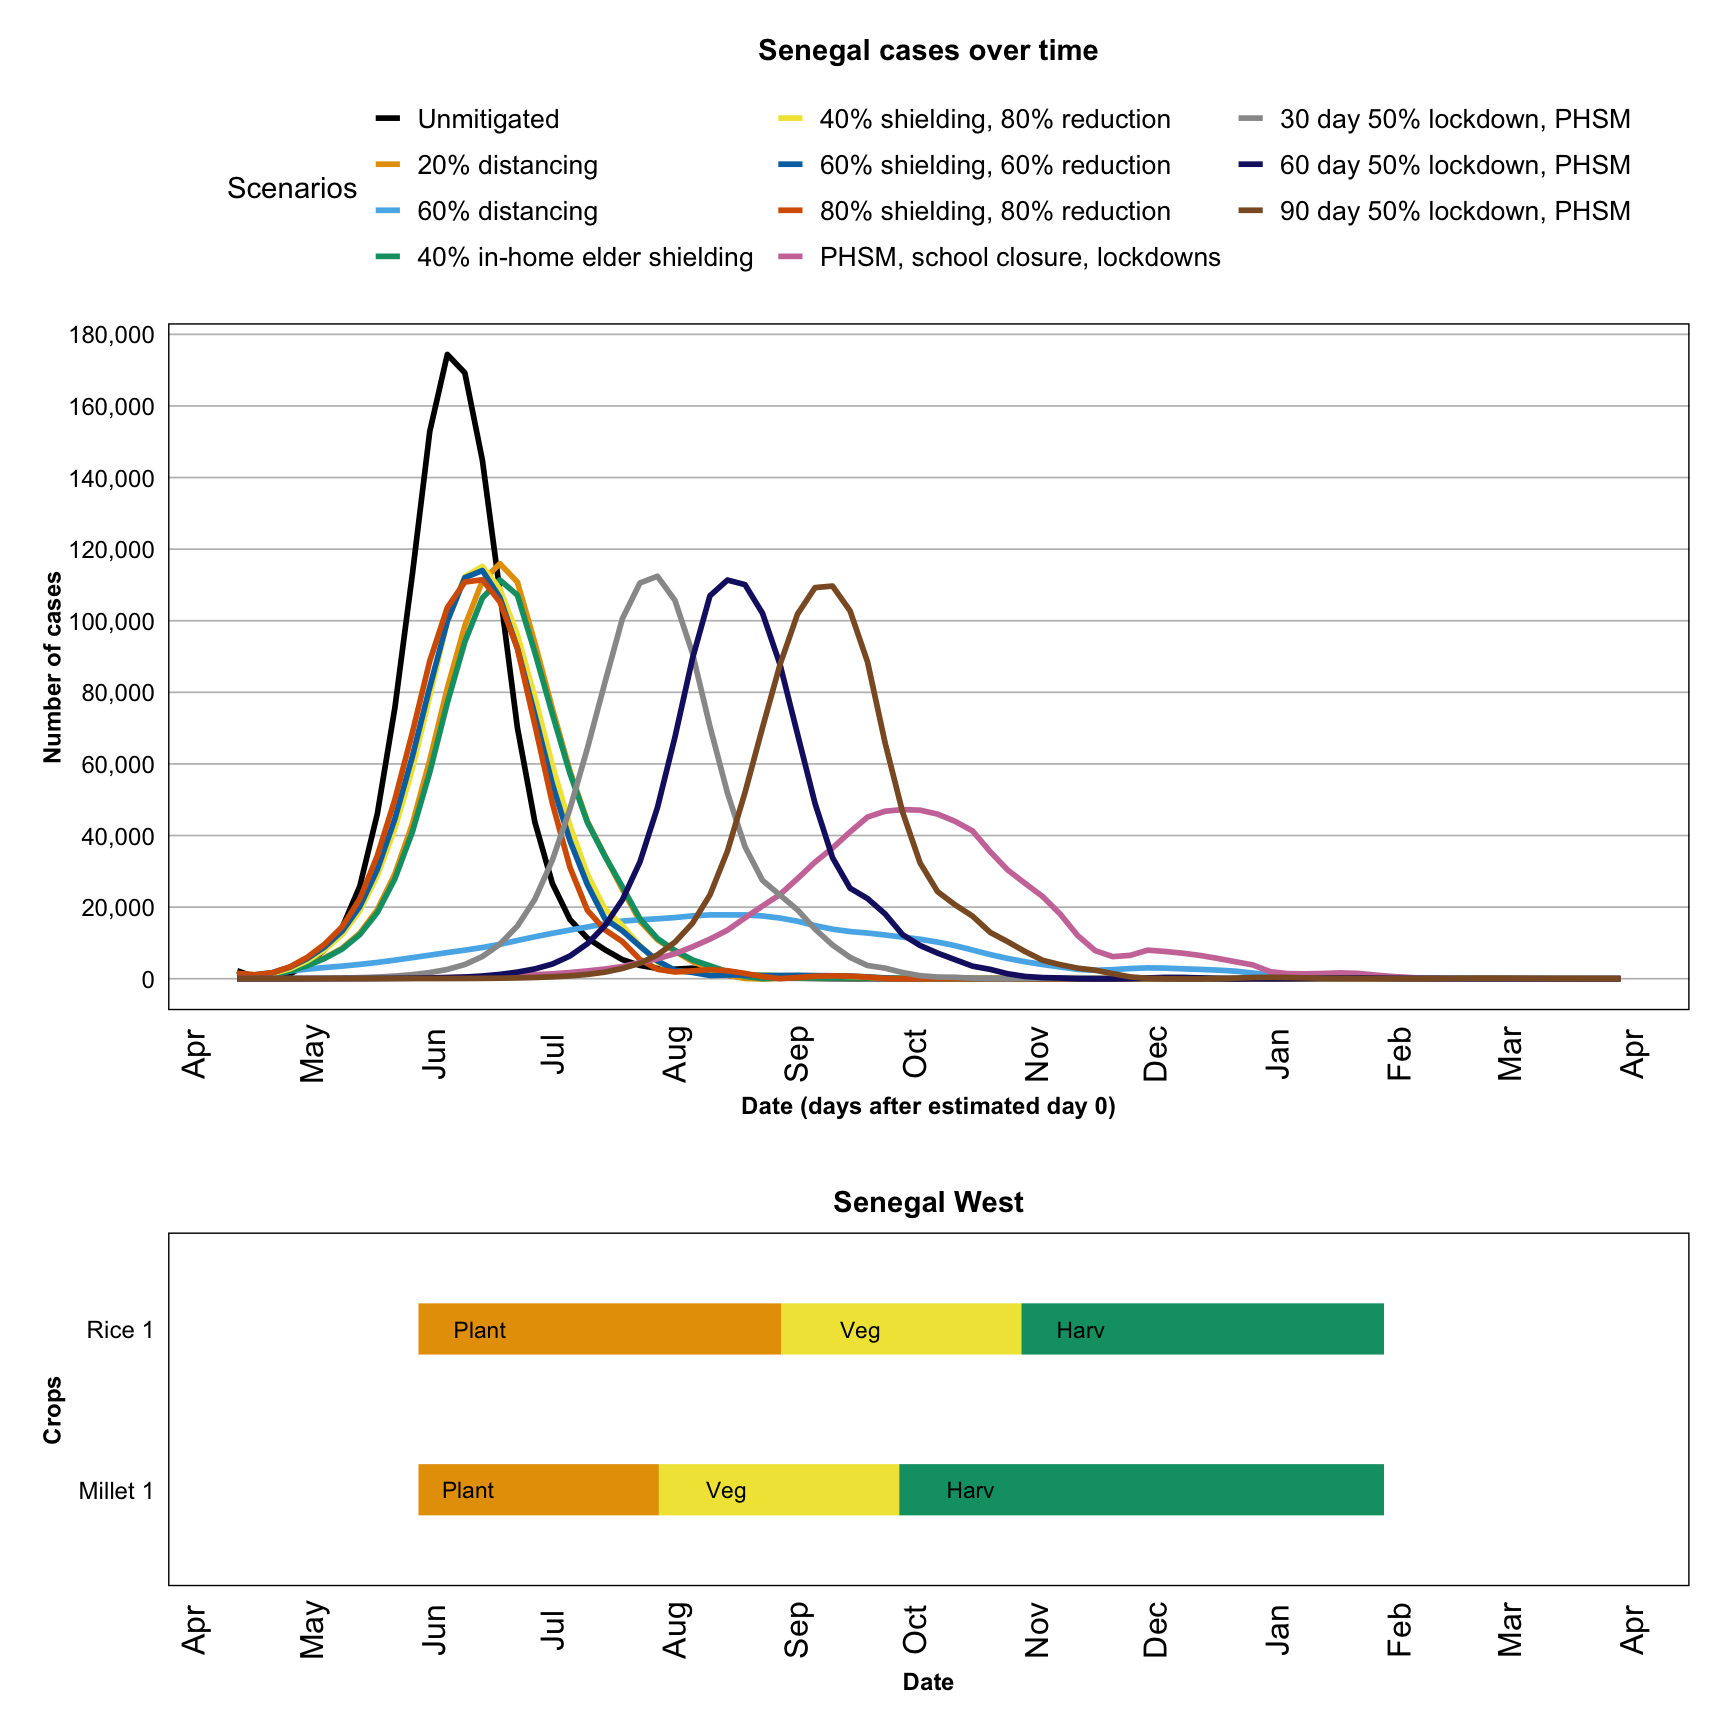
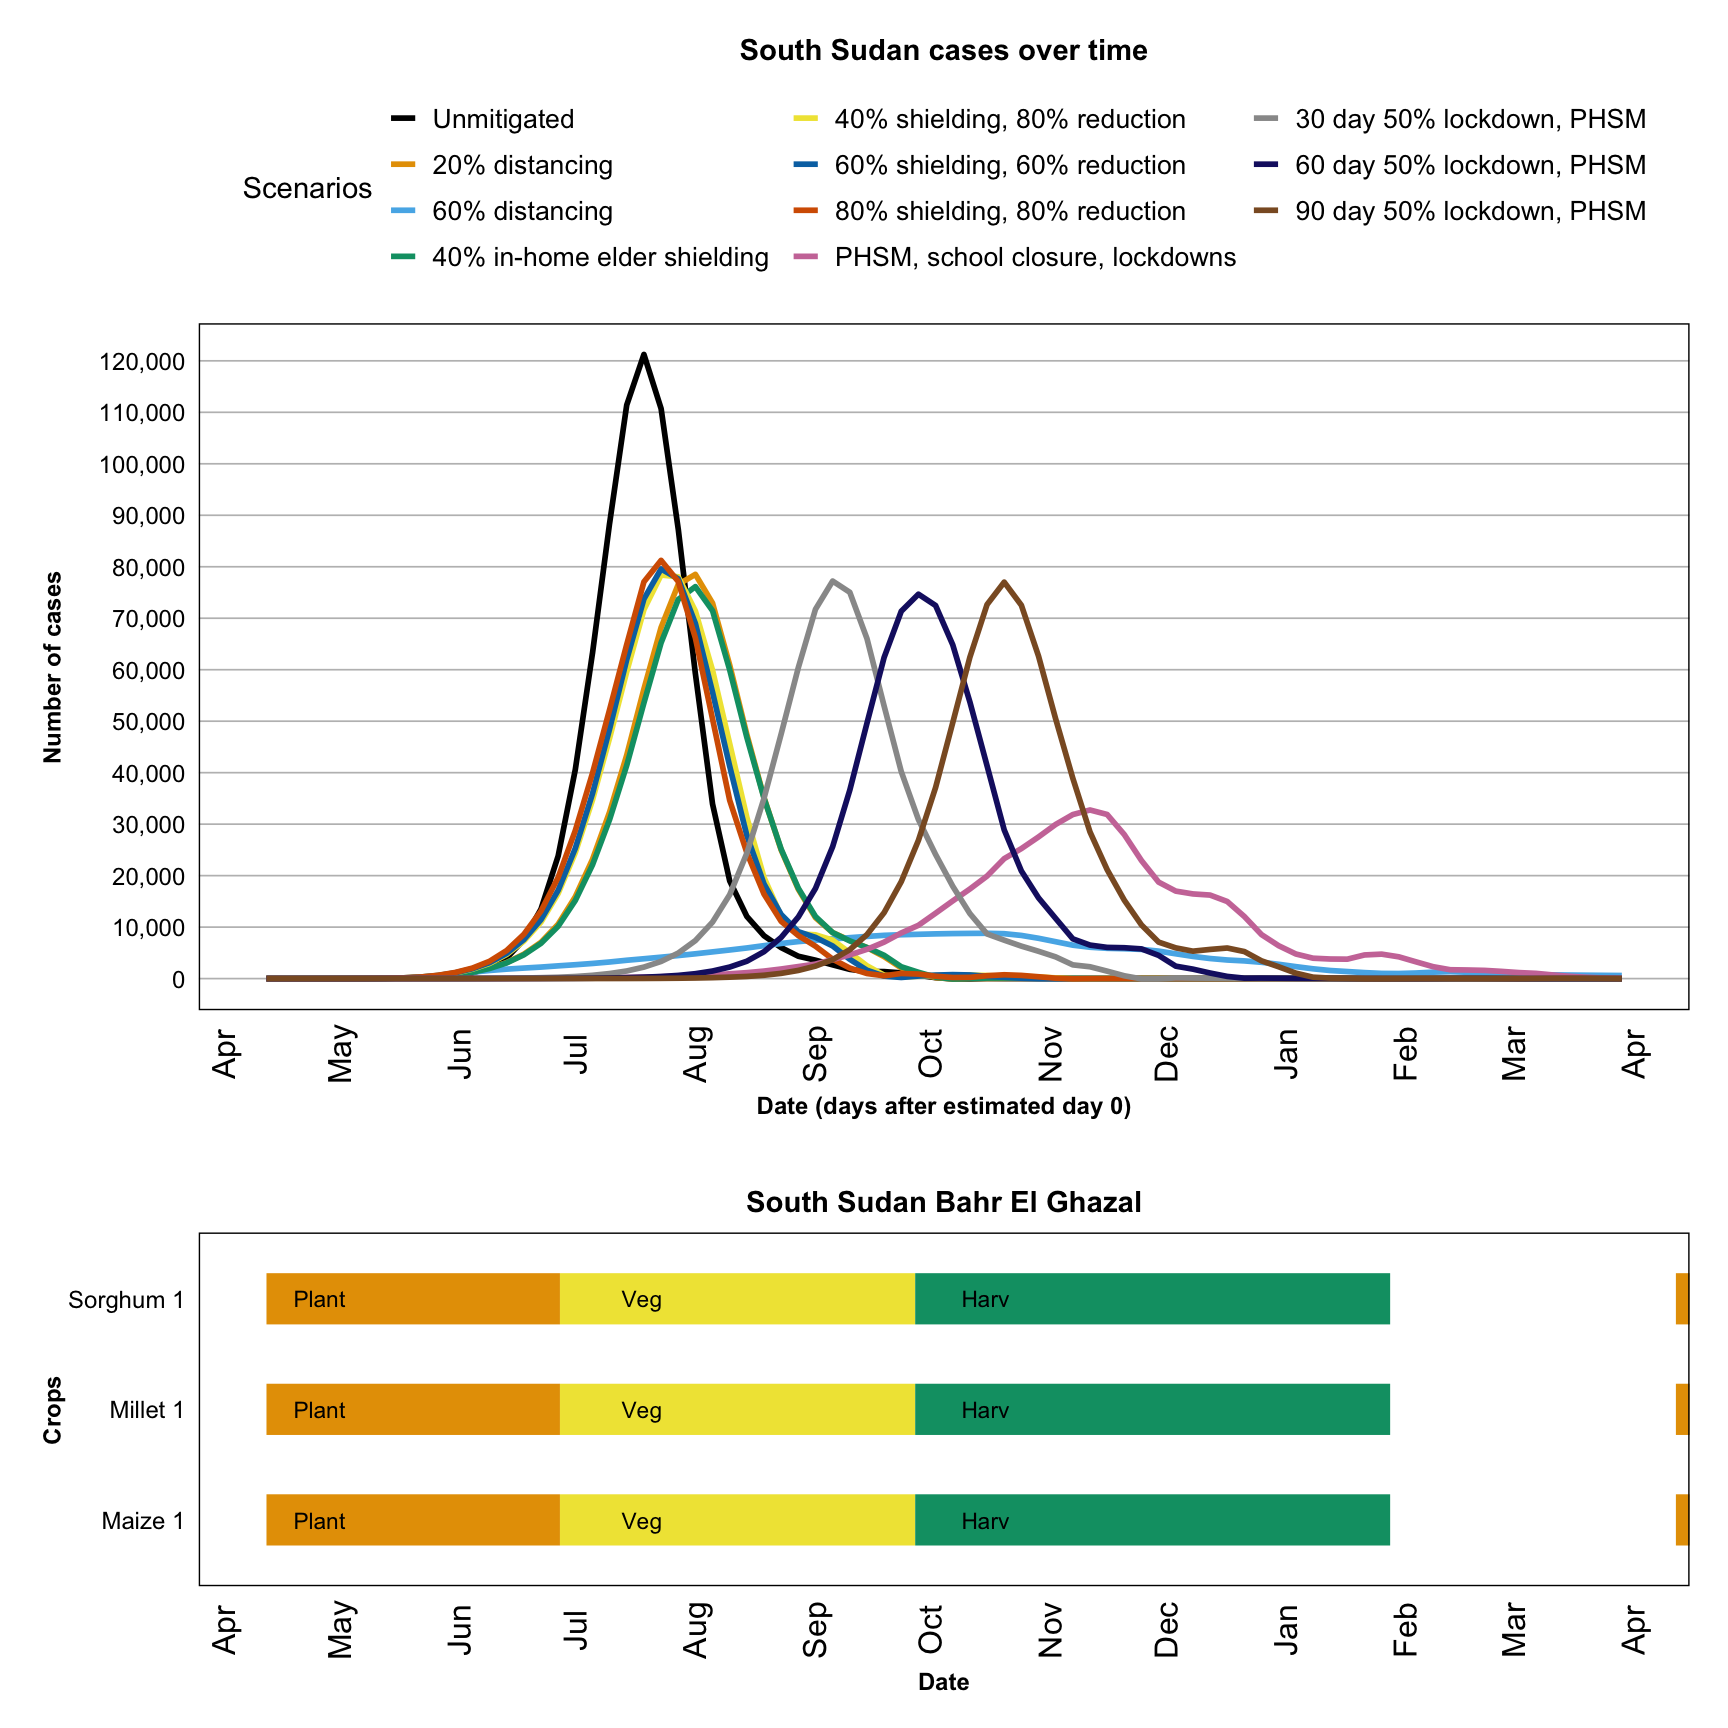
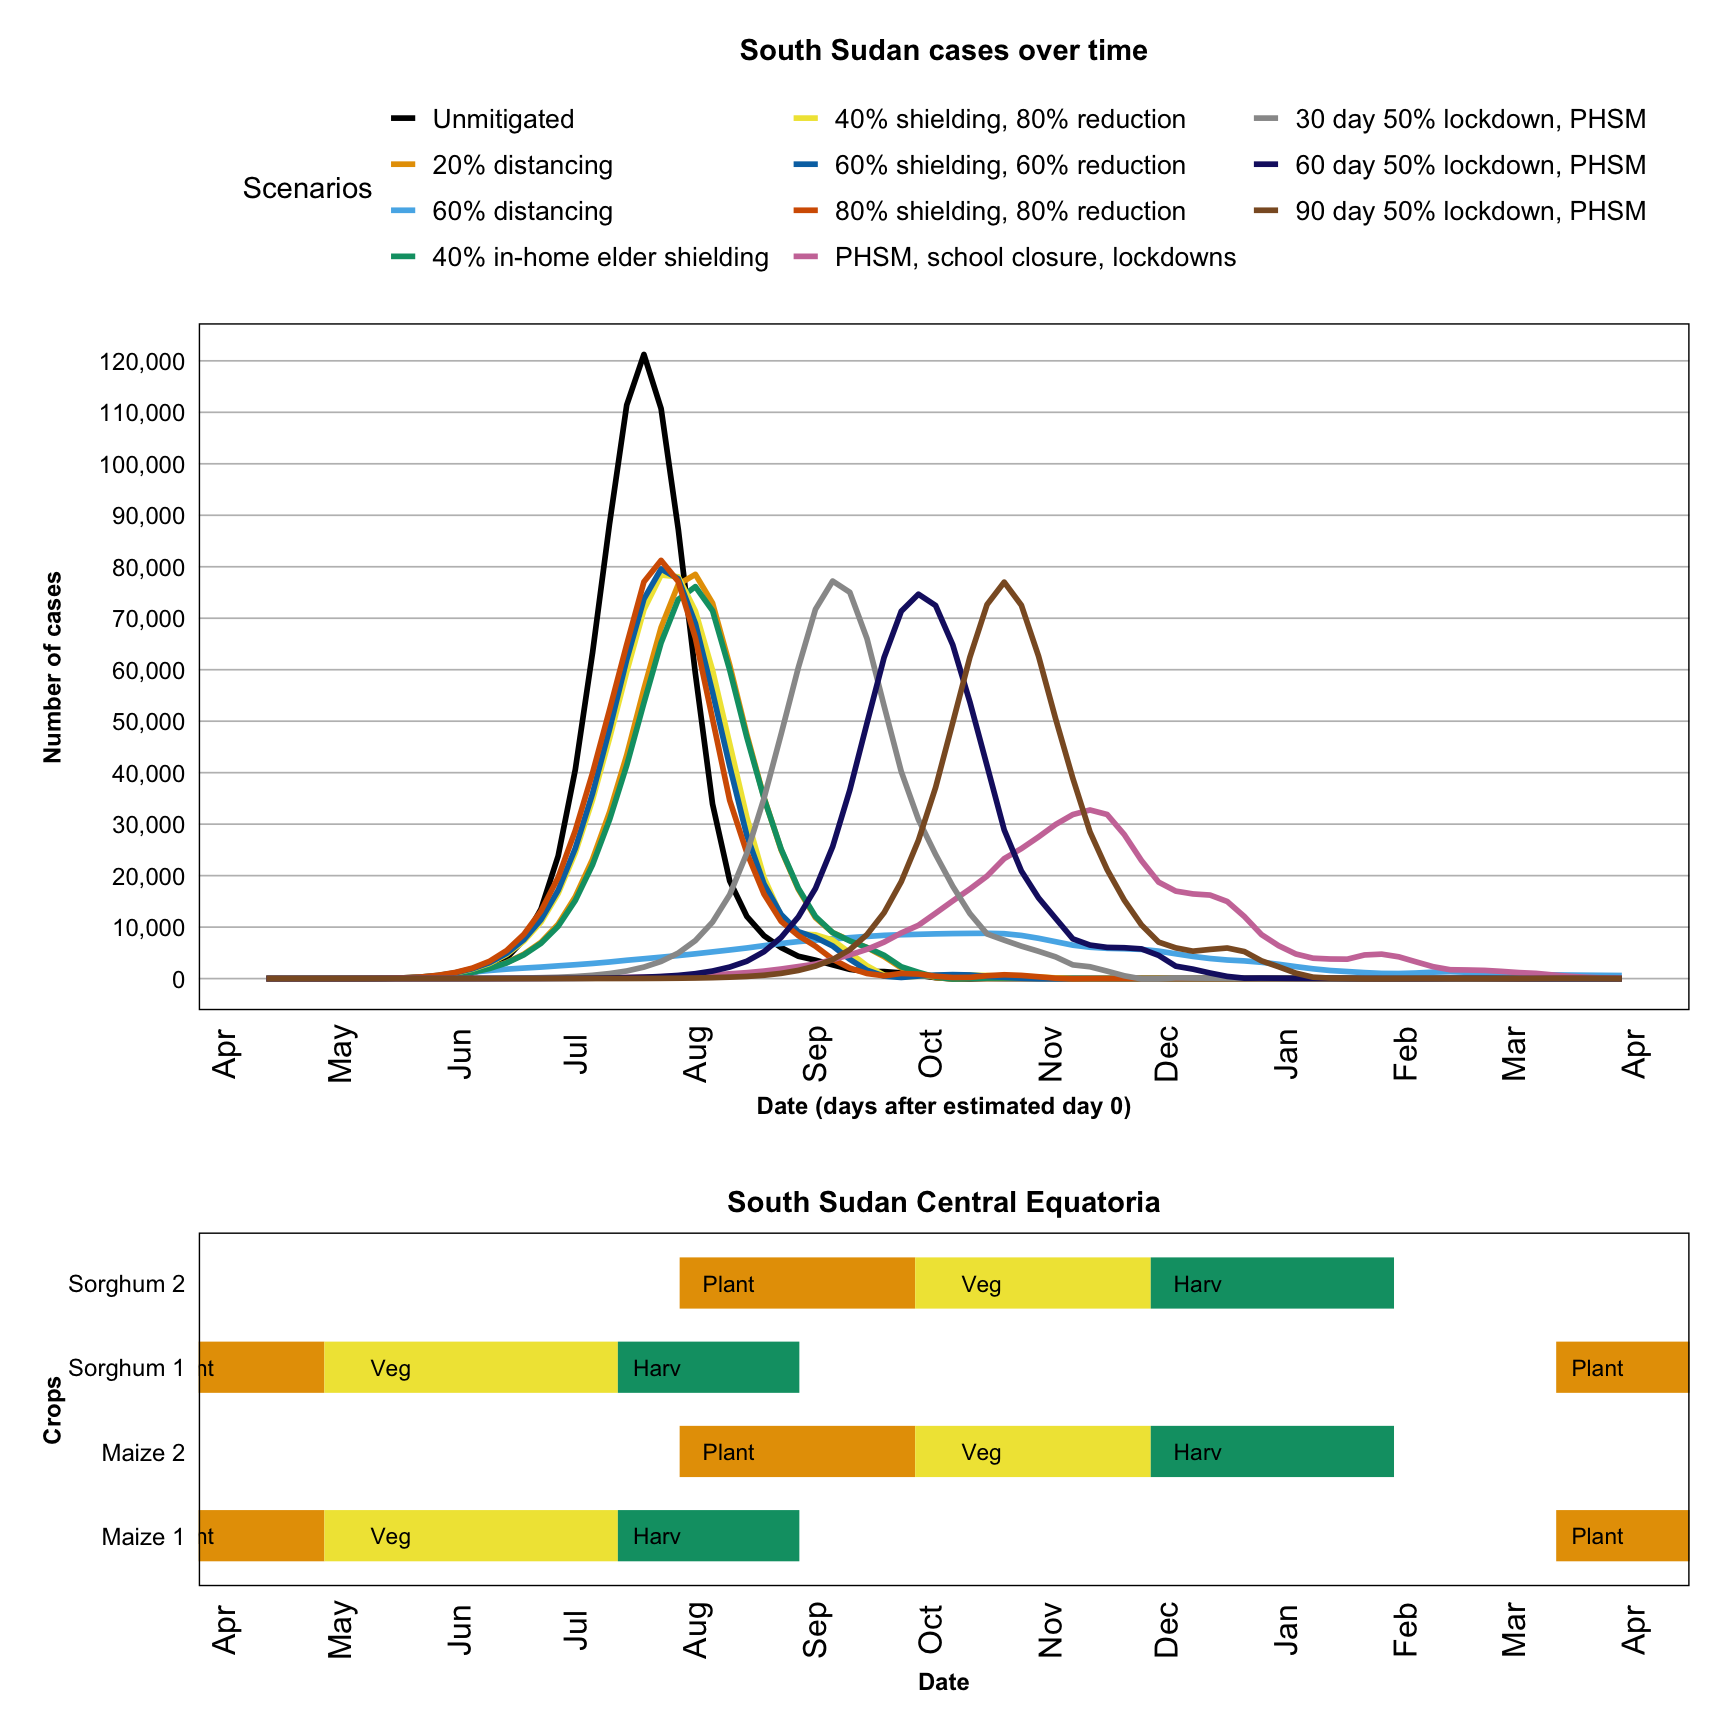
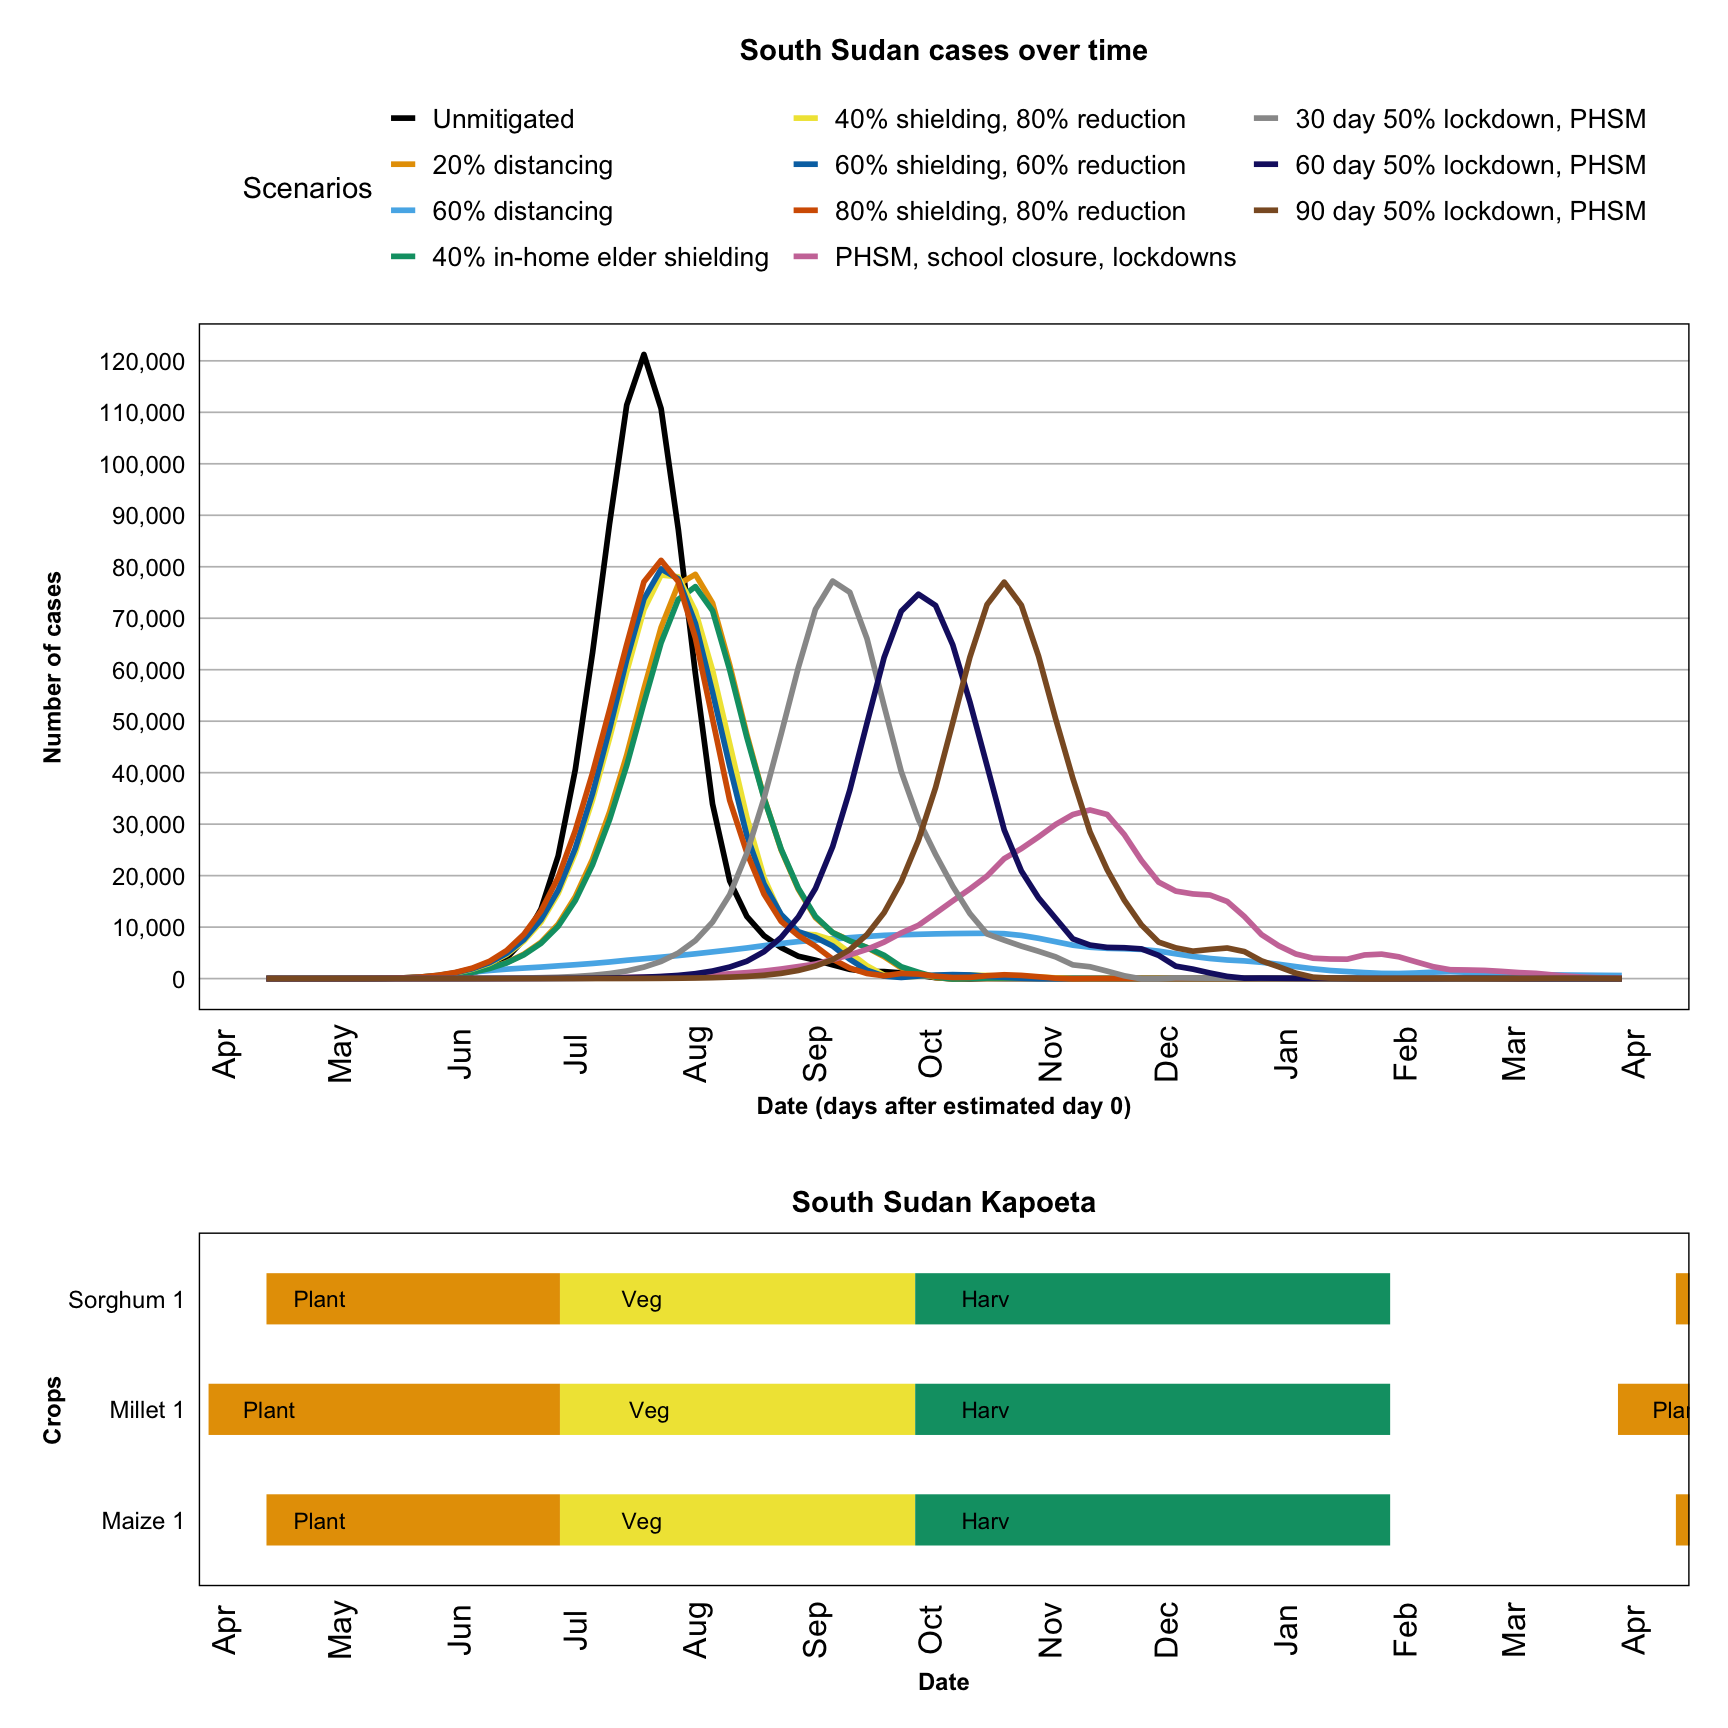
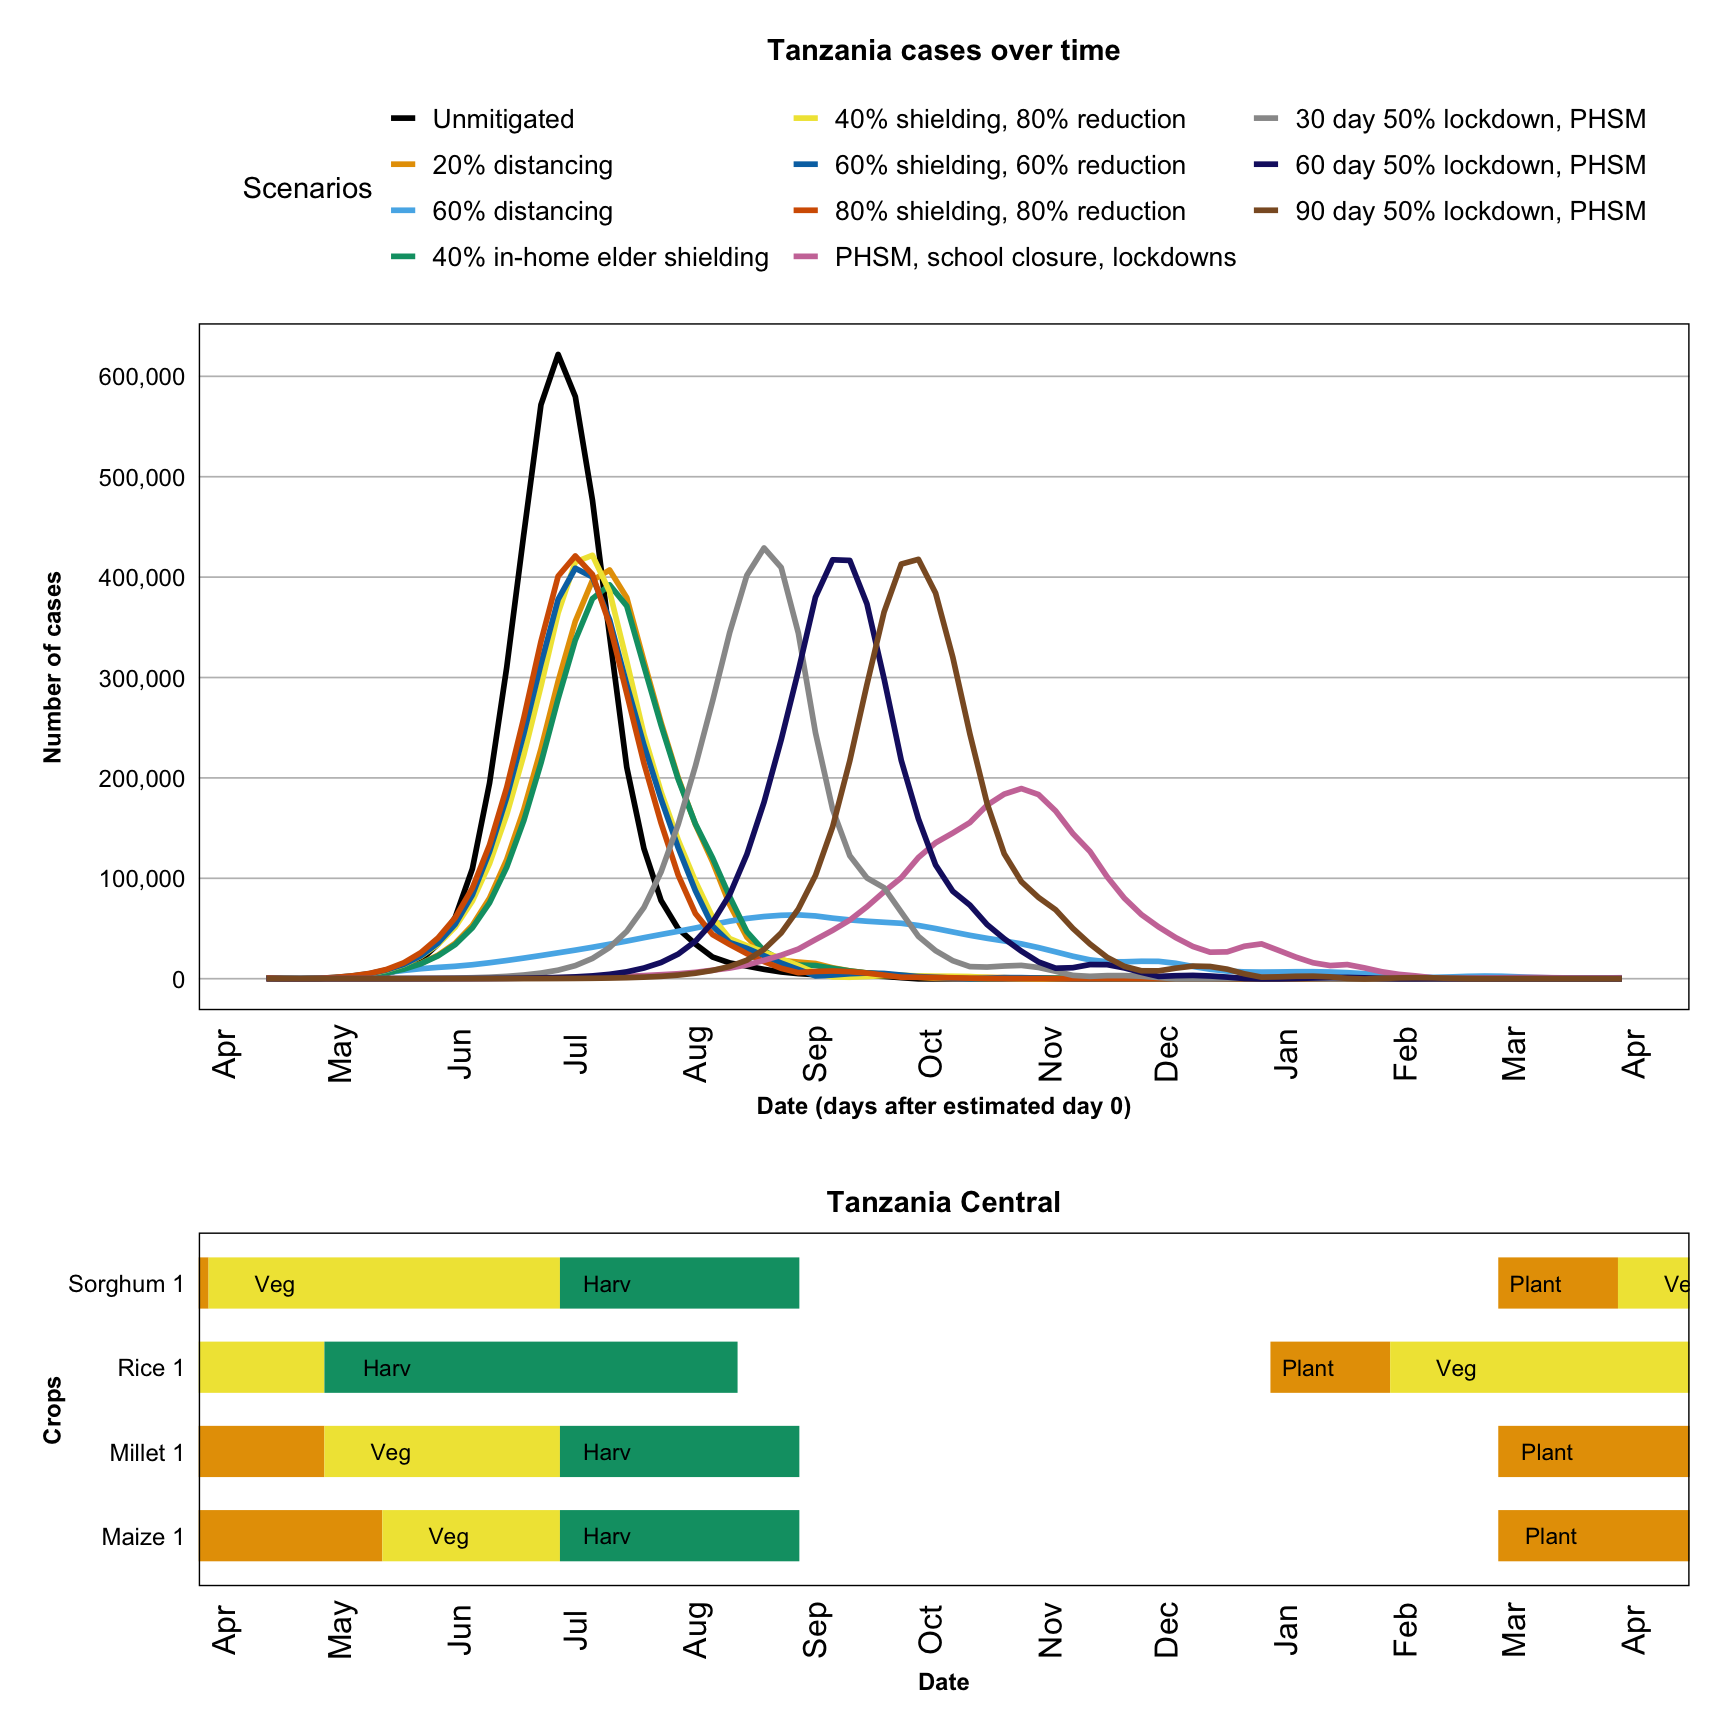
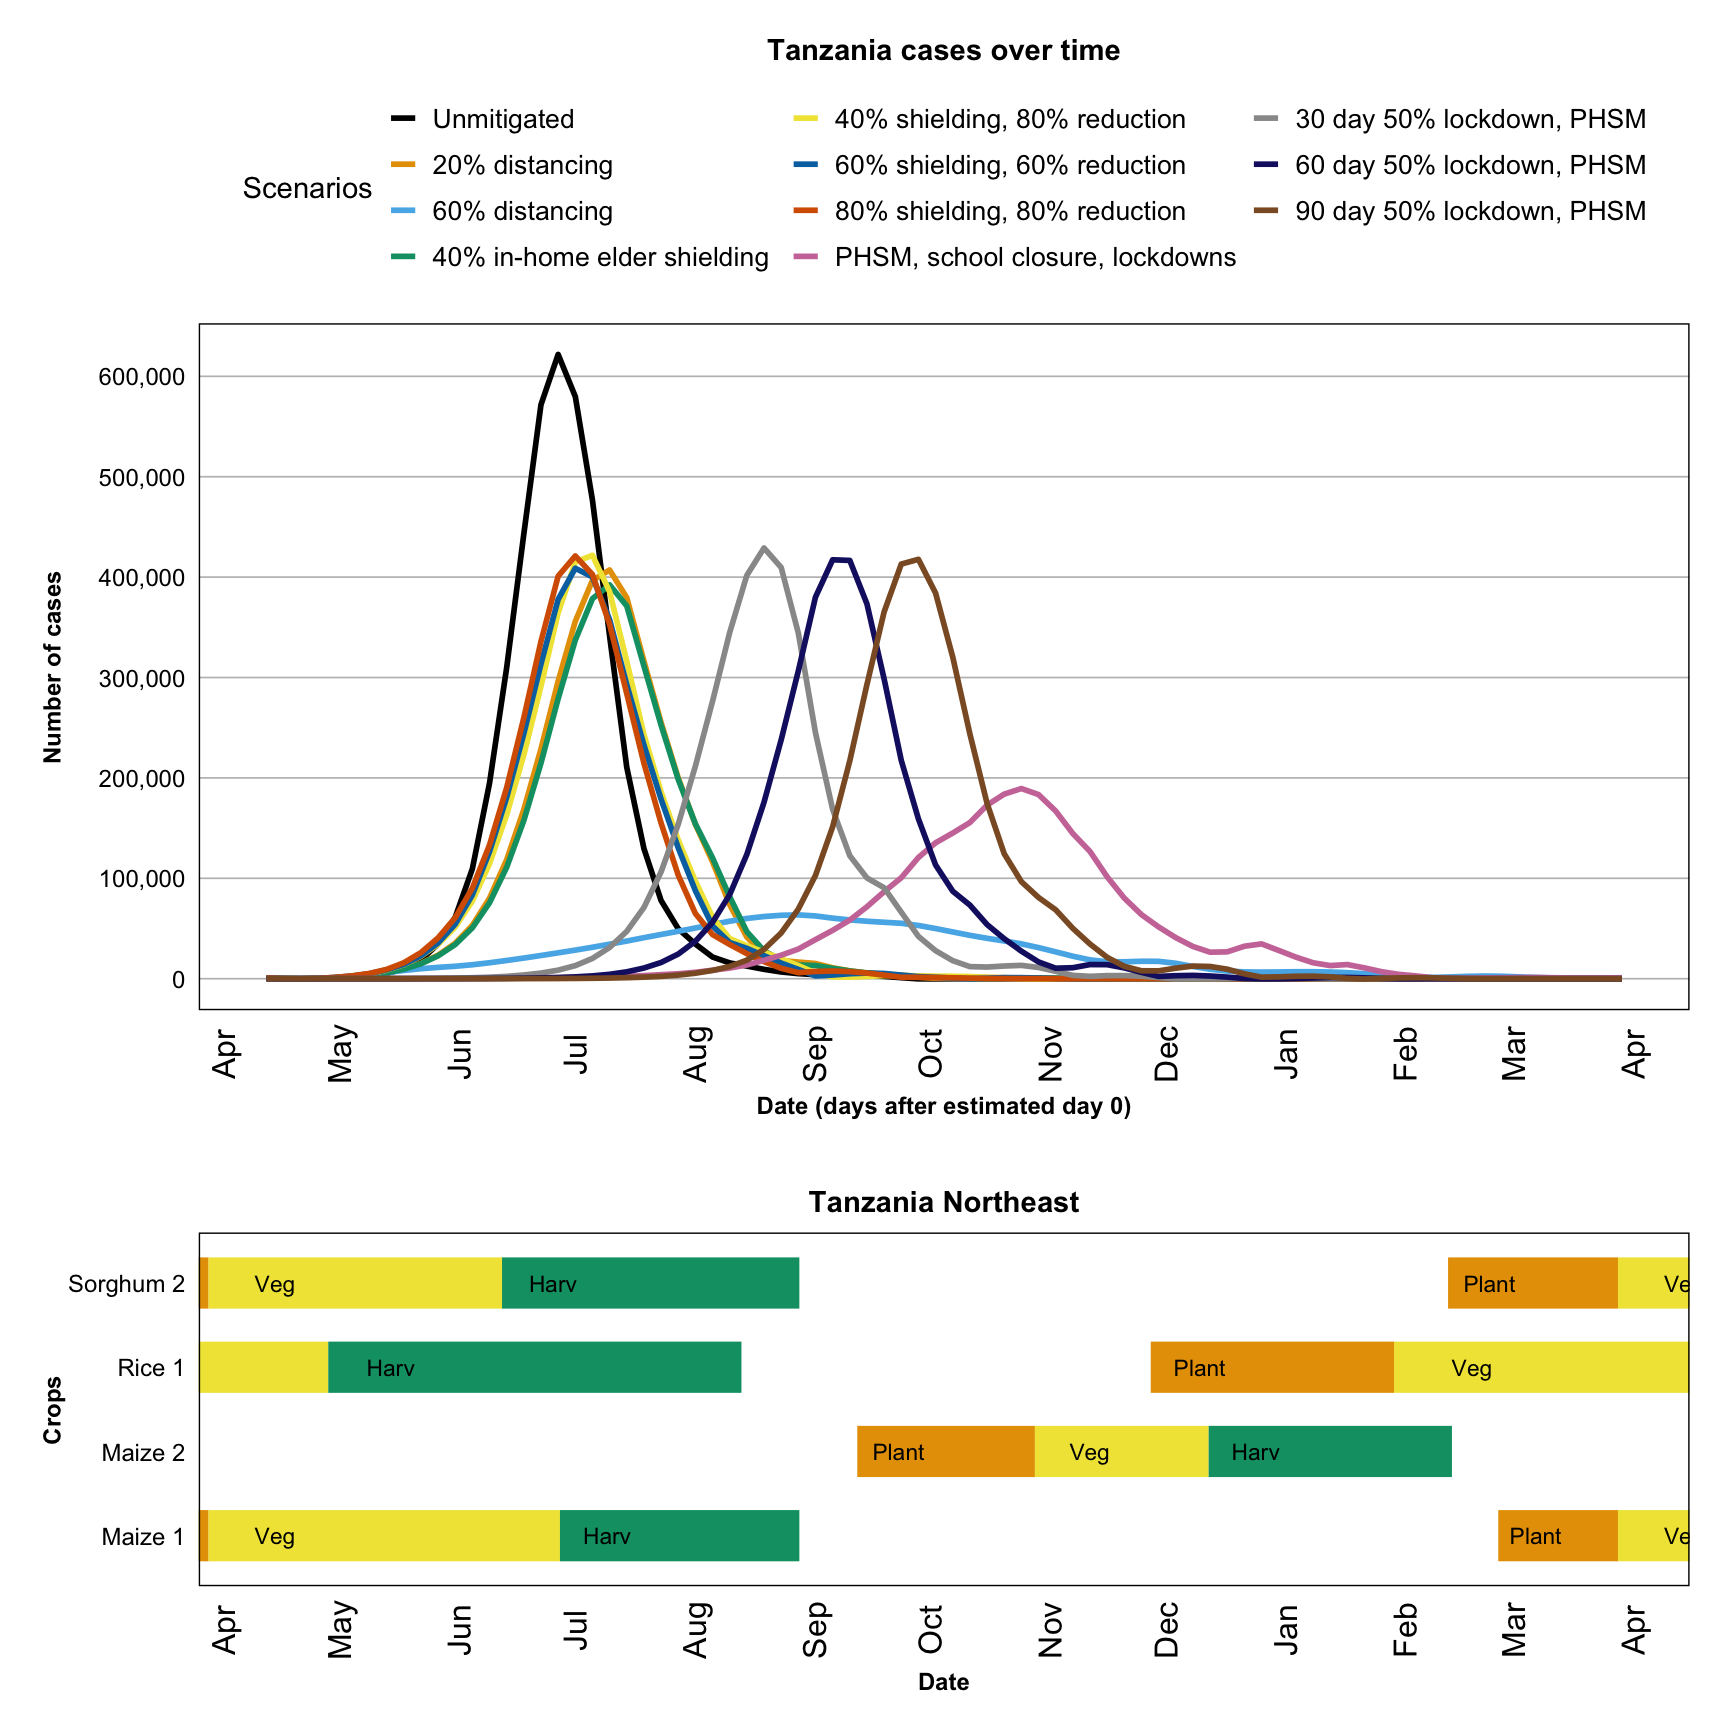
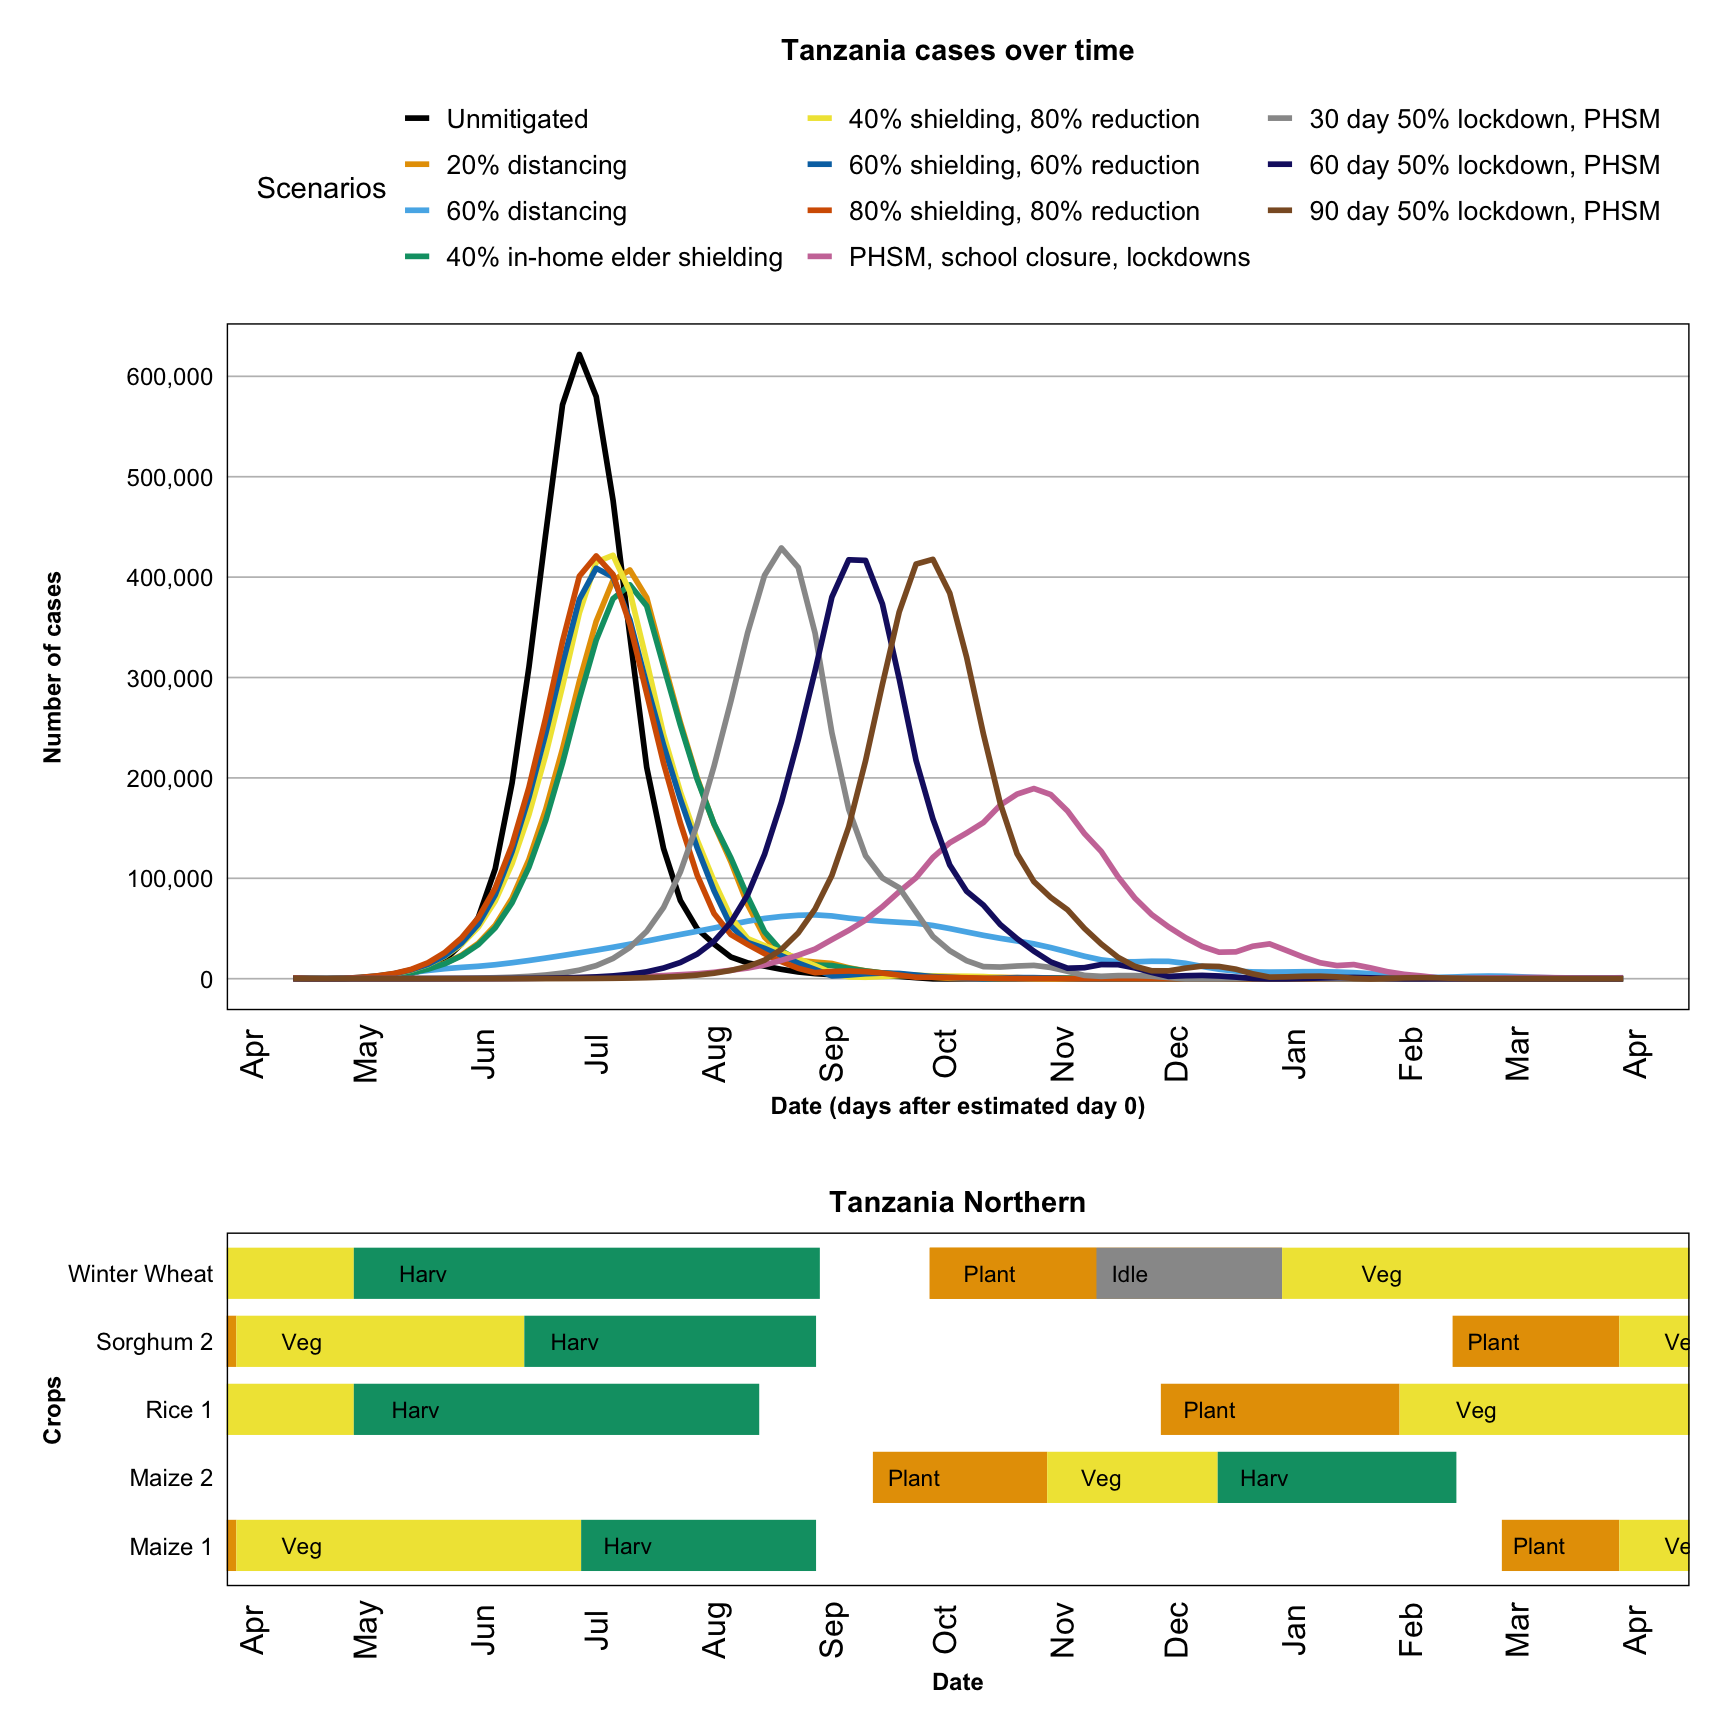
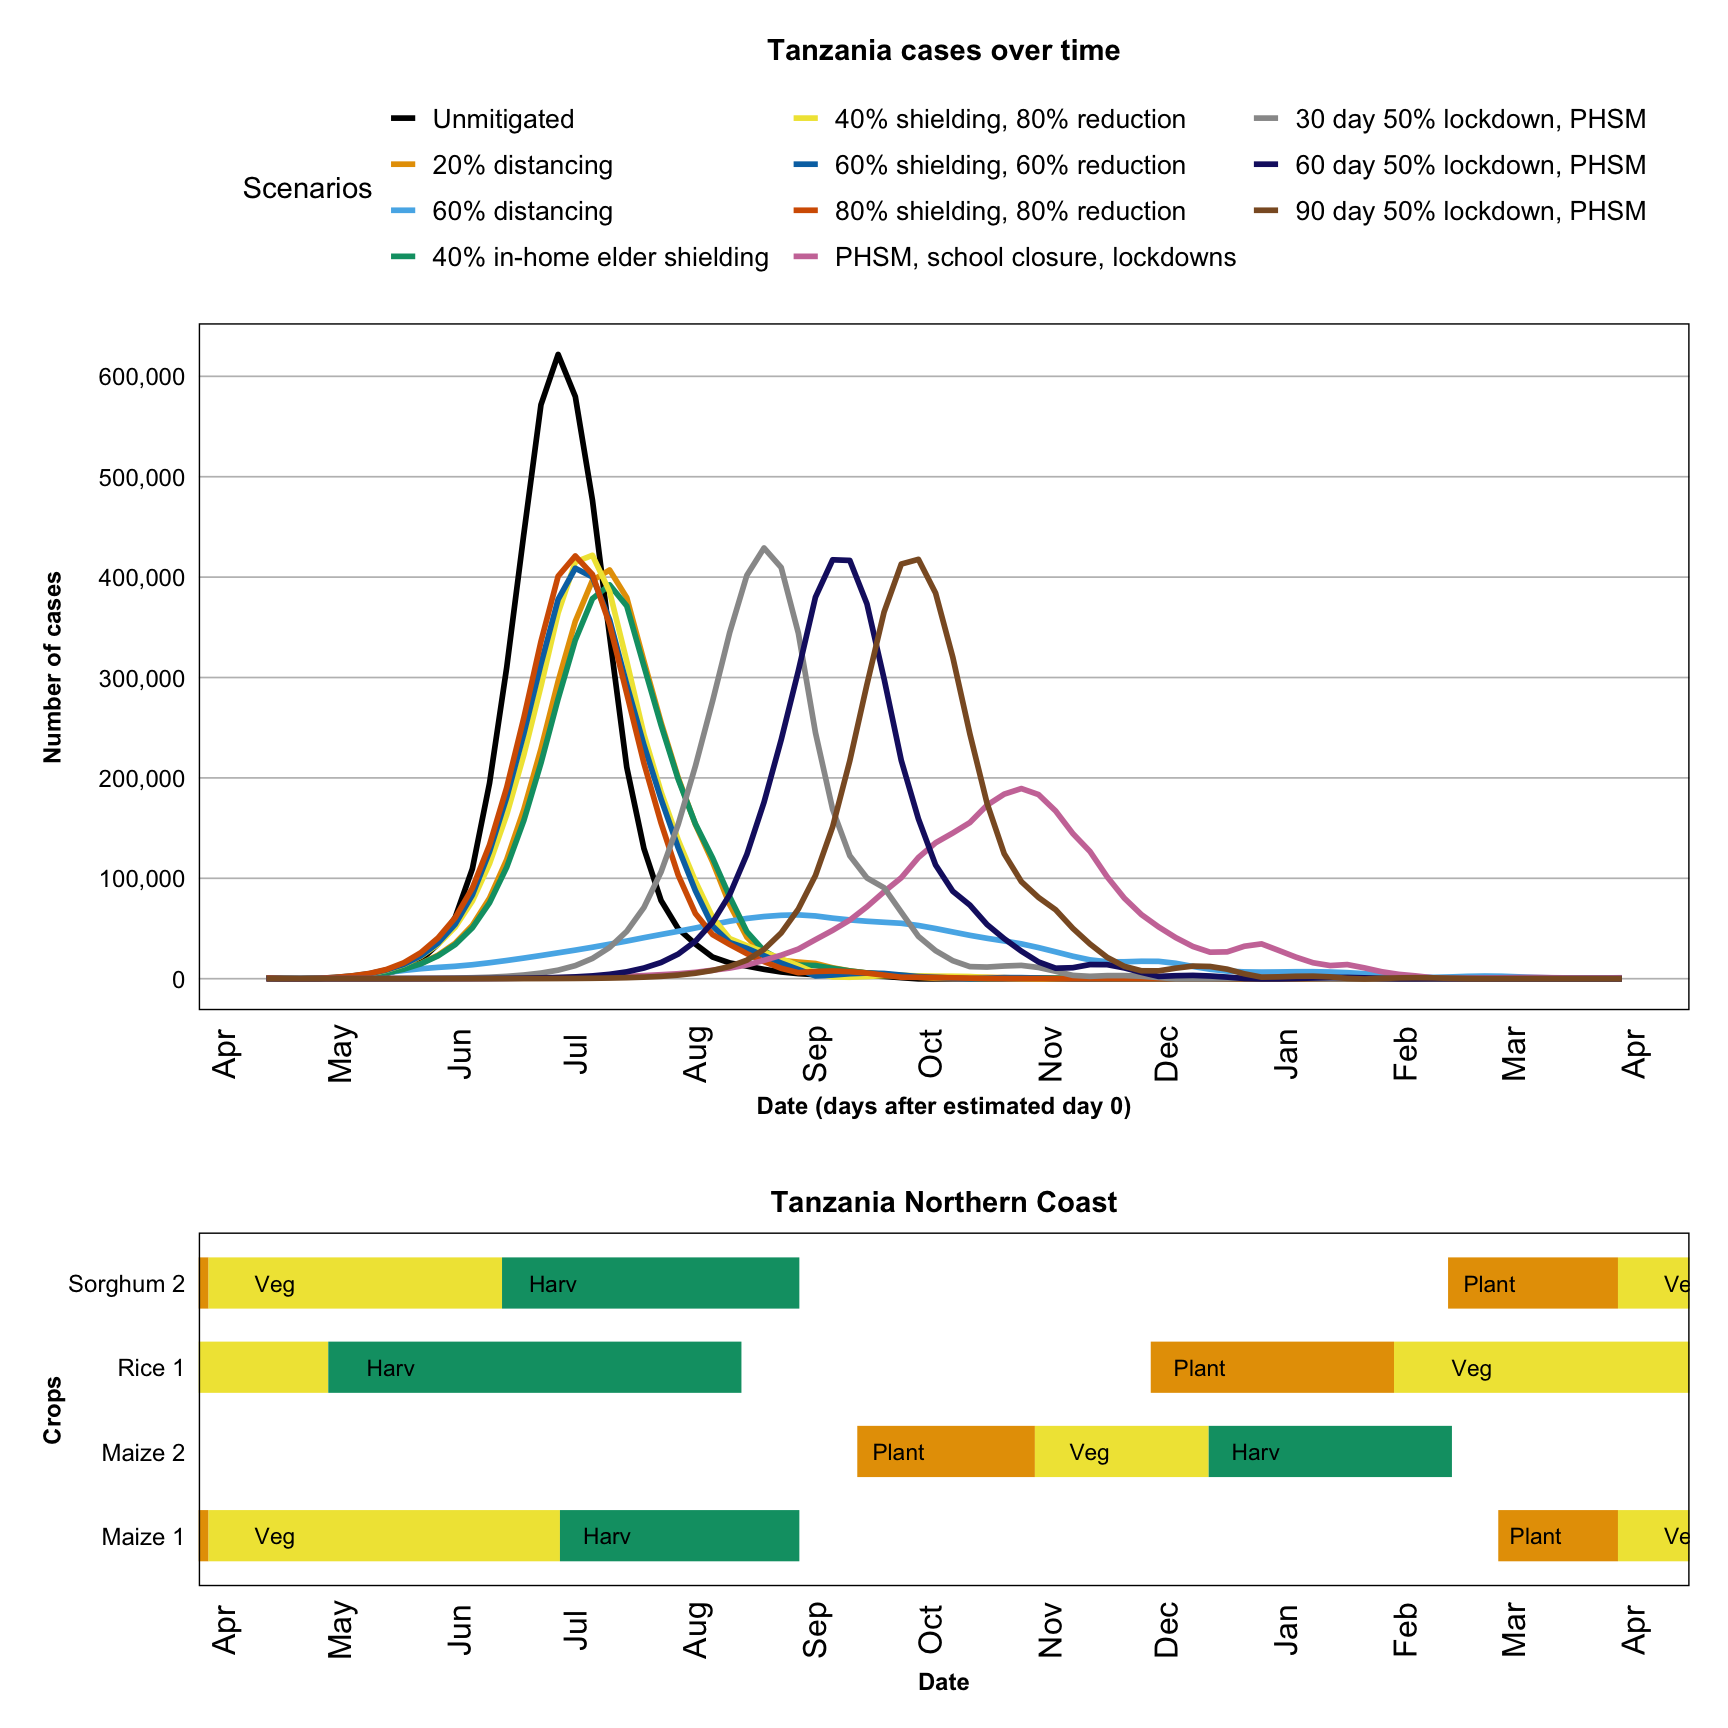
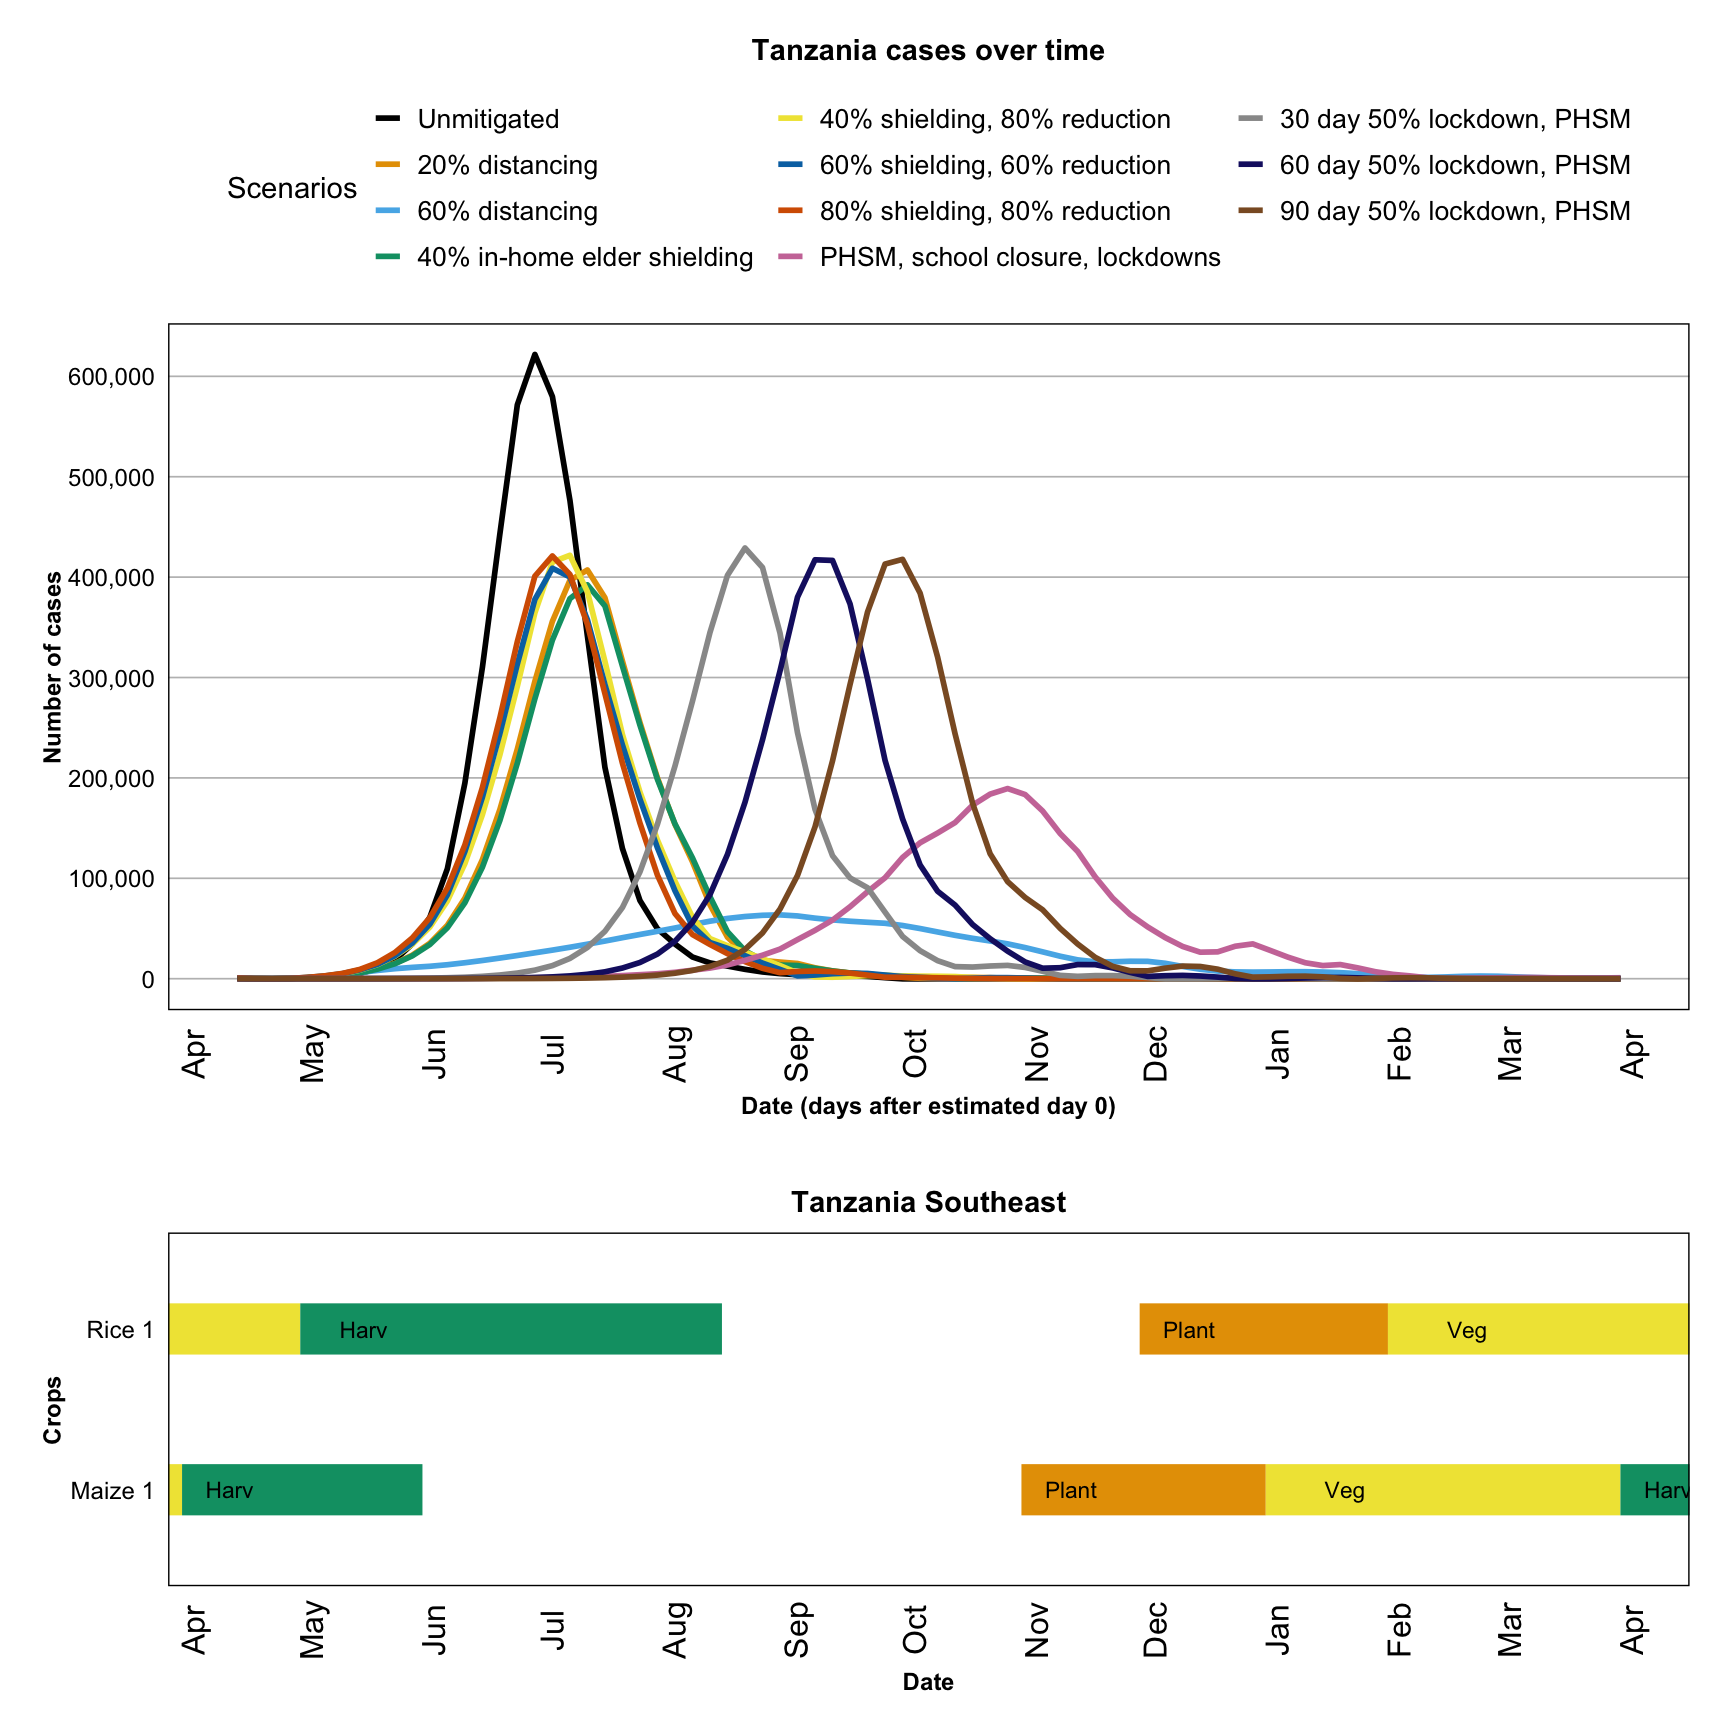
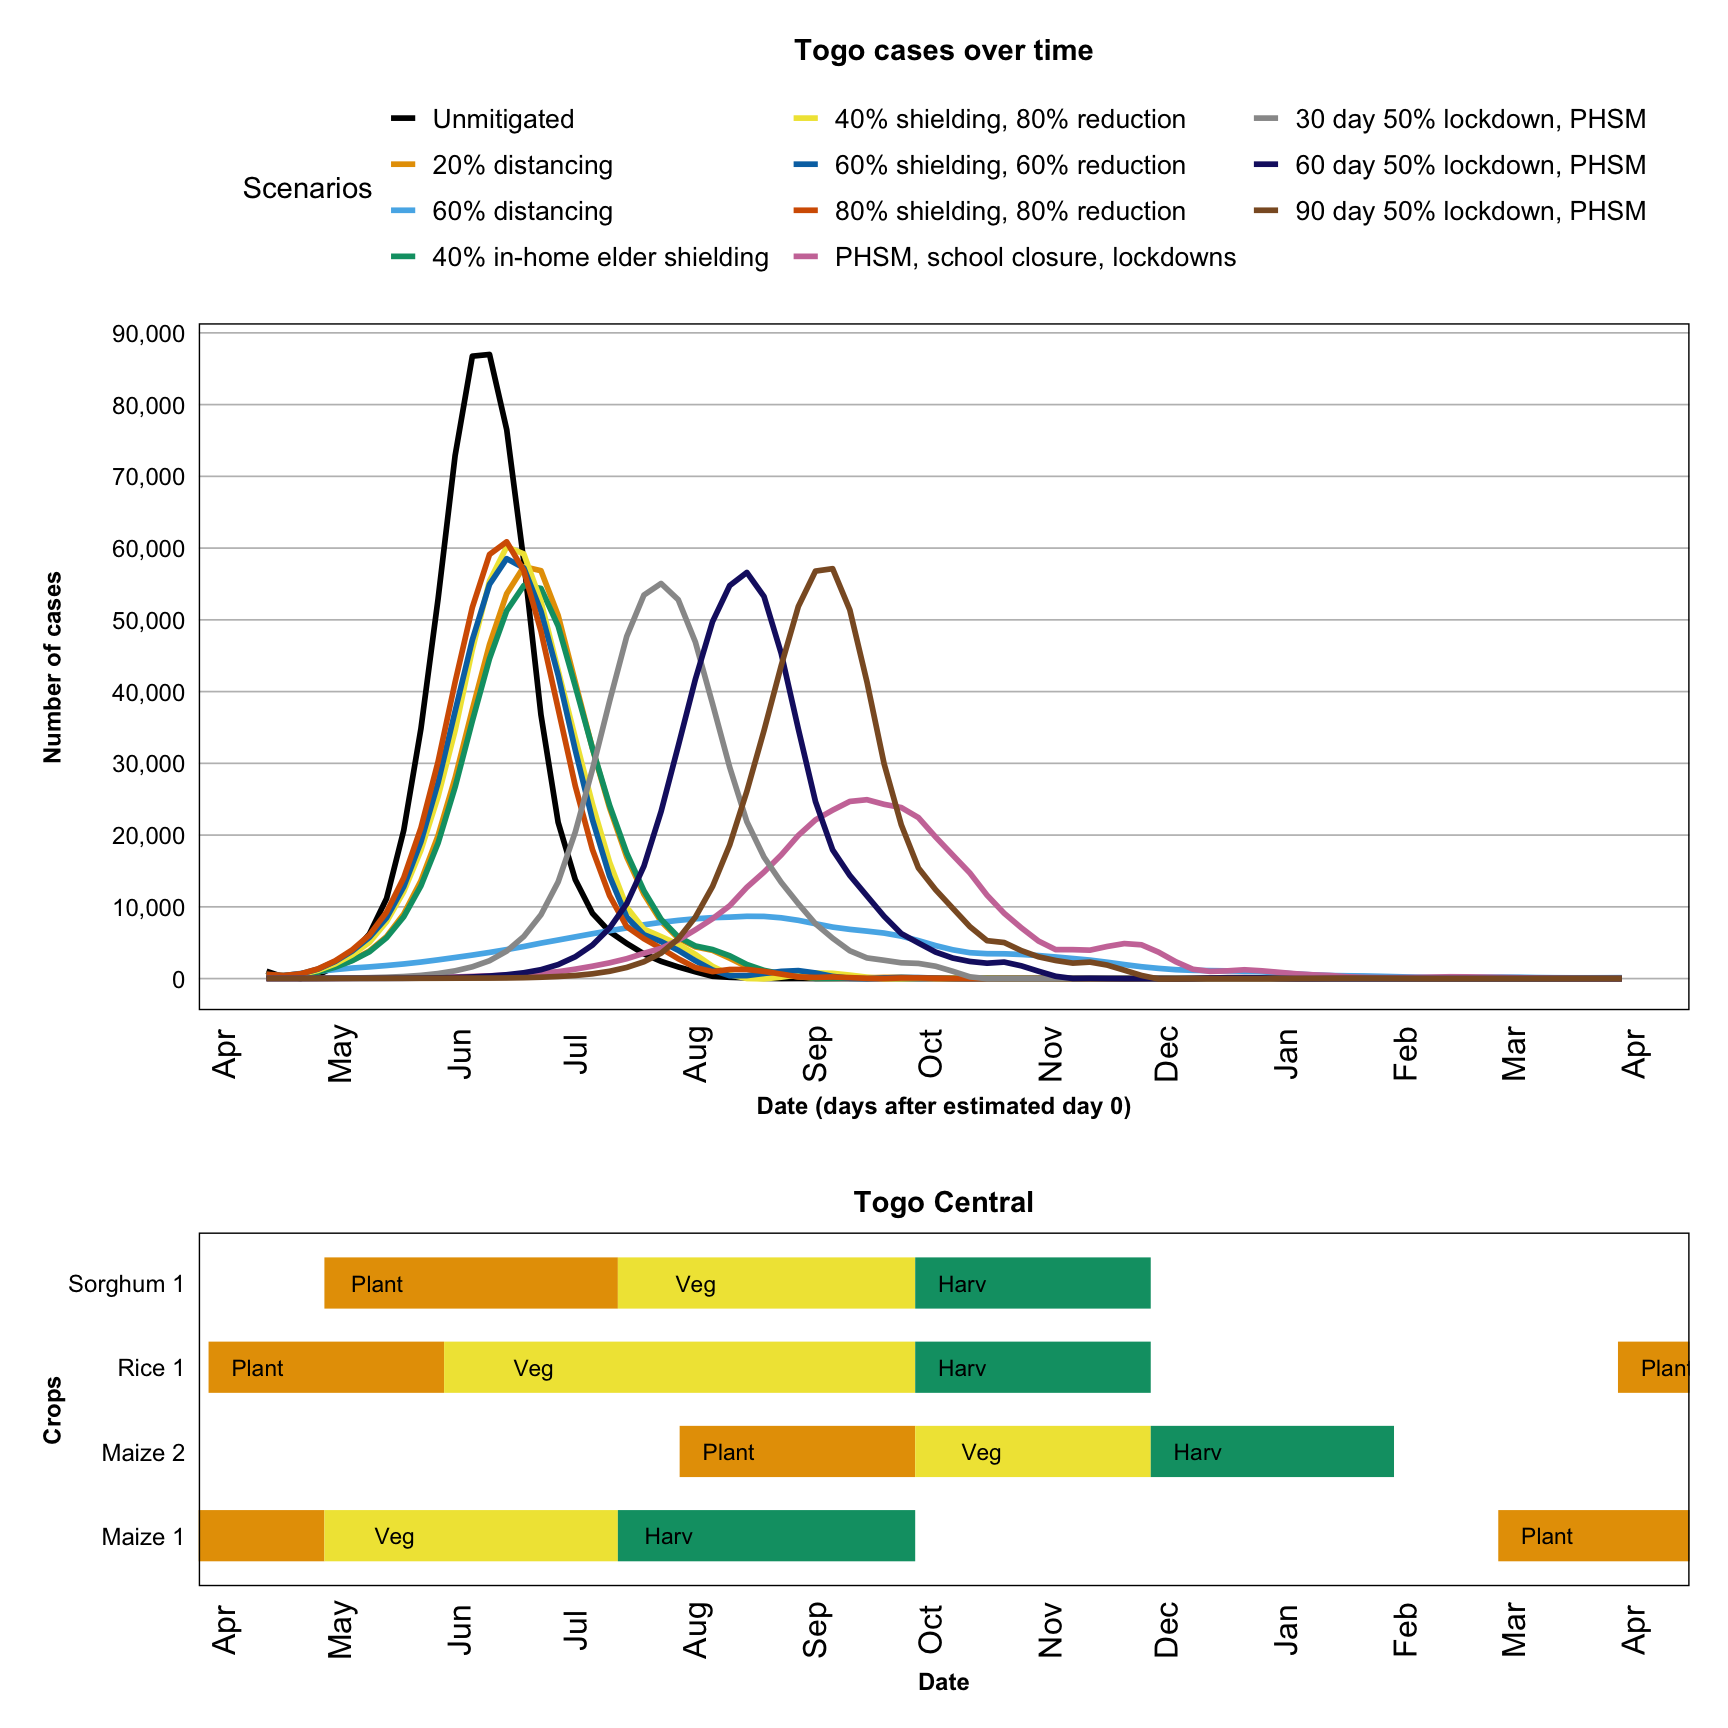
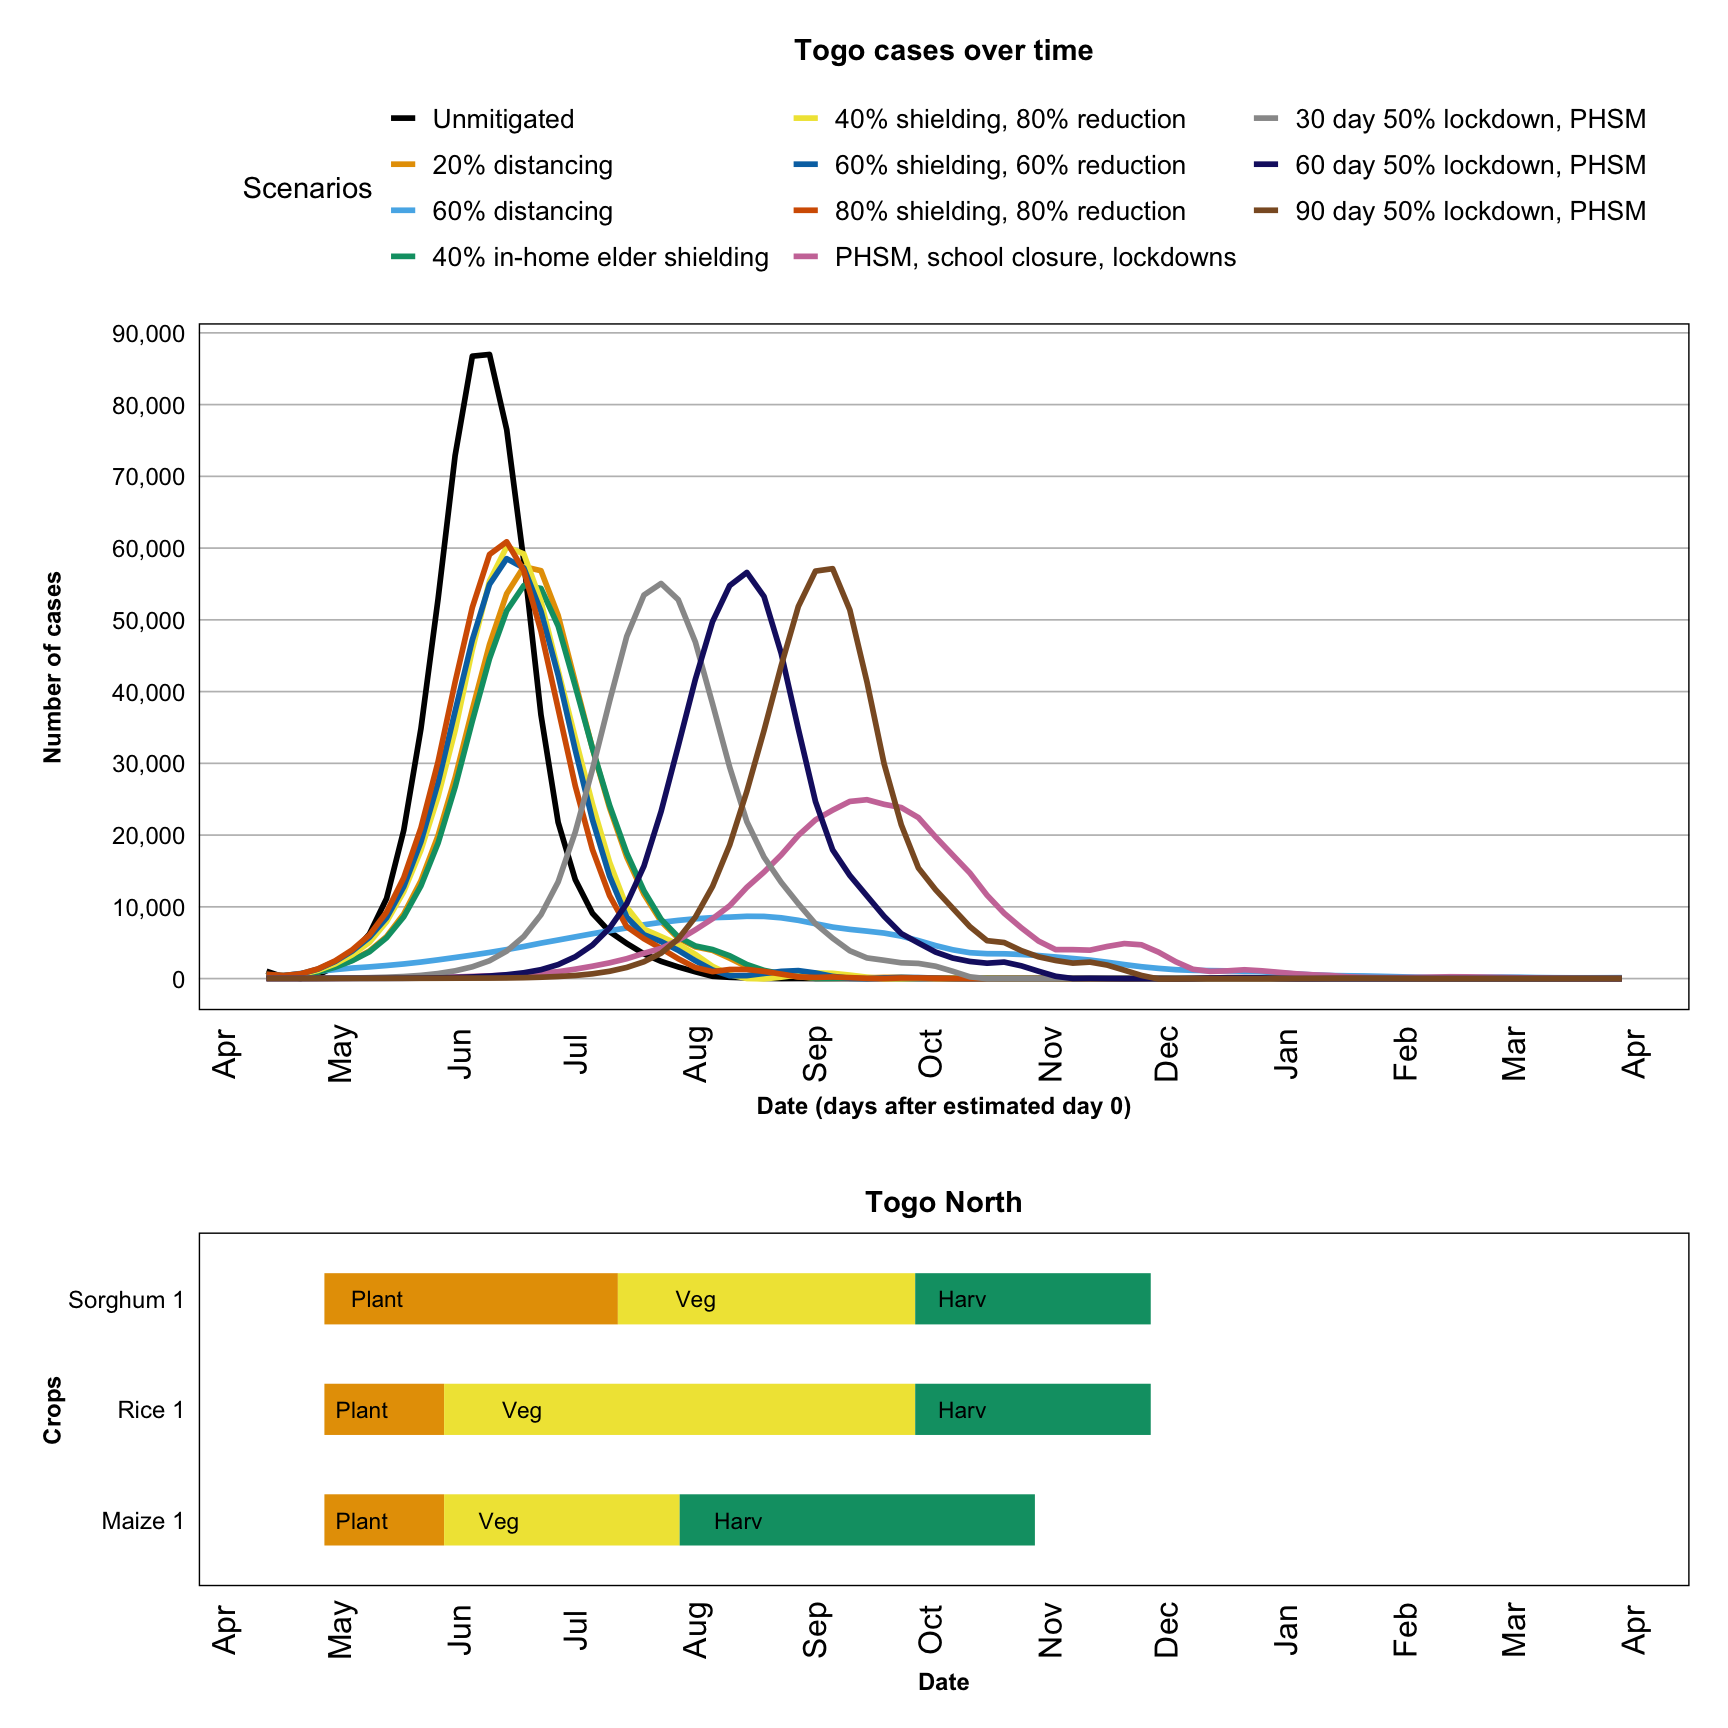
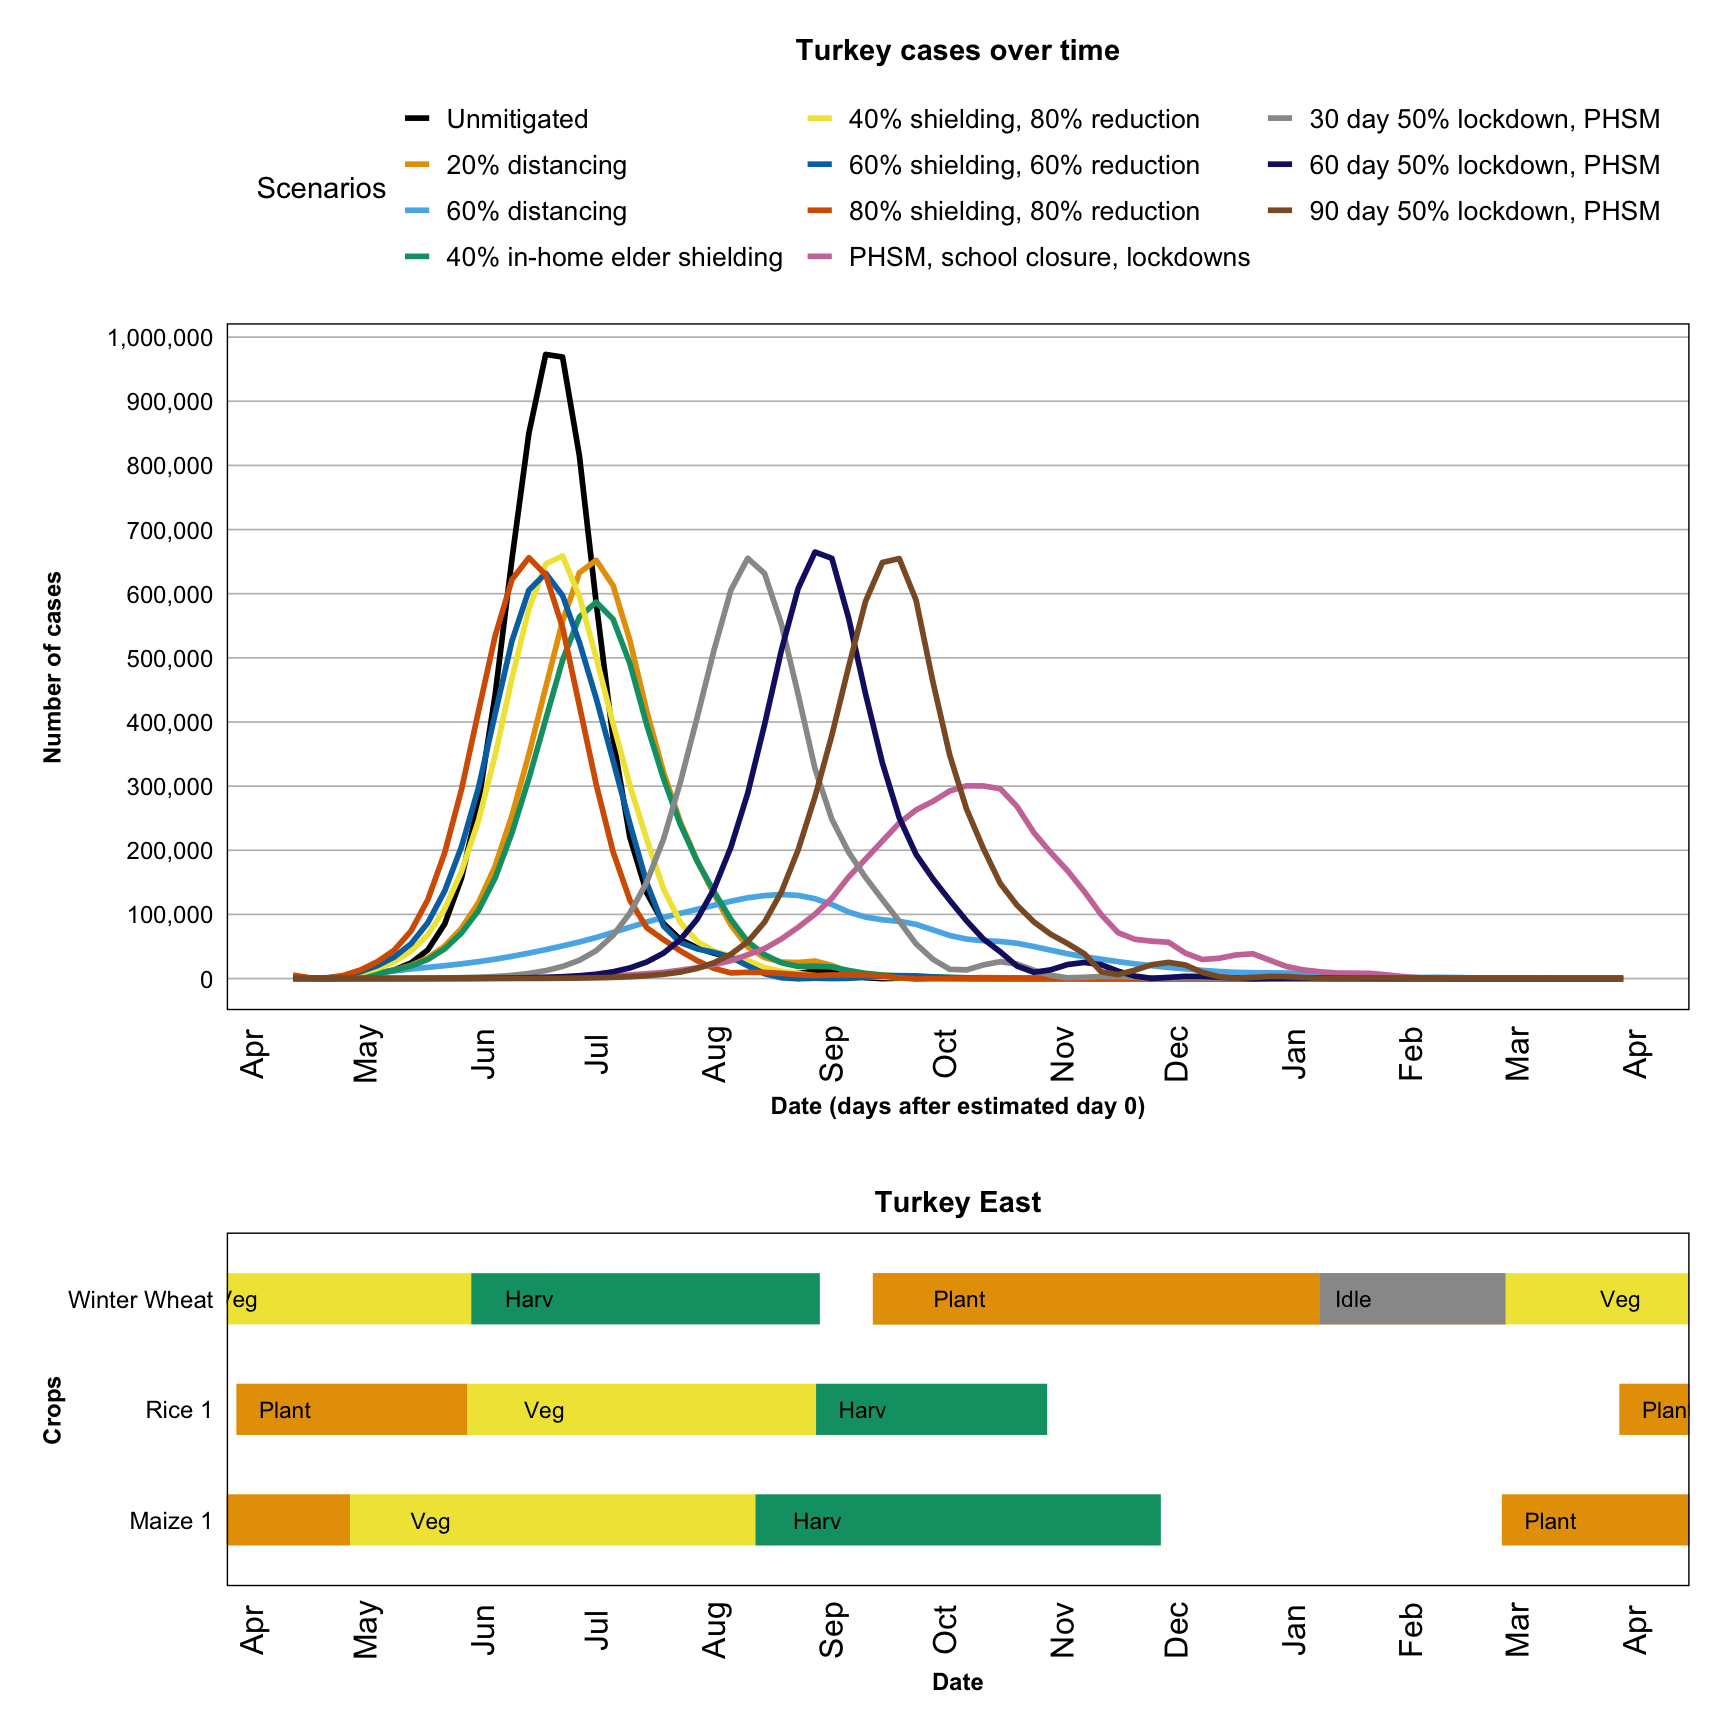
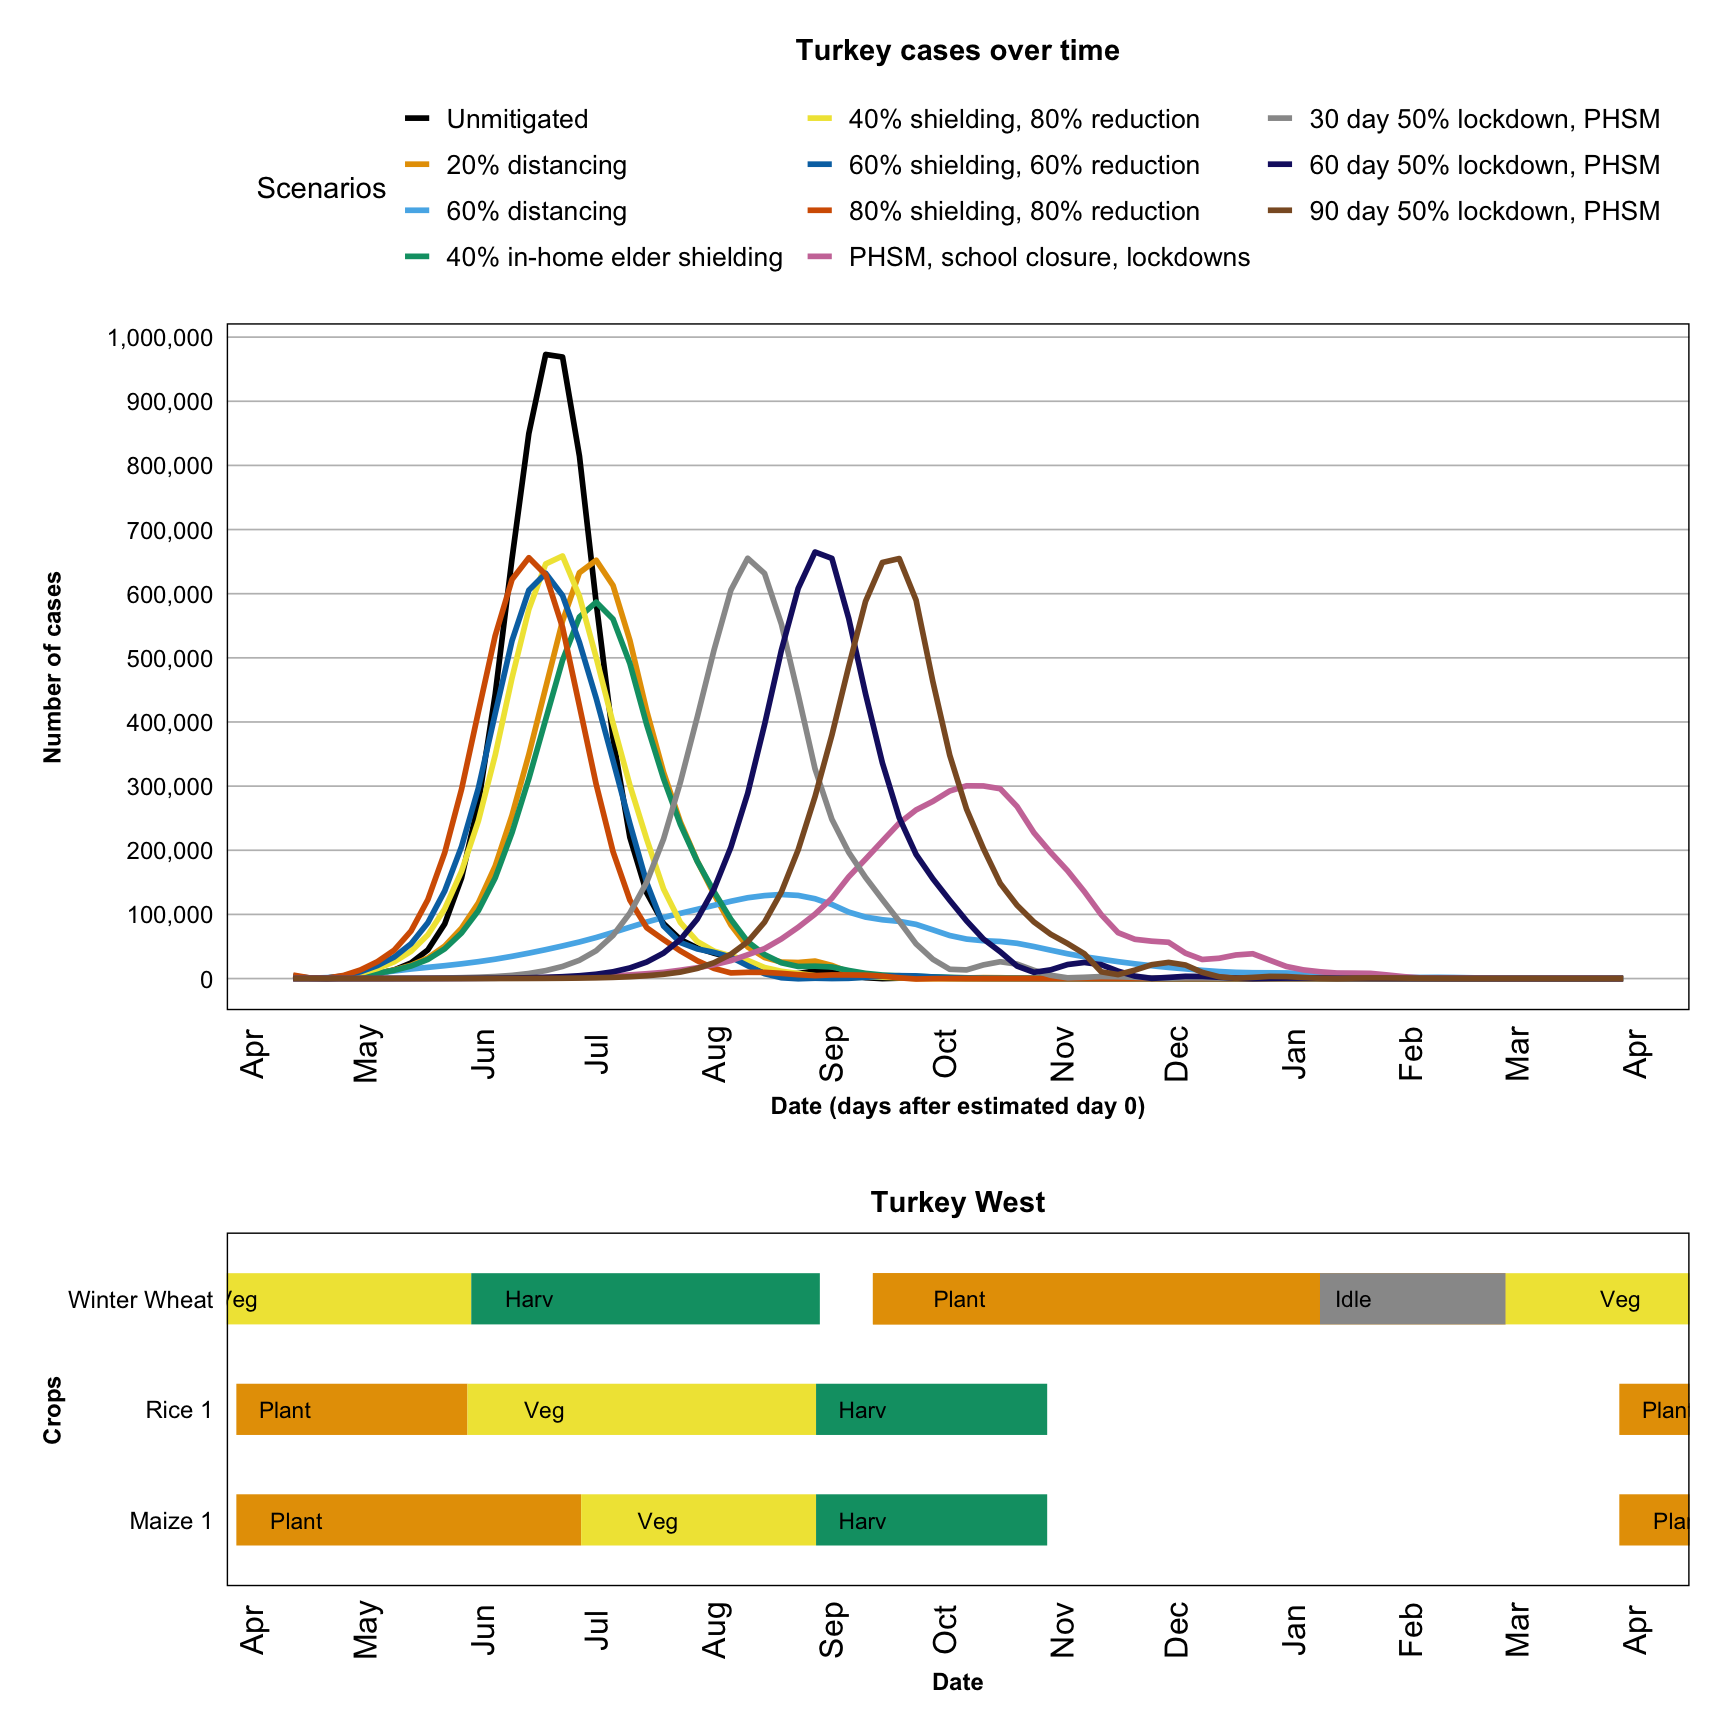
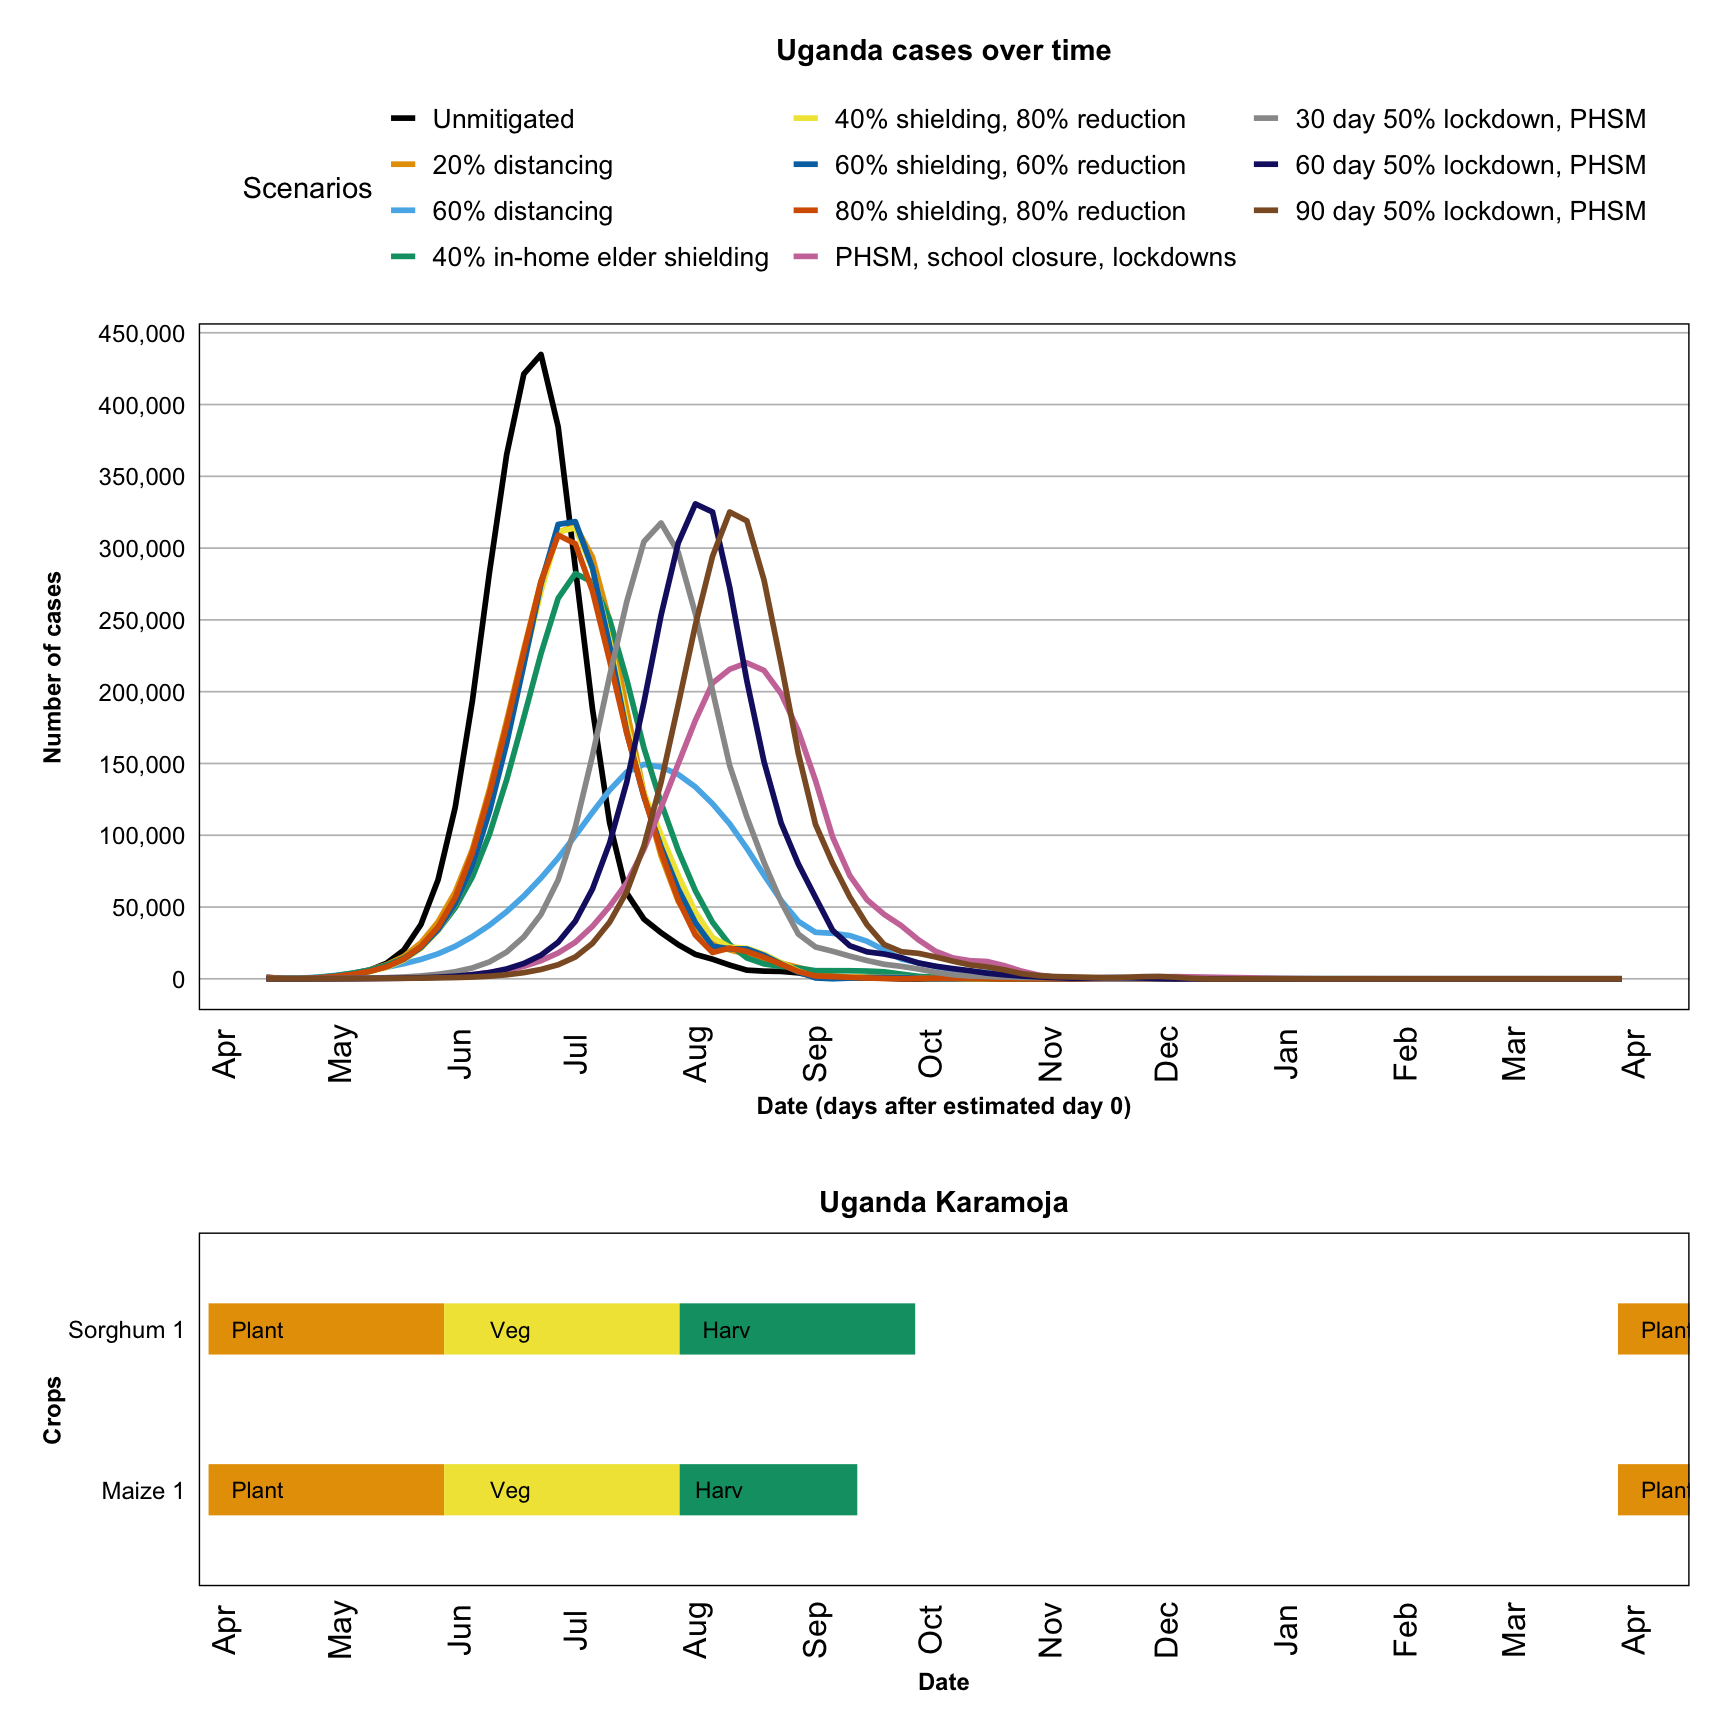
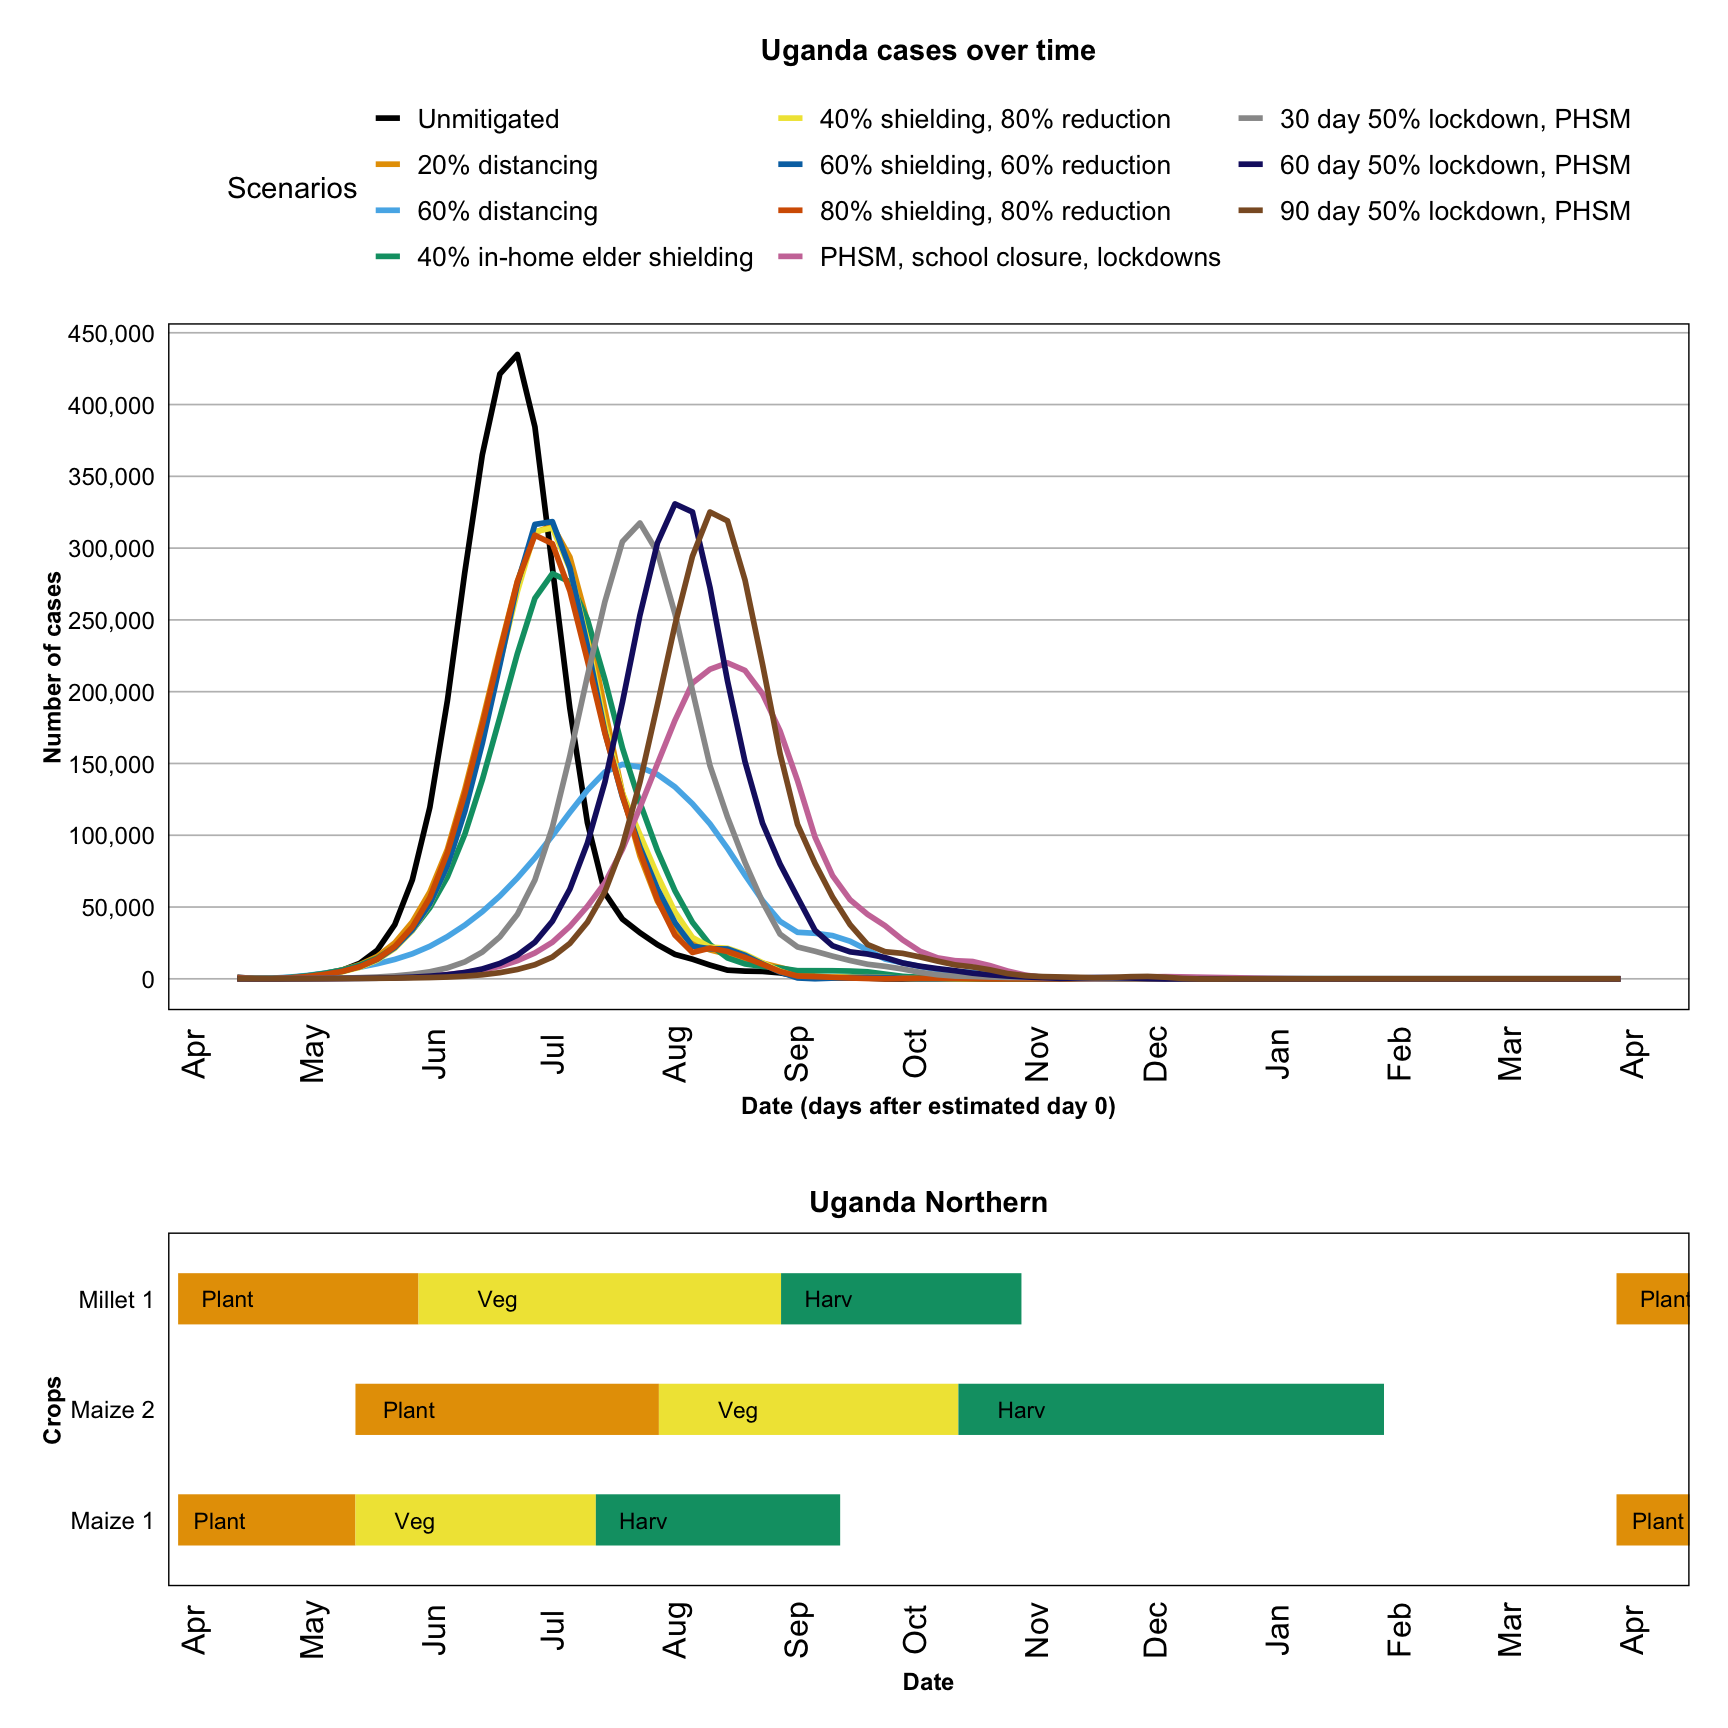
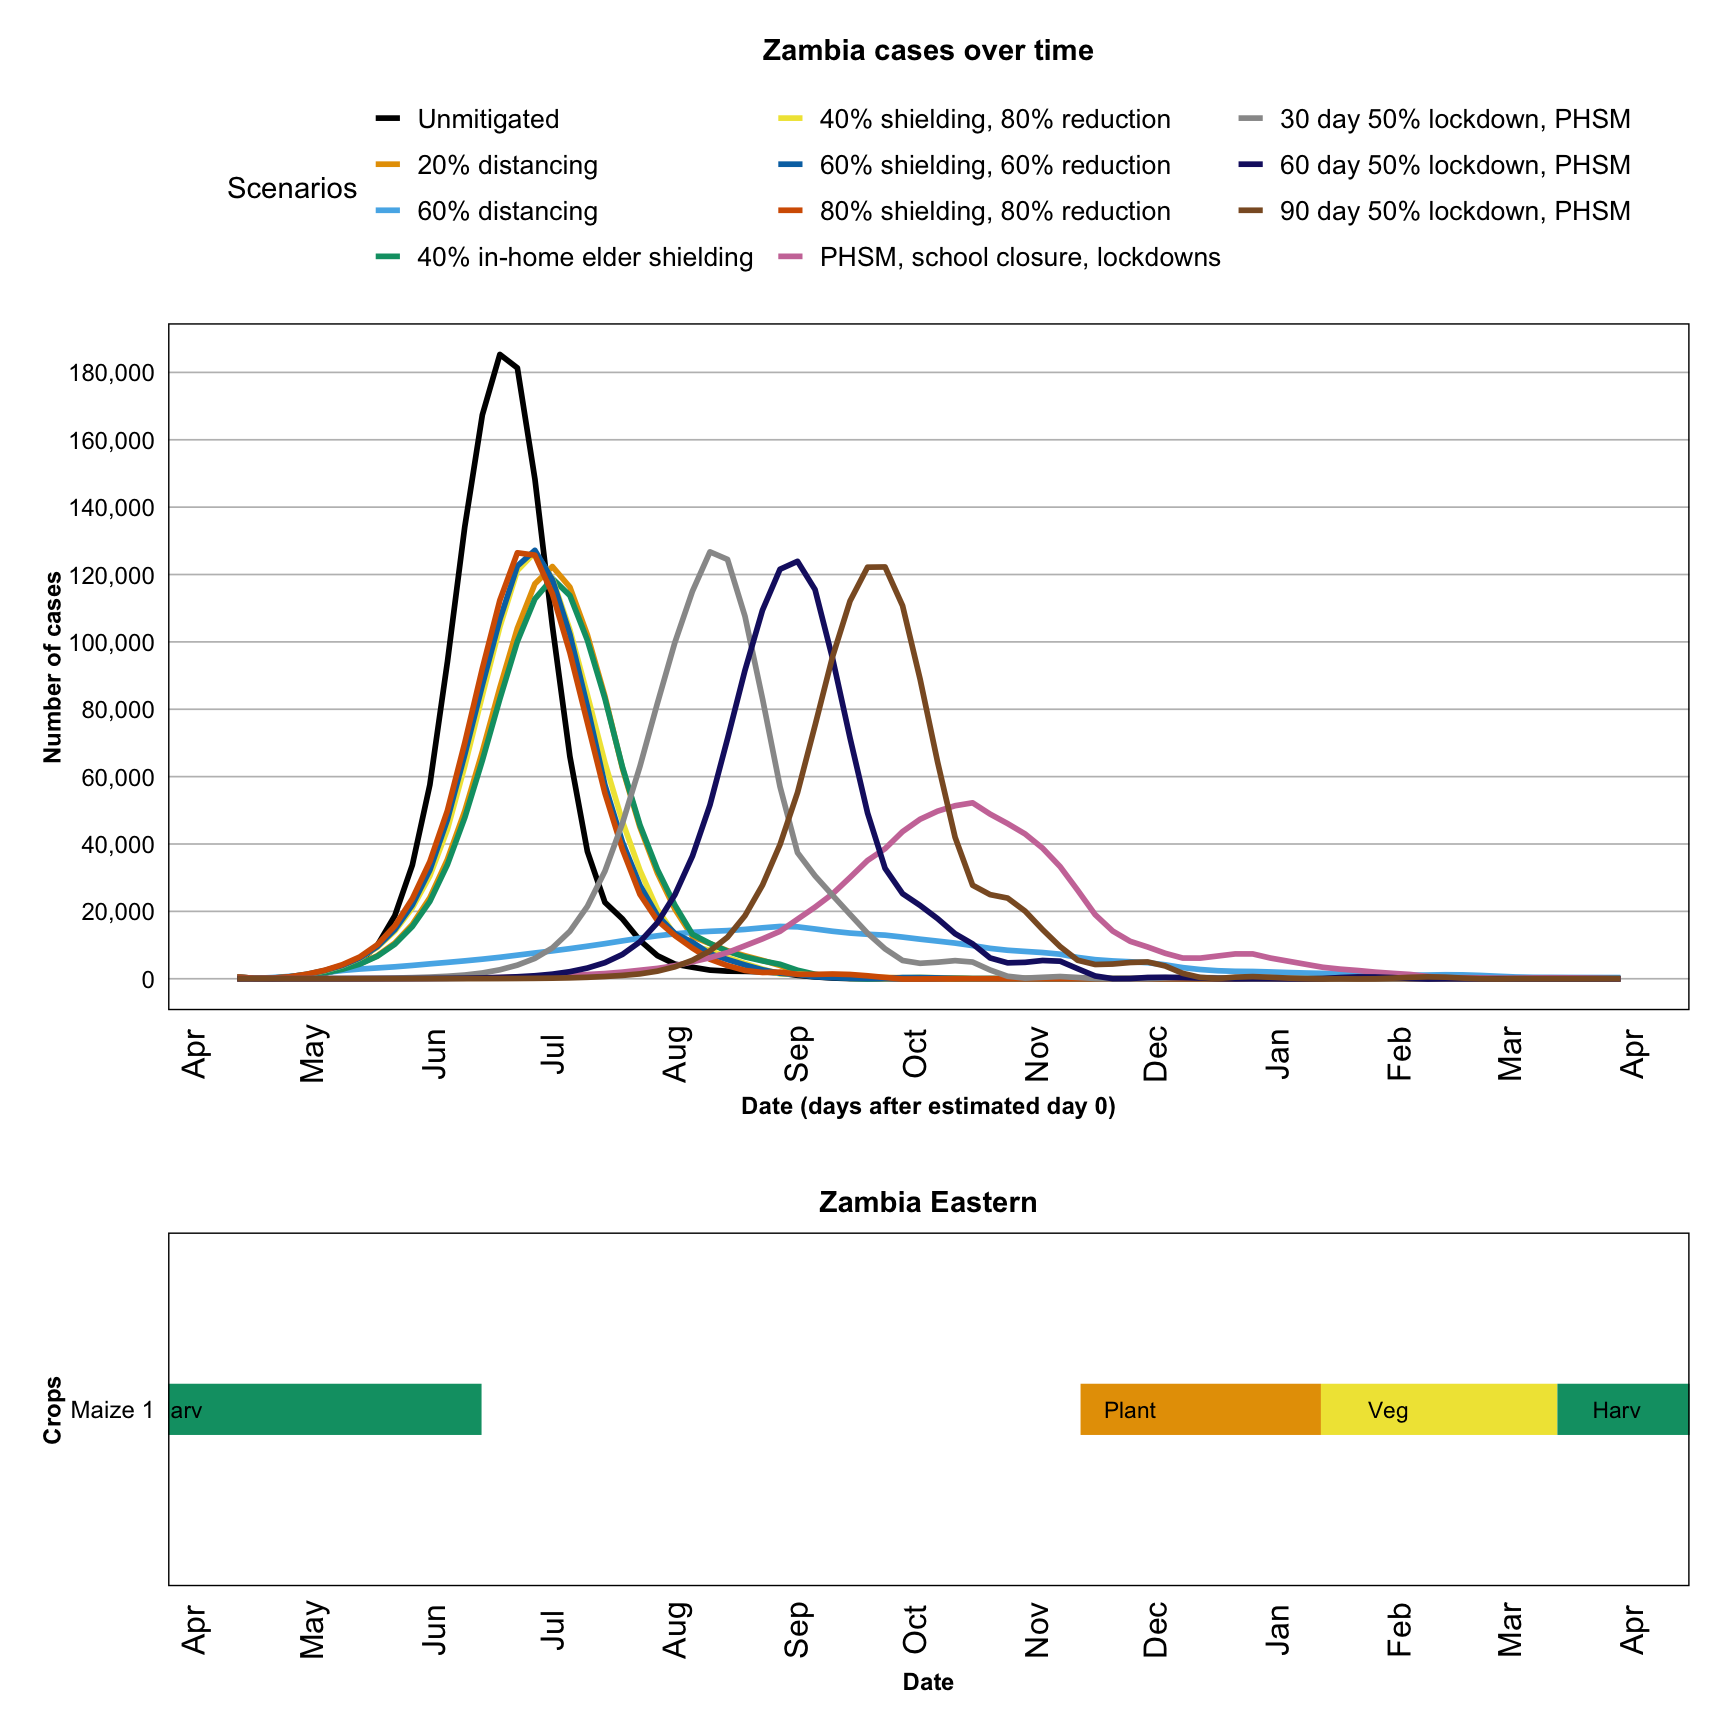
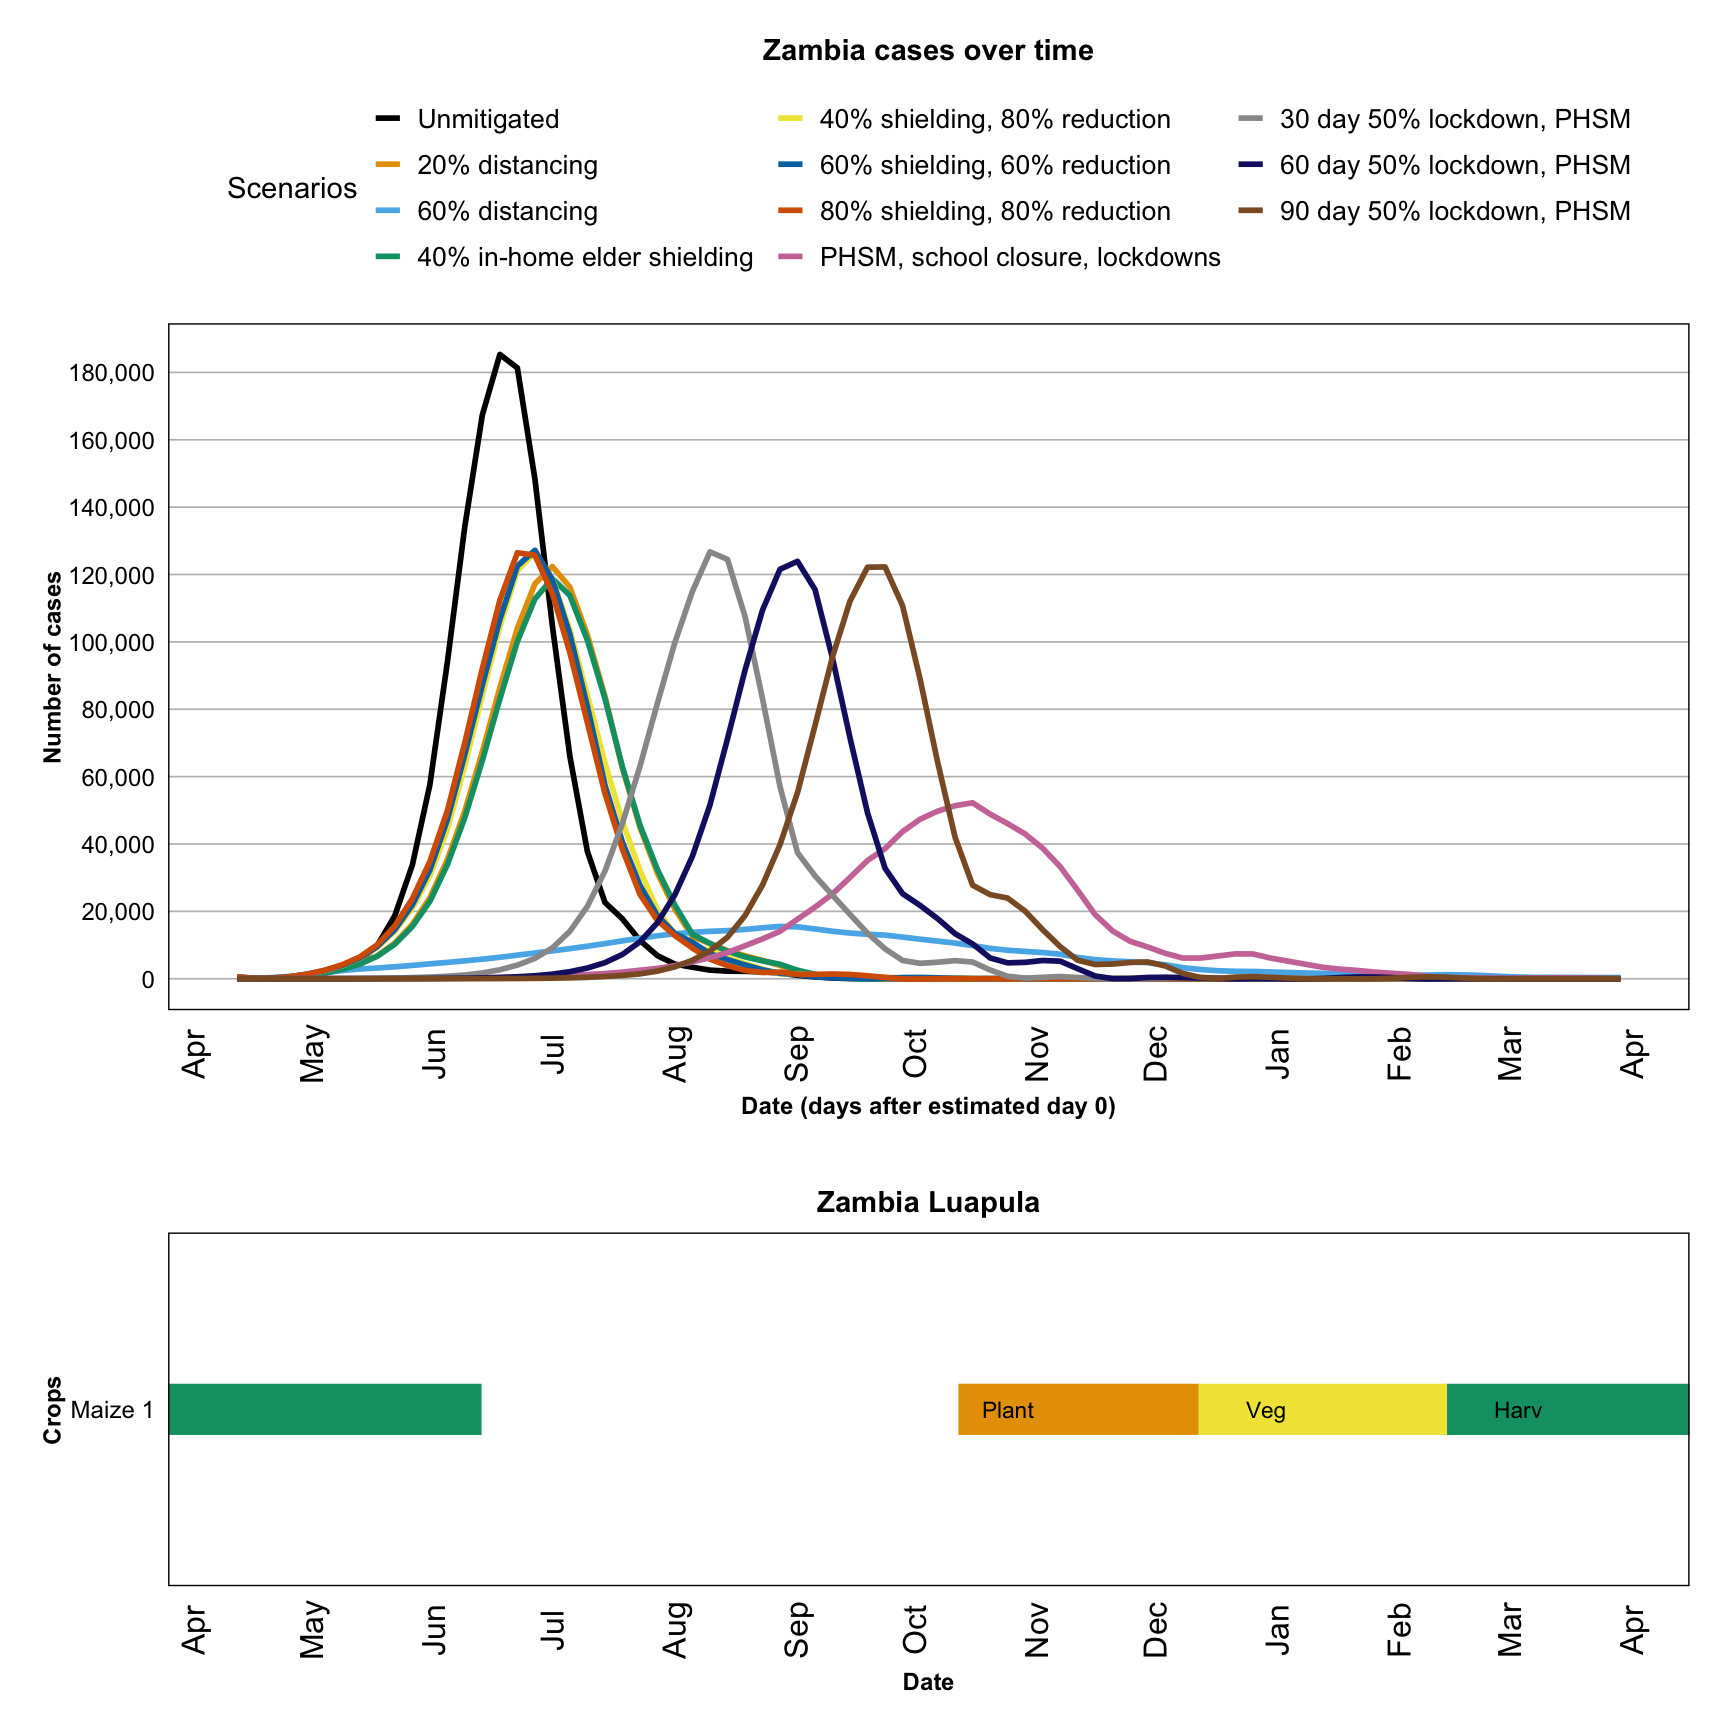
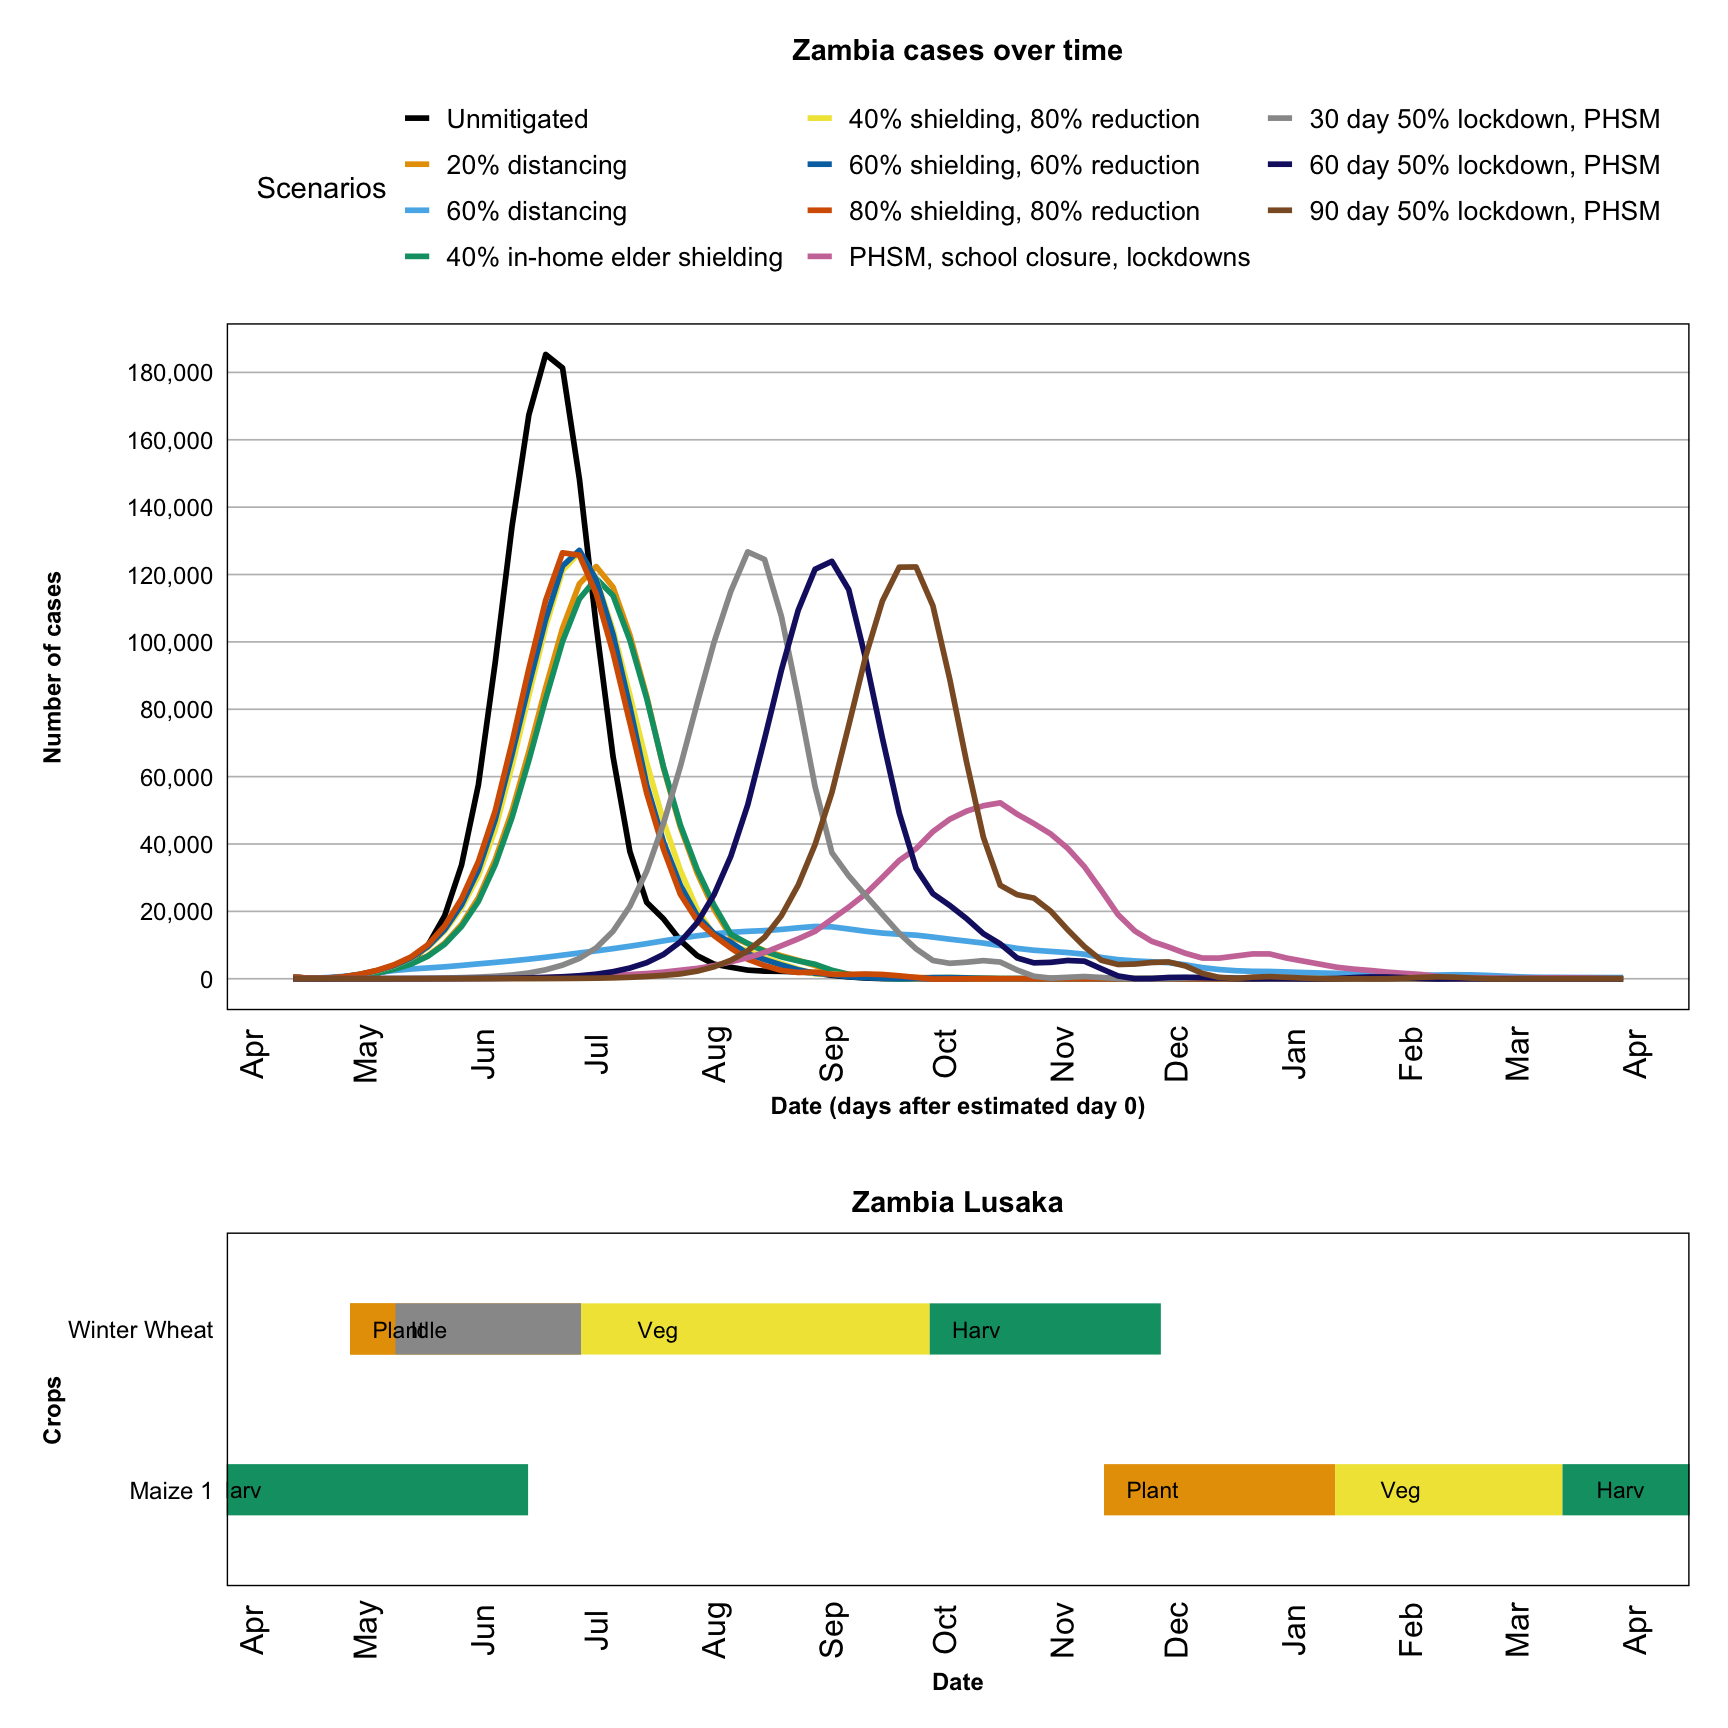
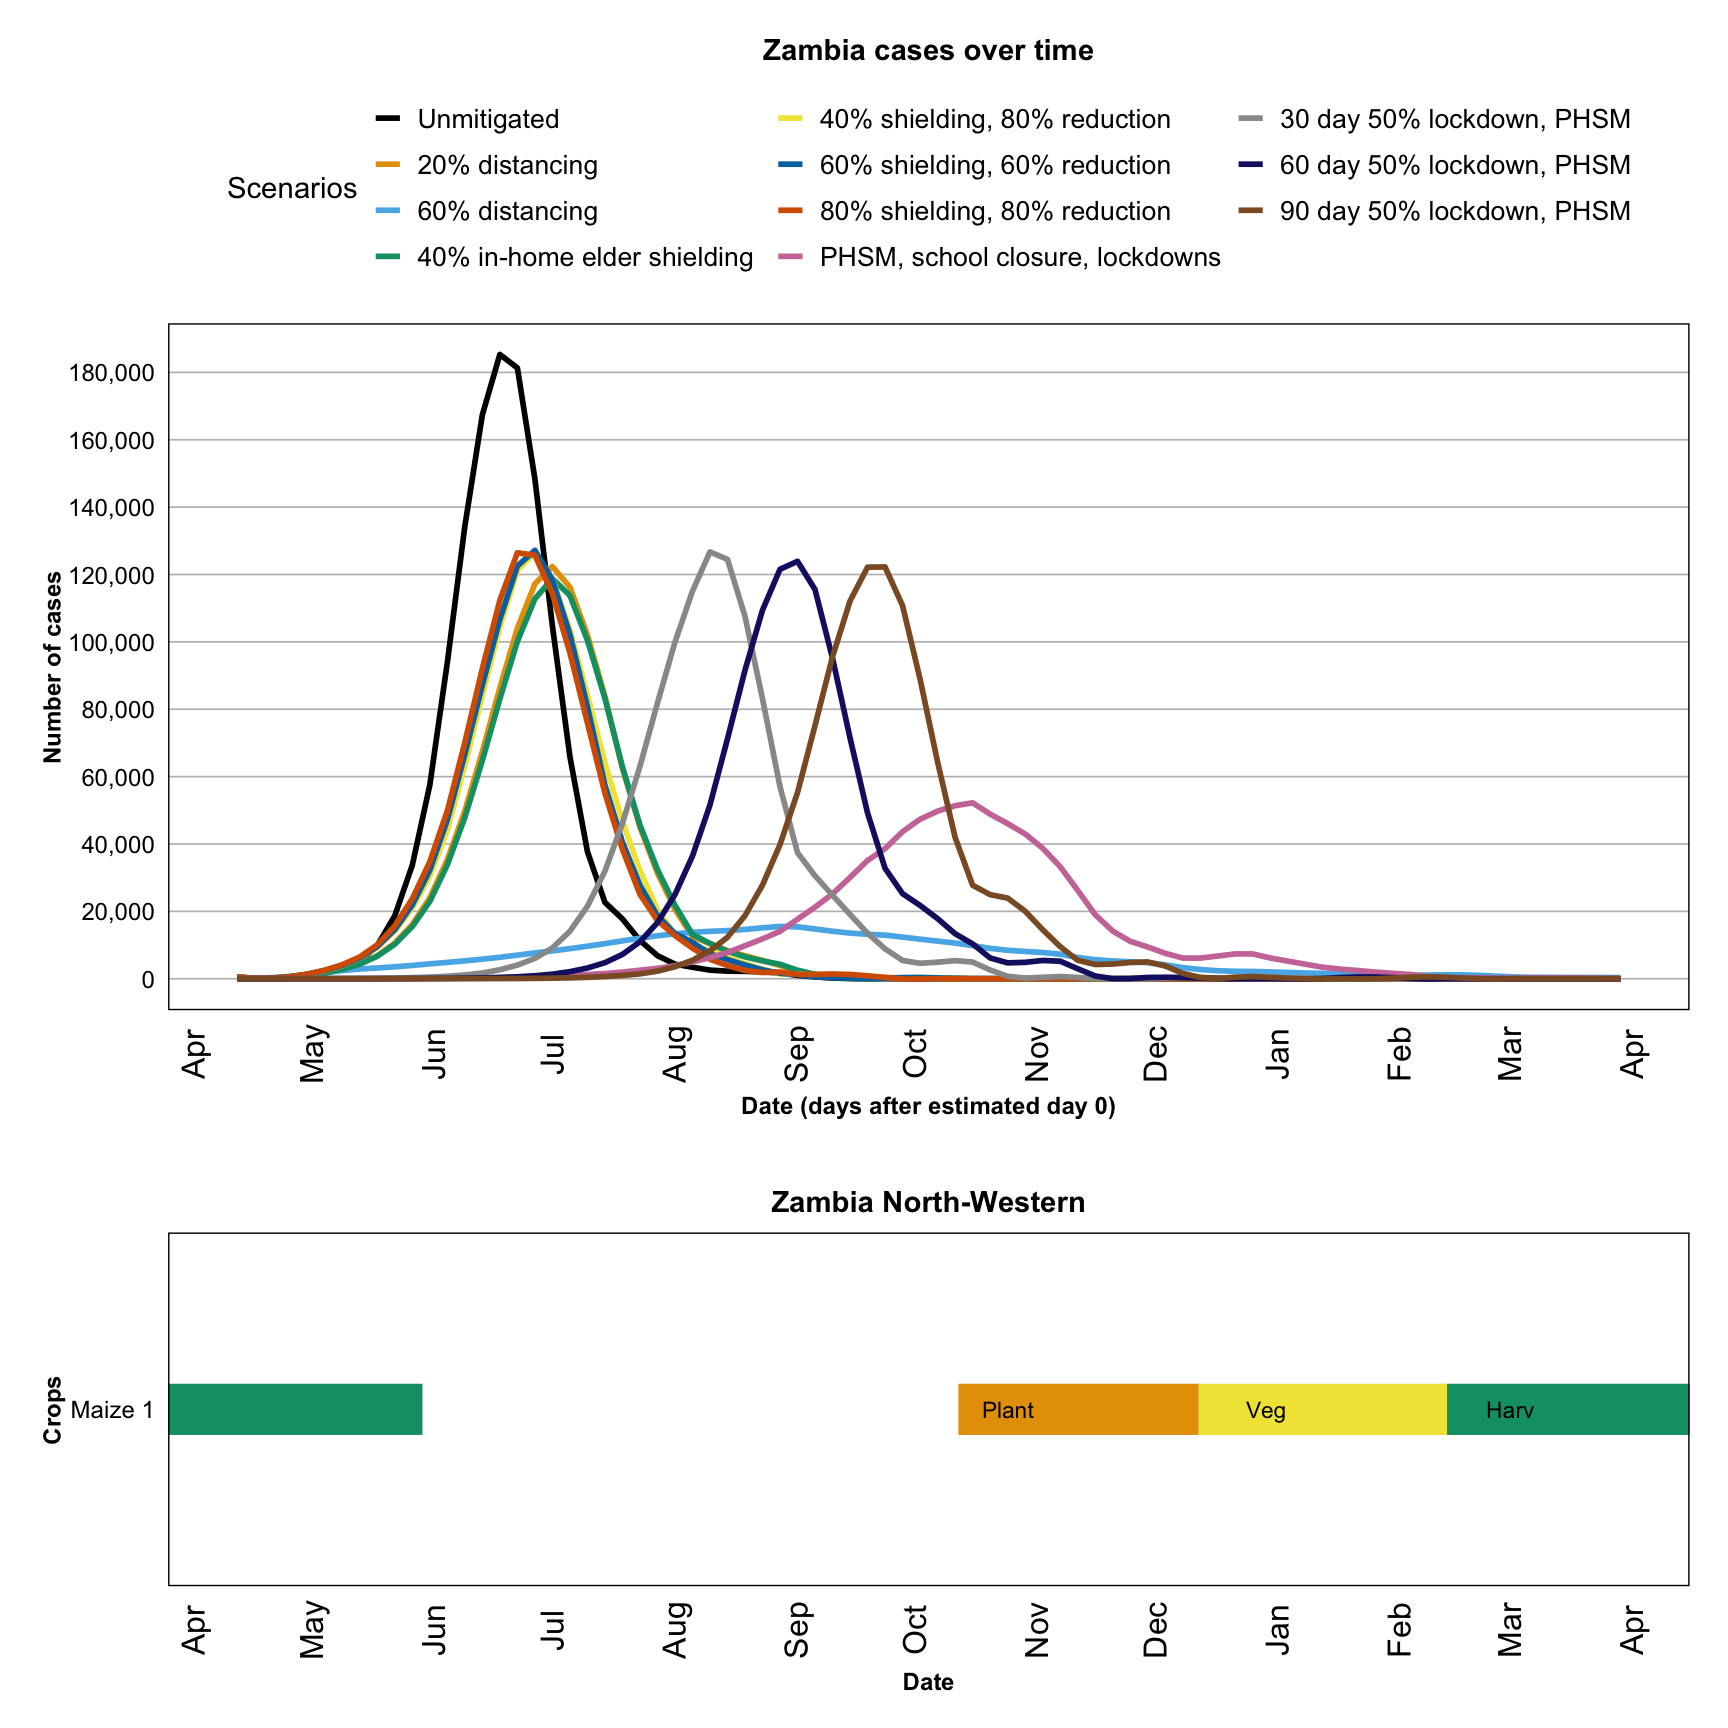
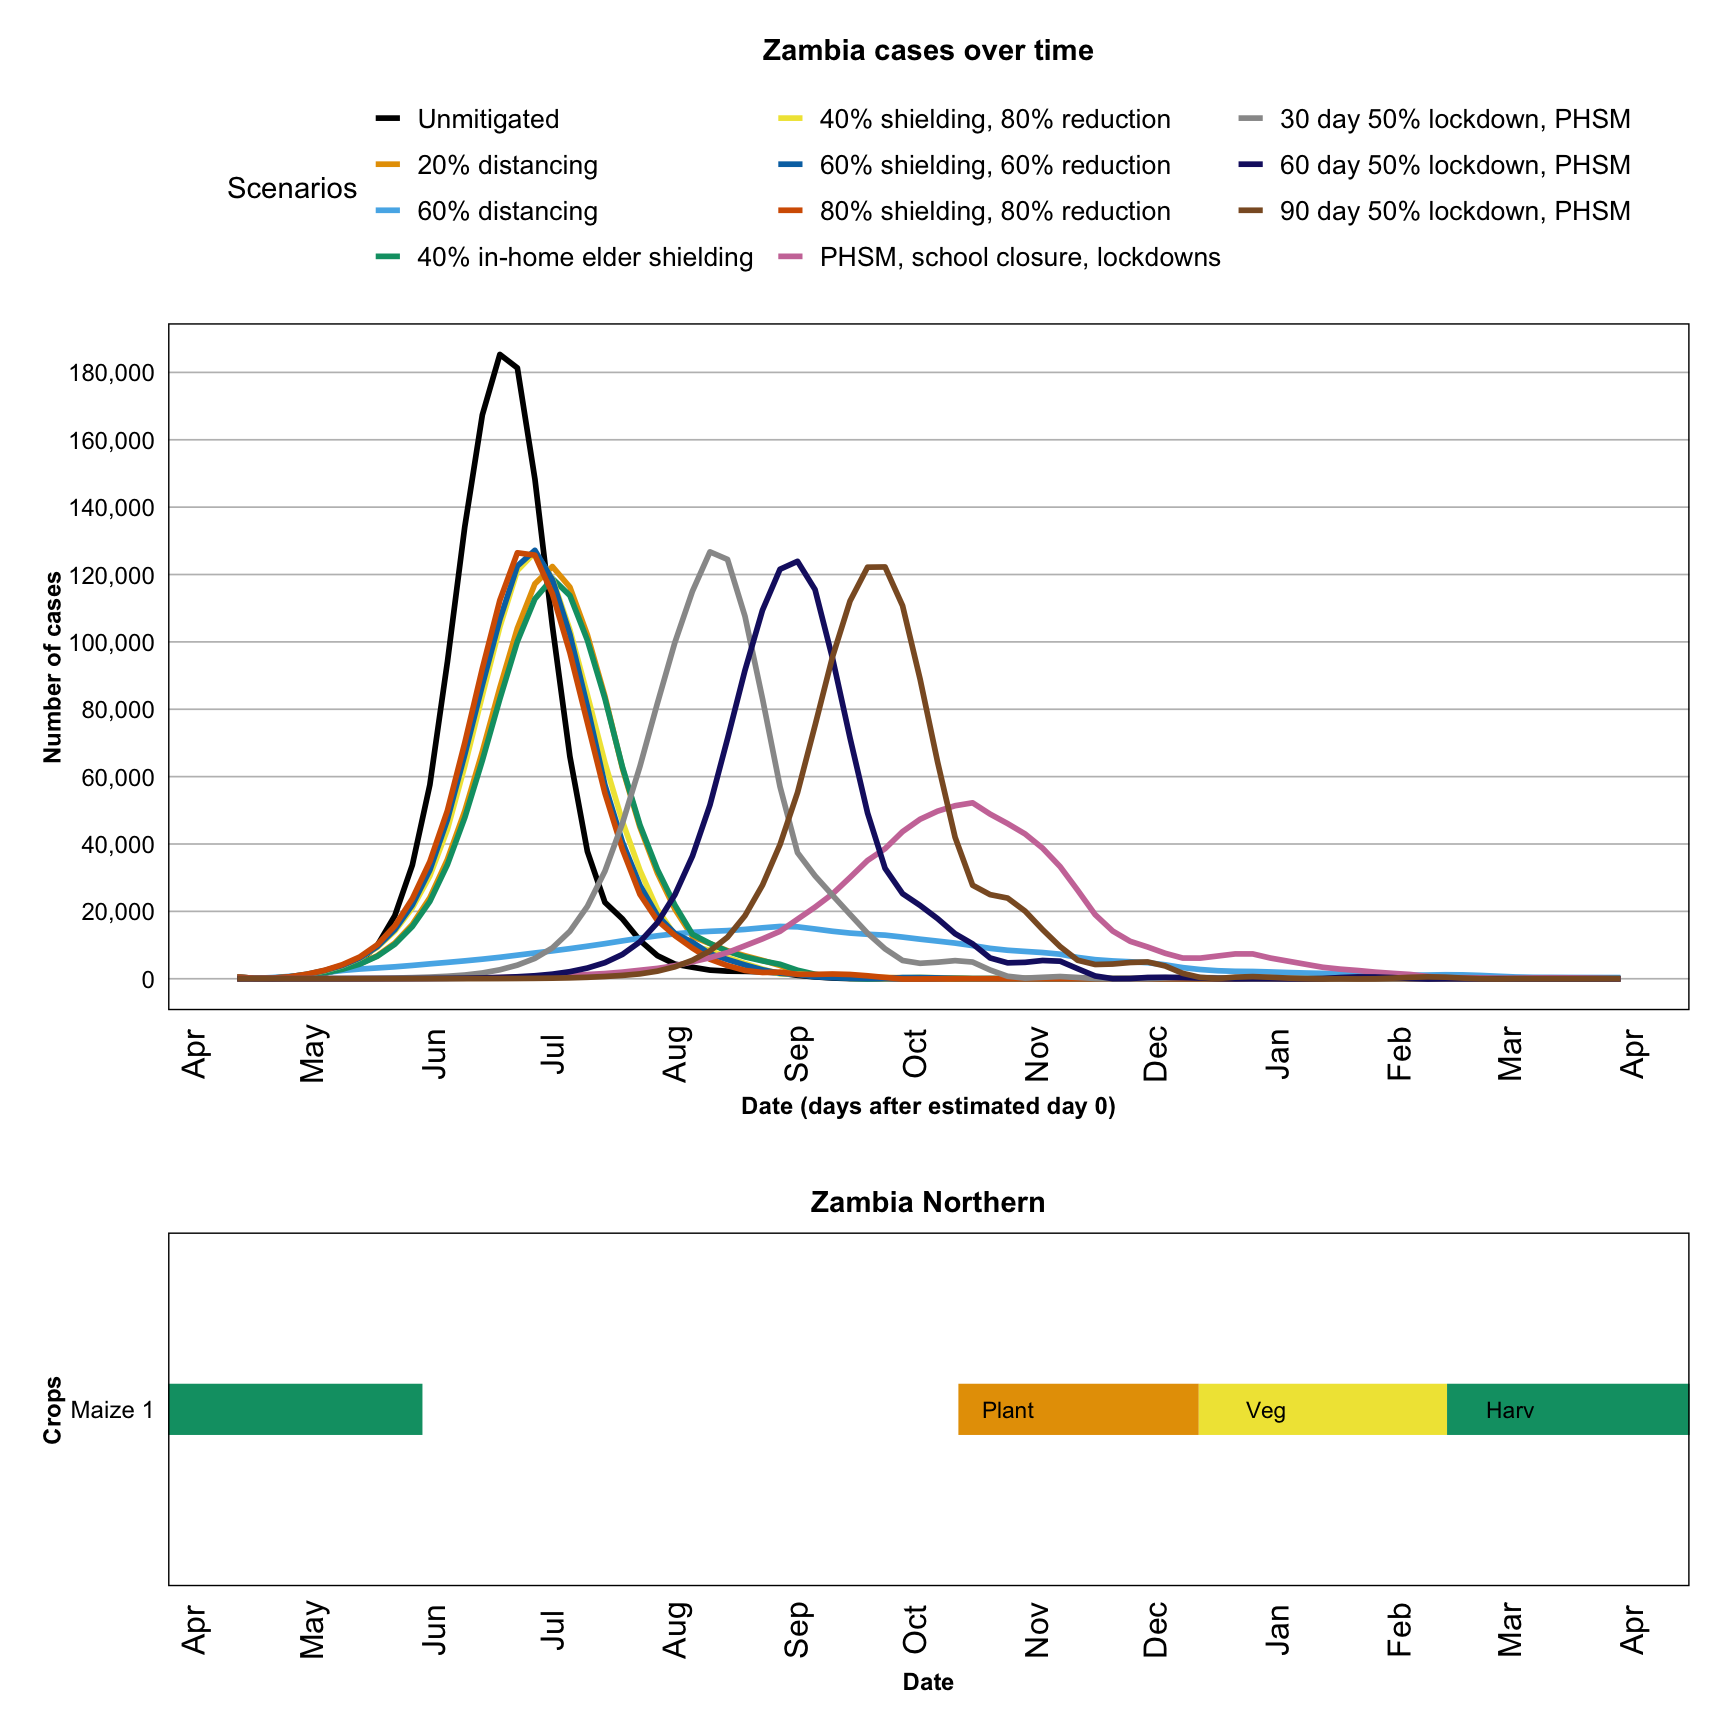
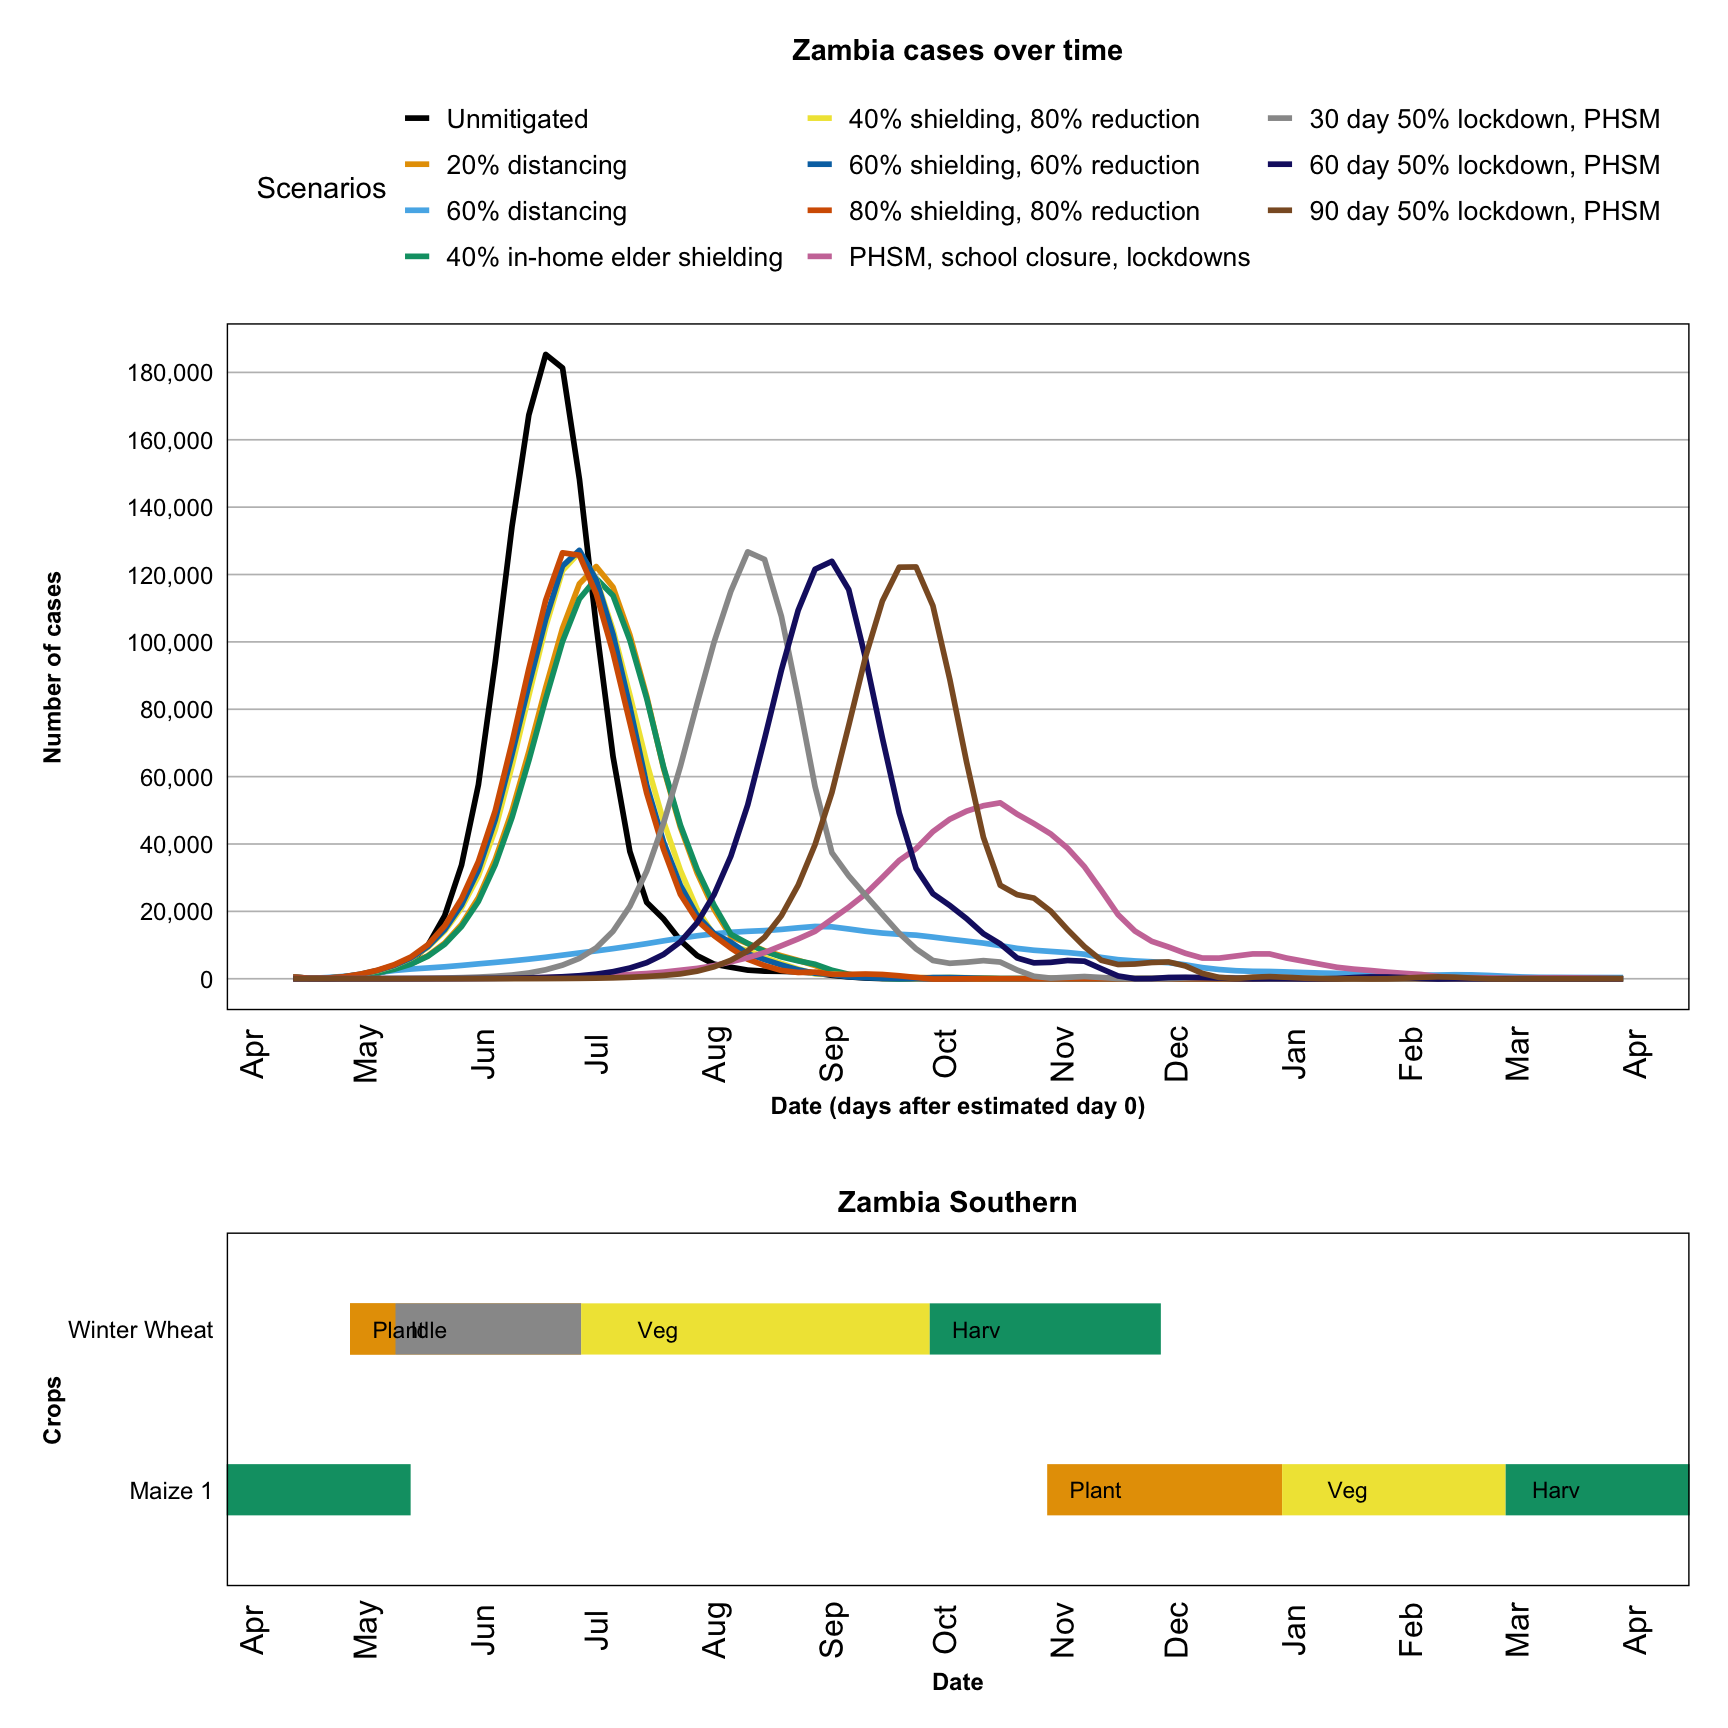
- a graph of the LSHTM projections of COVID-19 case totals over times (all age groups combined) for an unmitigated scenario plus ten disease containment scenarios (see explanation below);
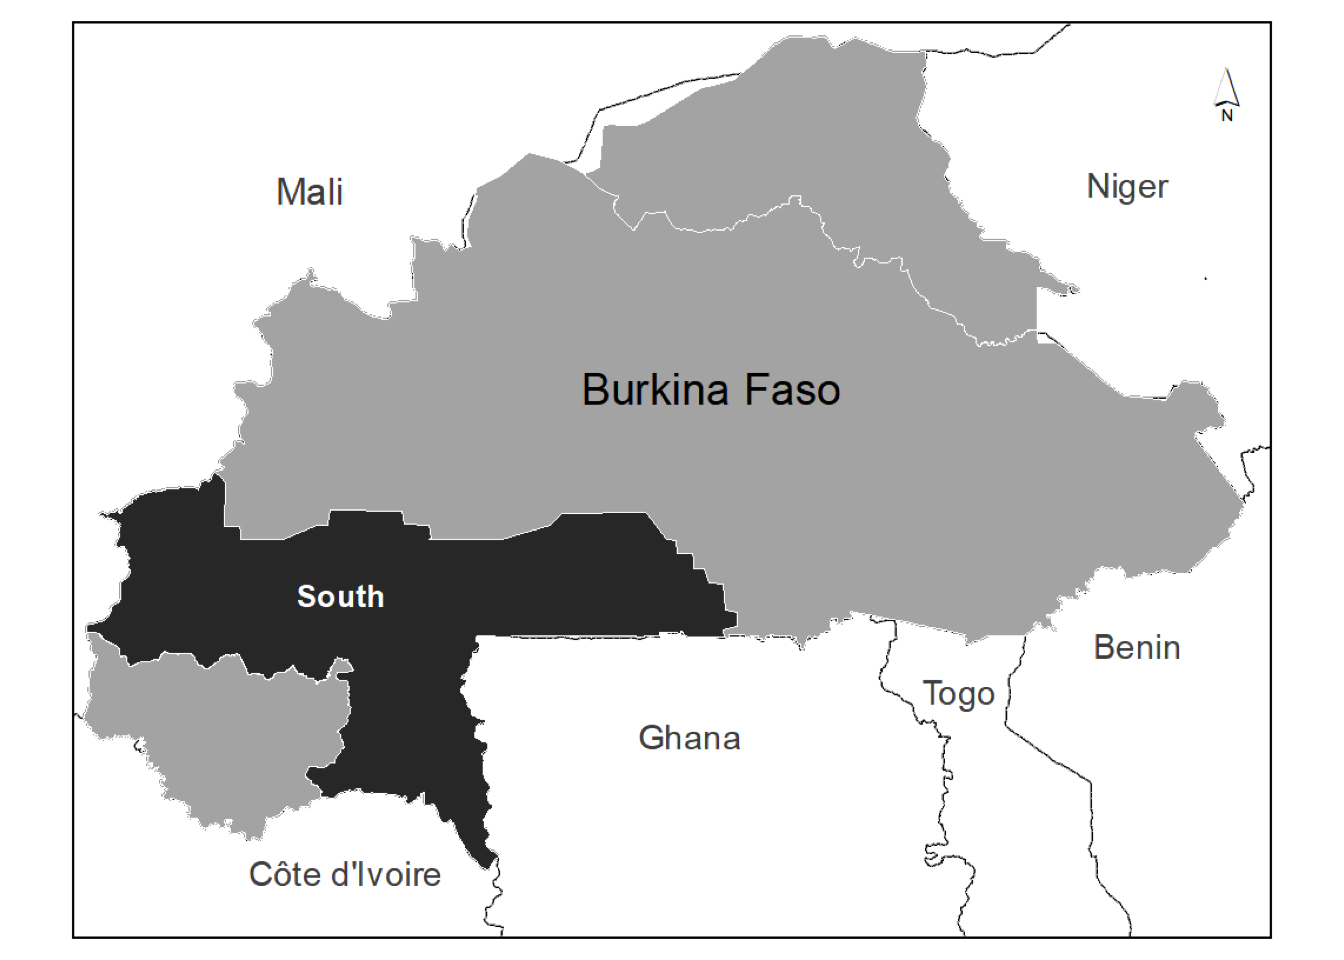
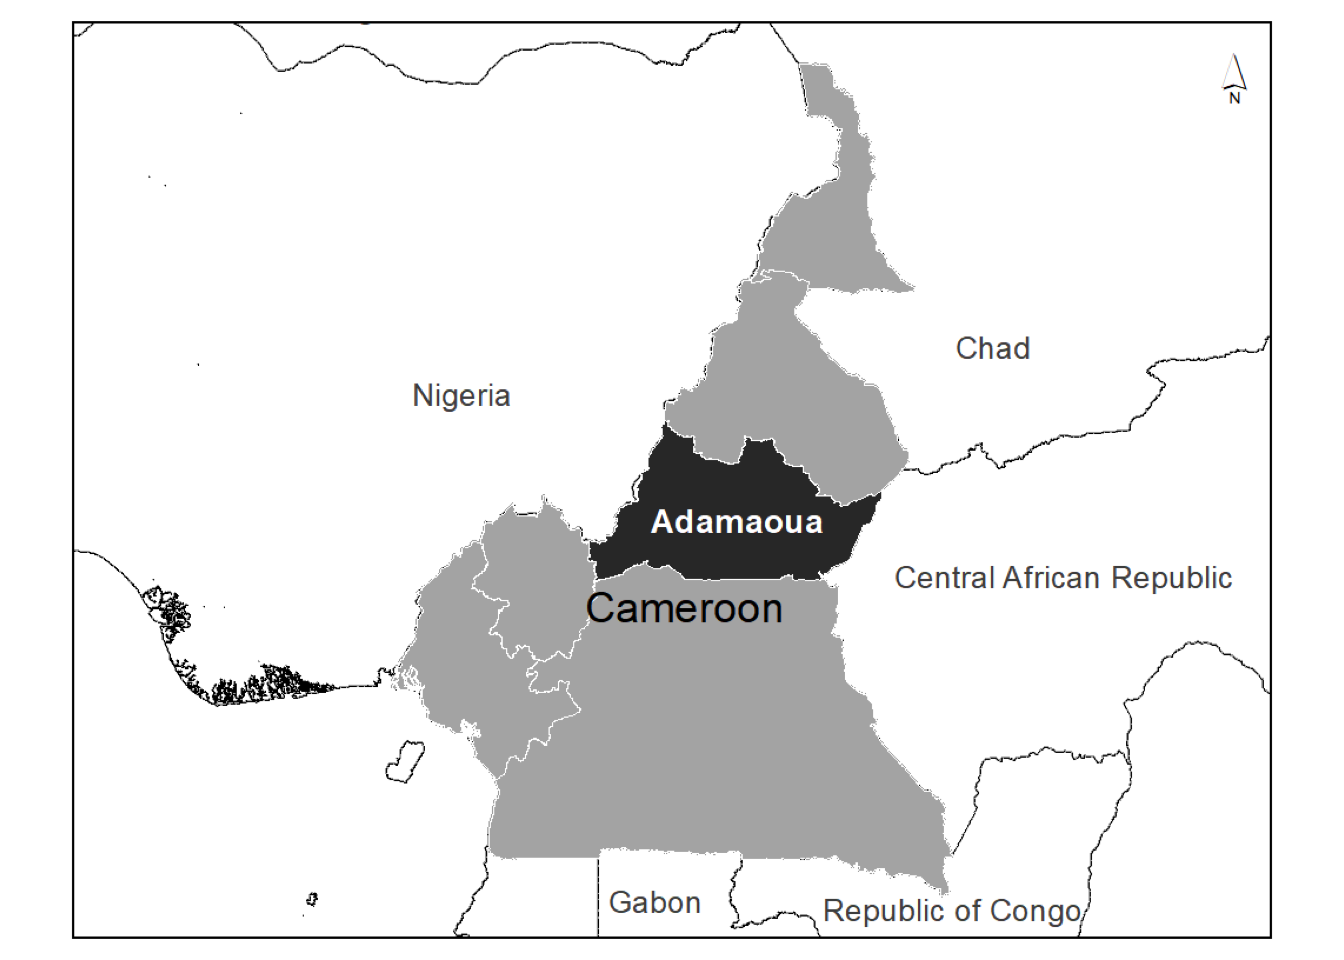
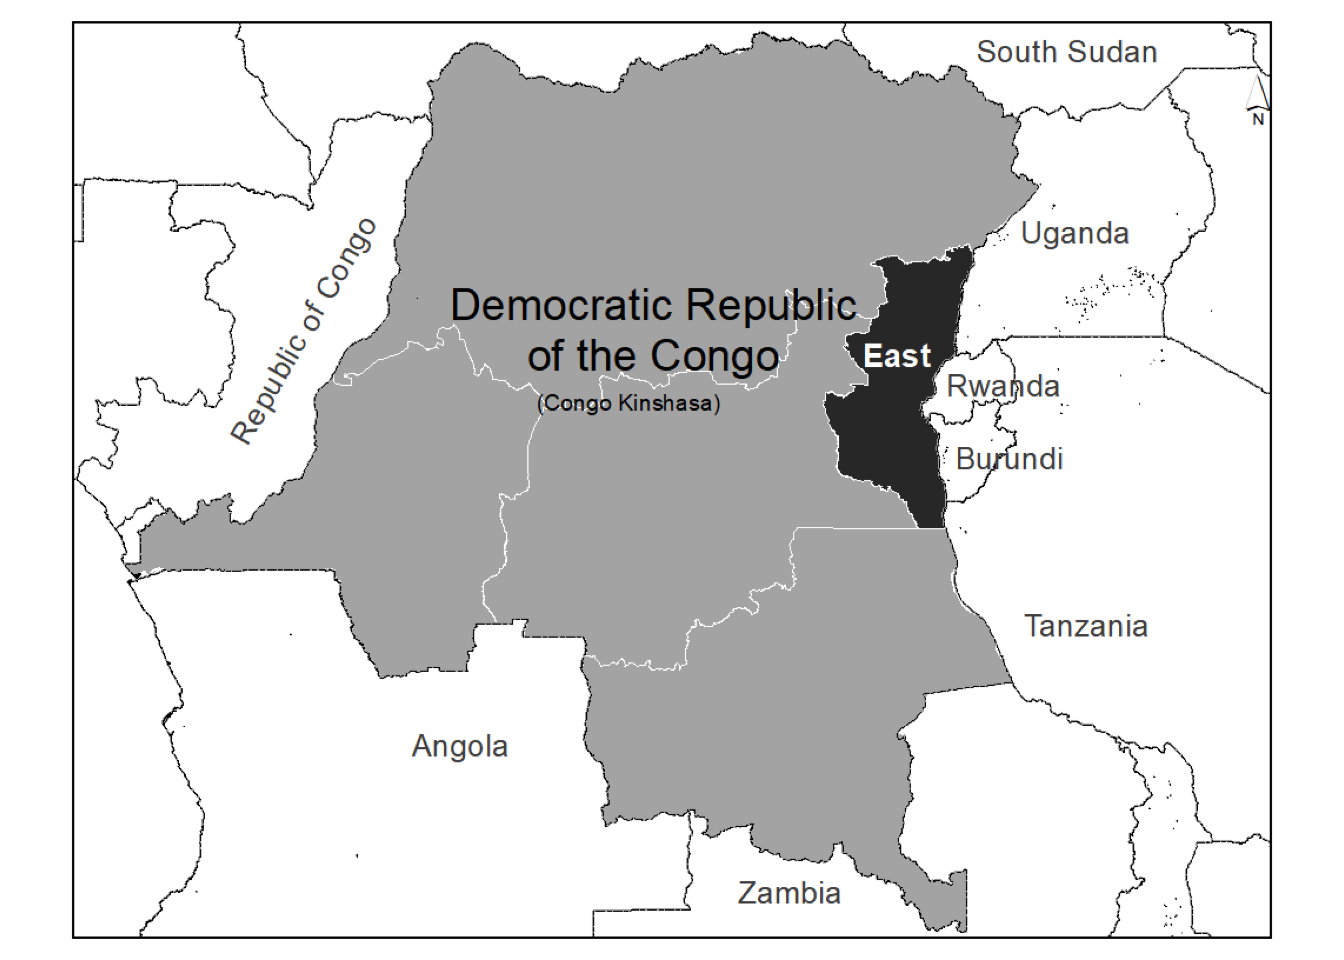
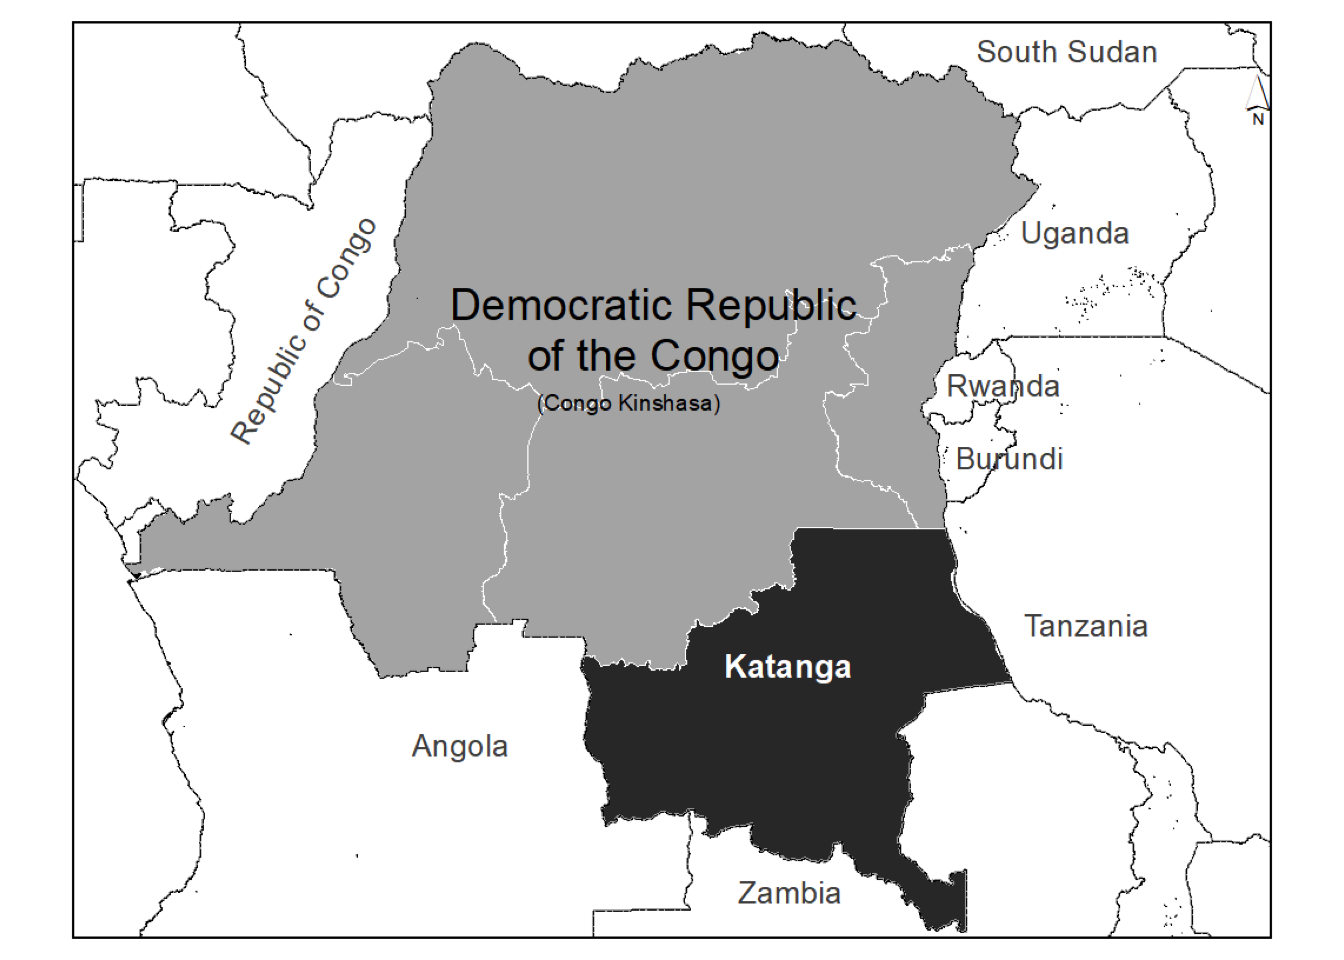
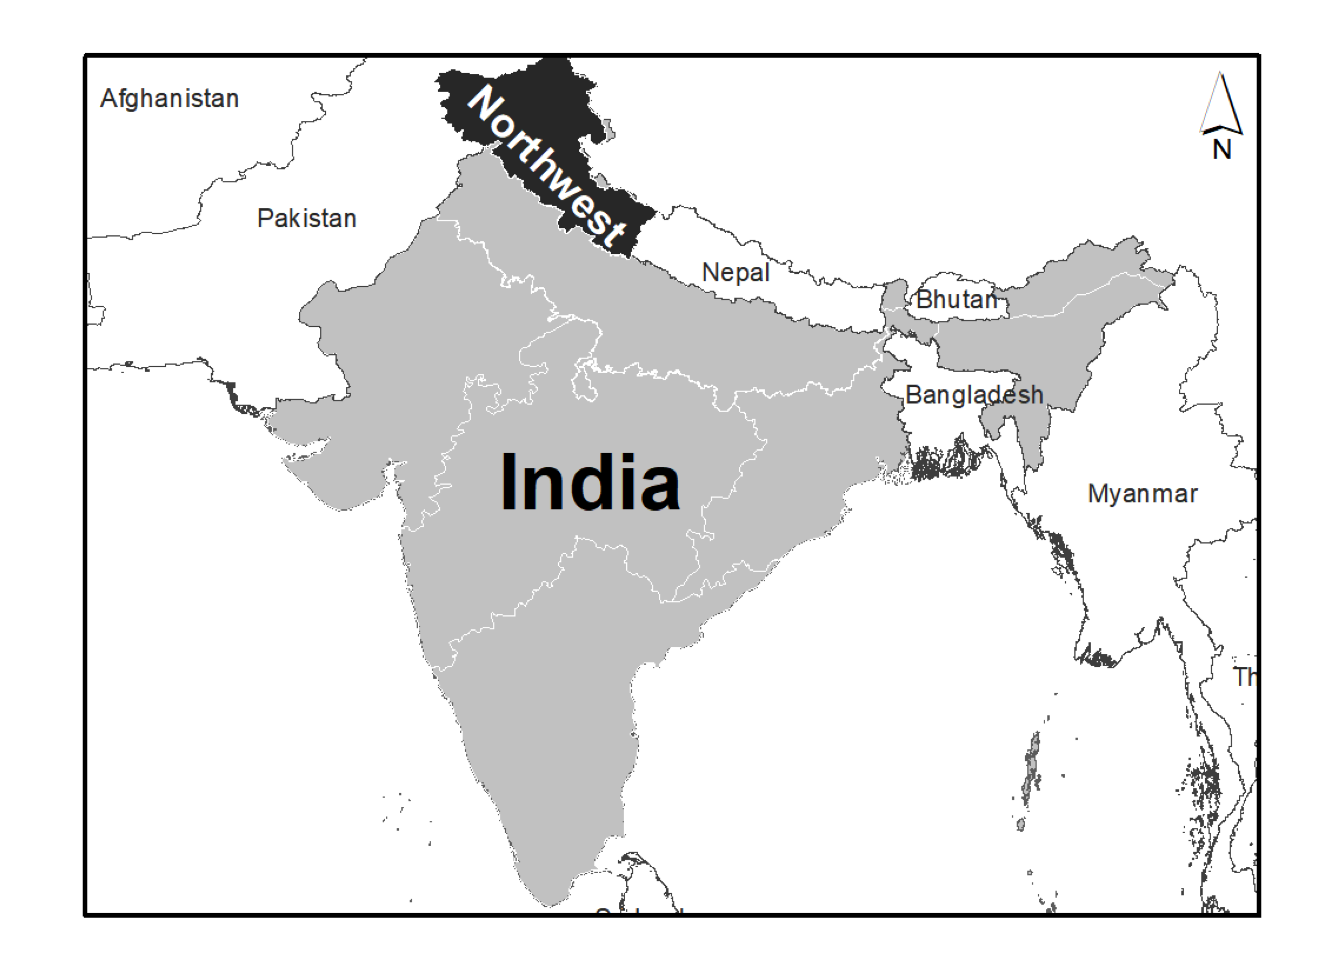
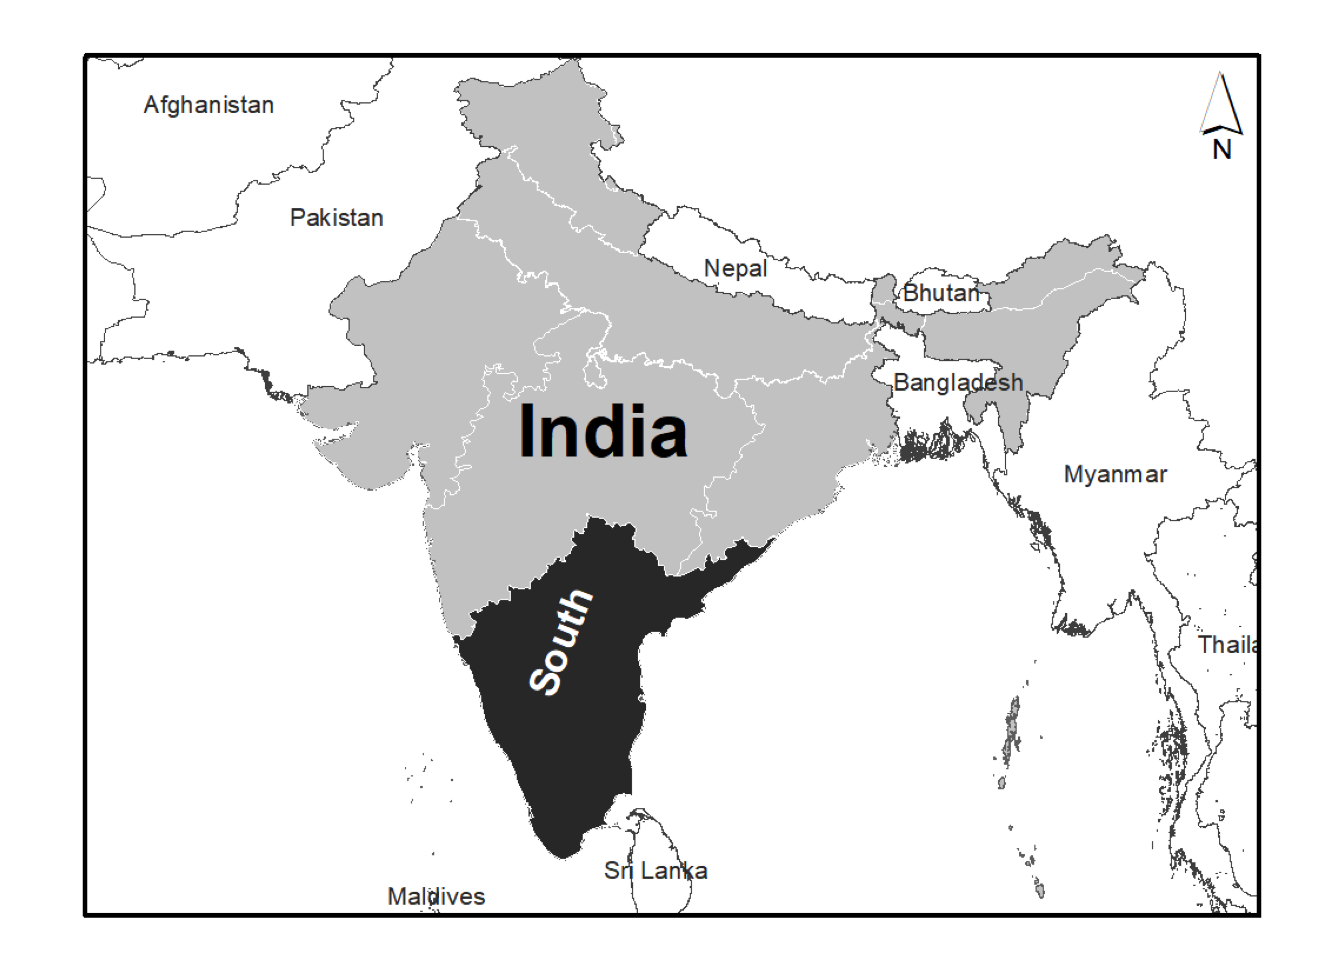
- a crop calendar showing when the crop production phases of key staple crops occur throughout the year (with multiple crop calendars in cases where variation in timing occurs);
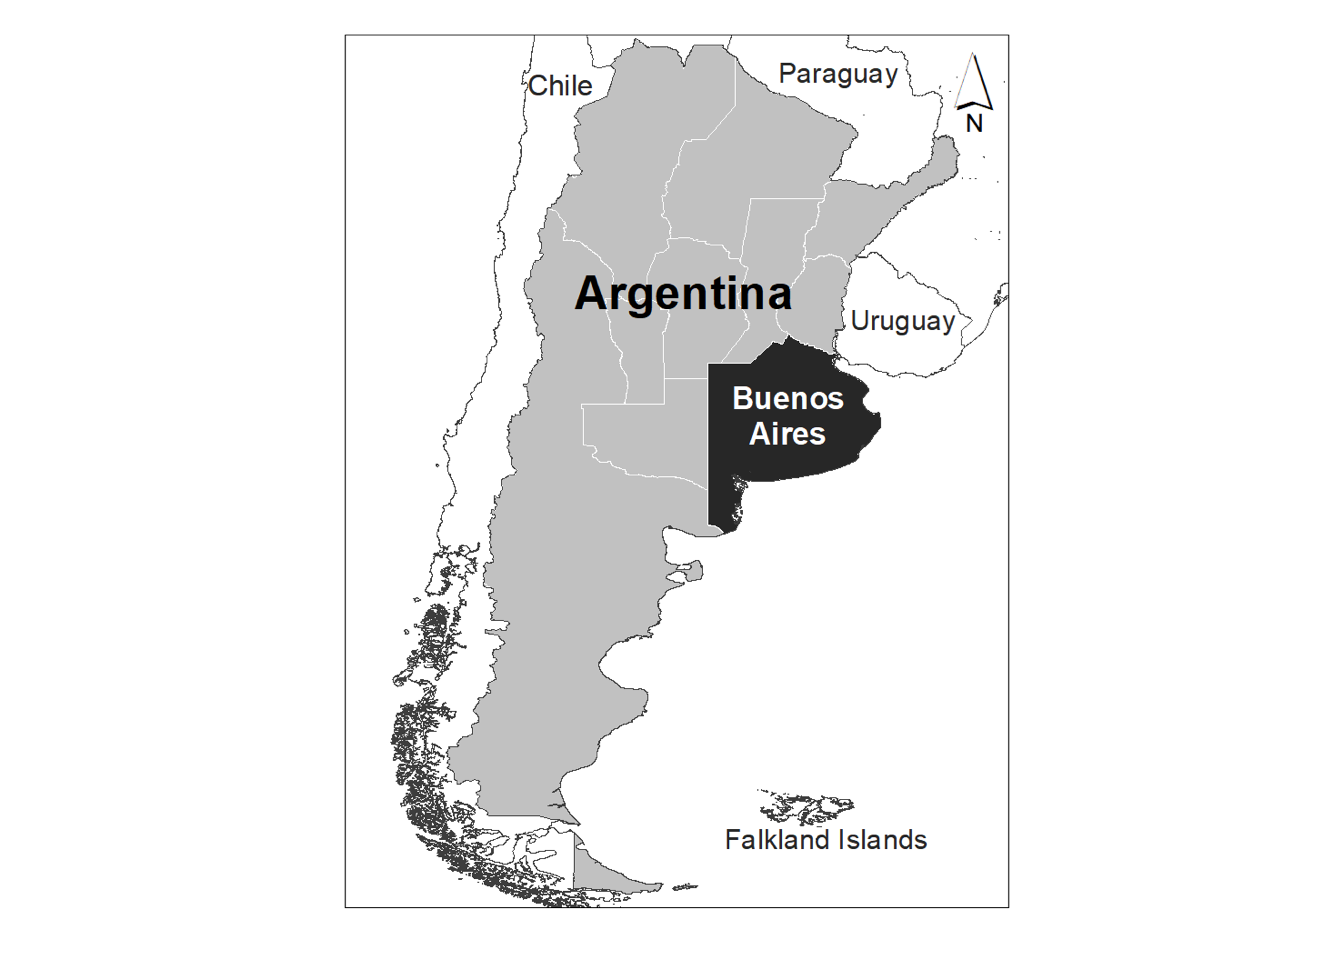
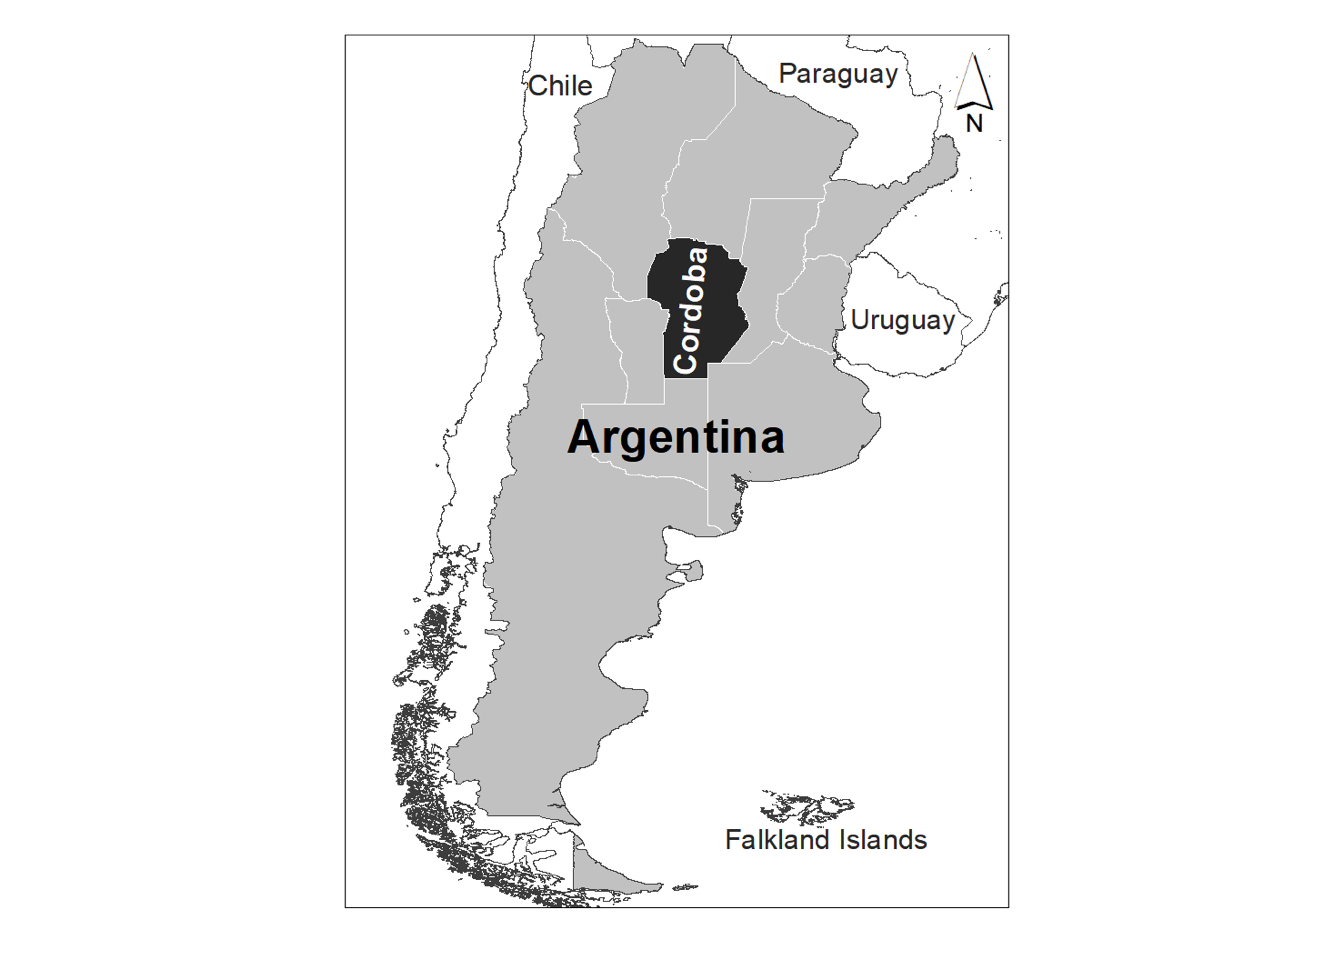
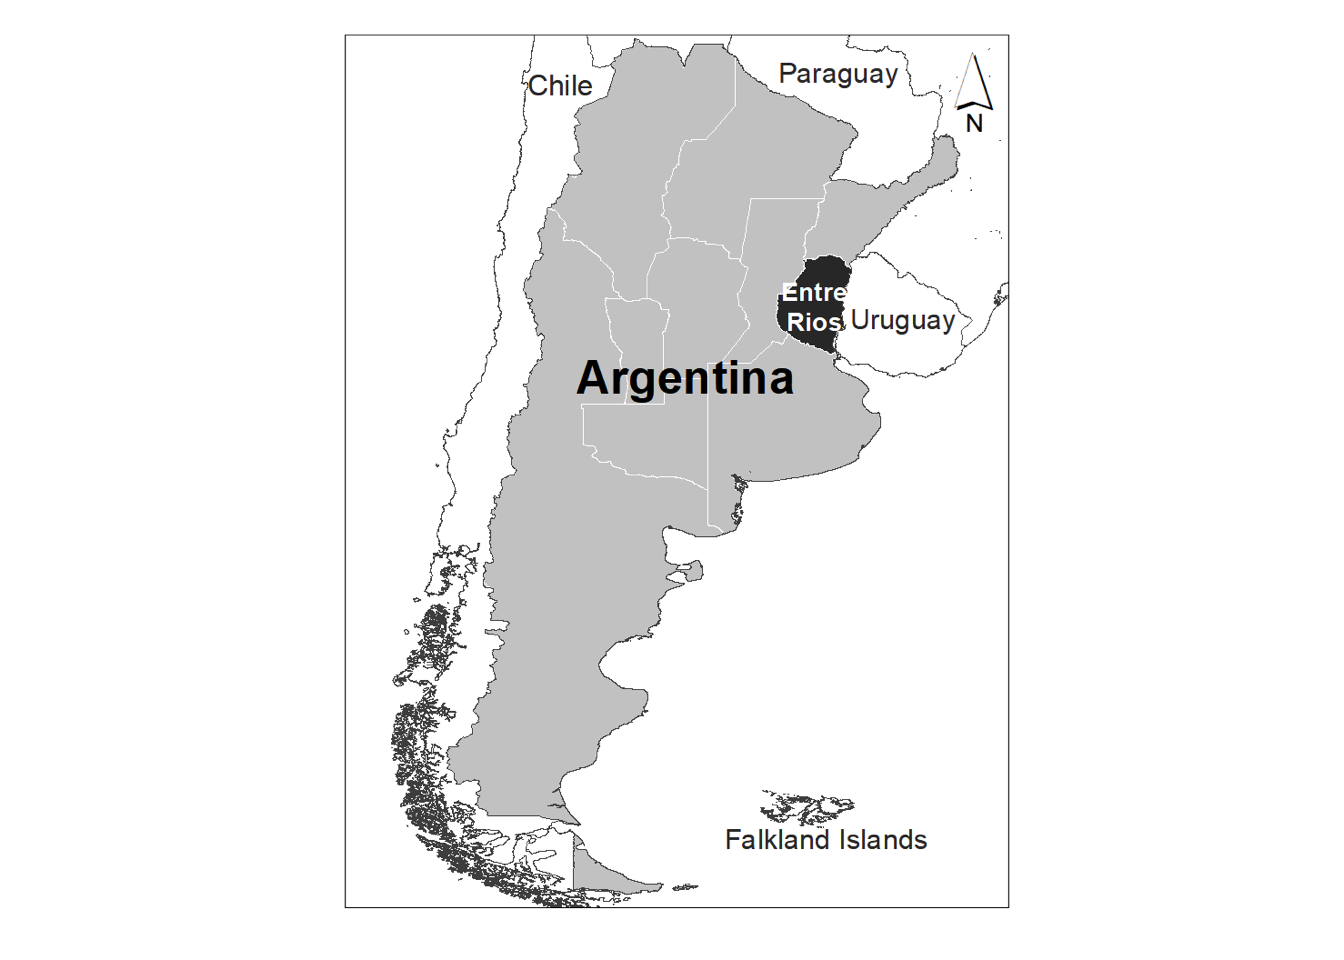
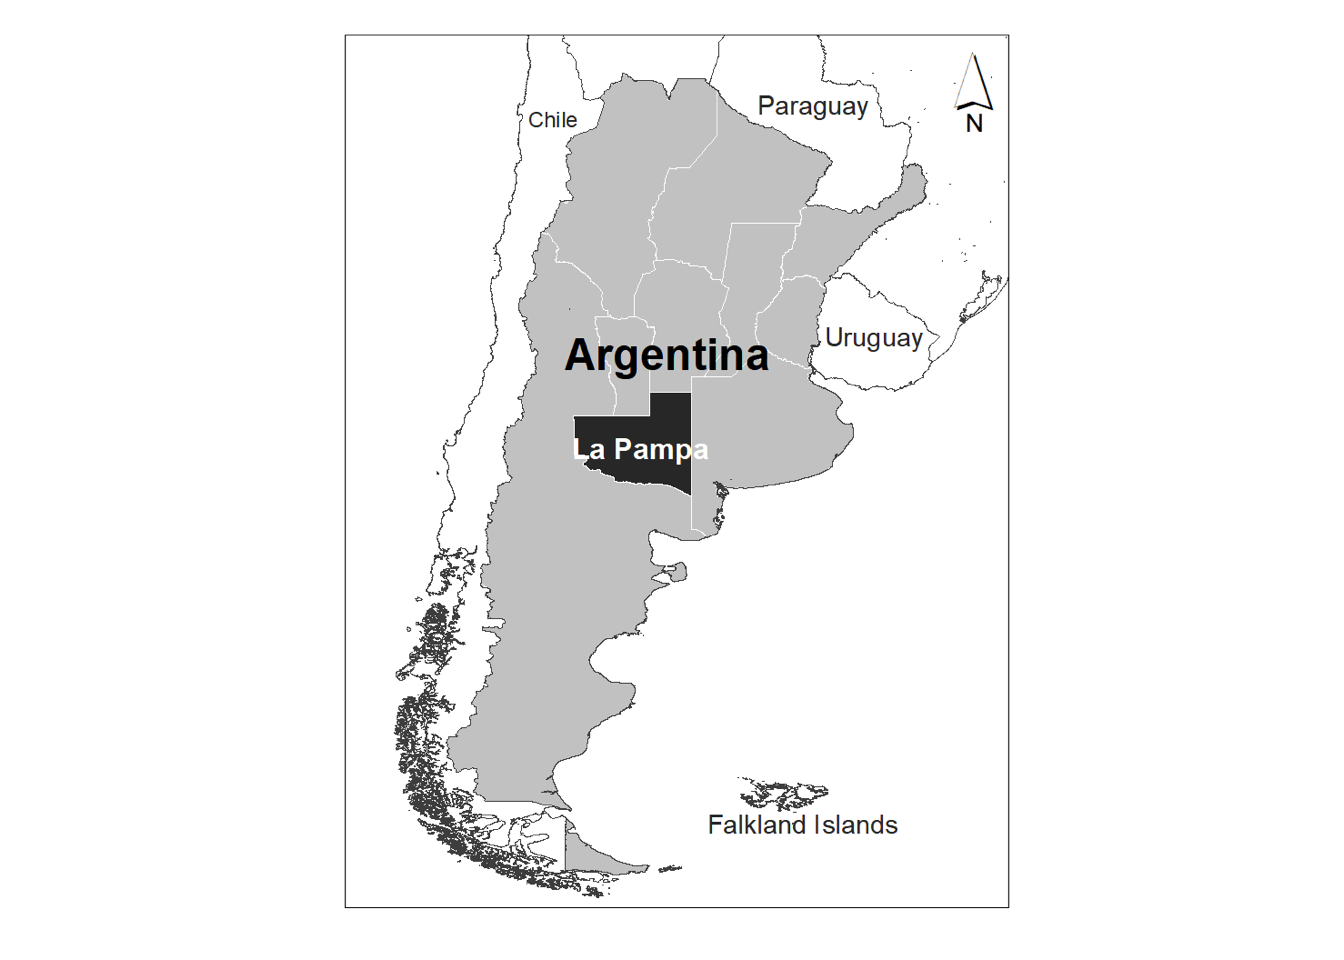
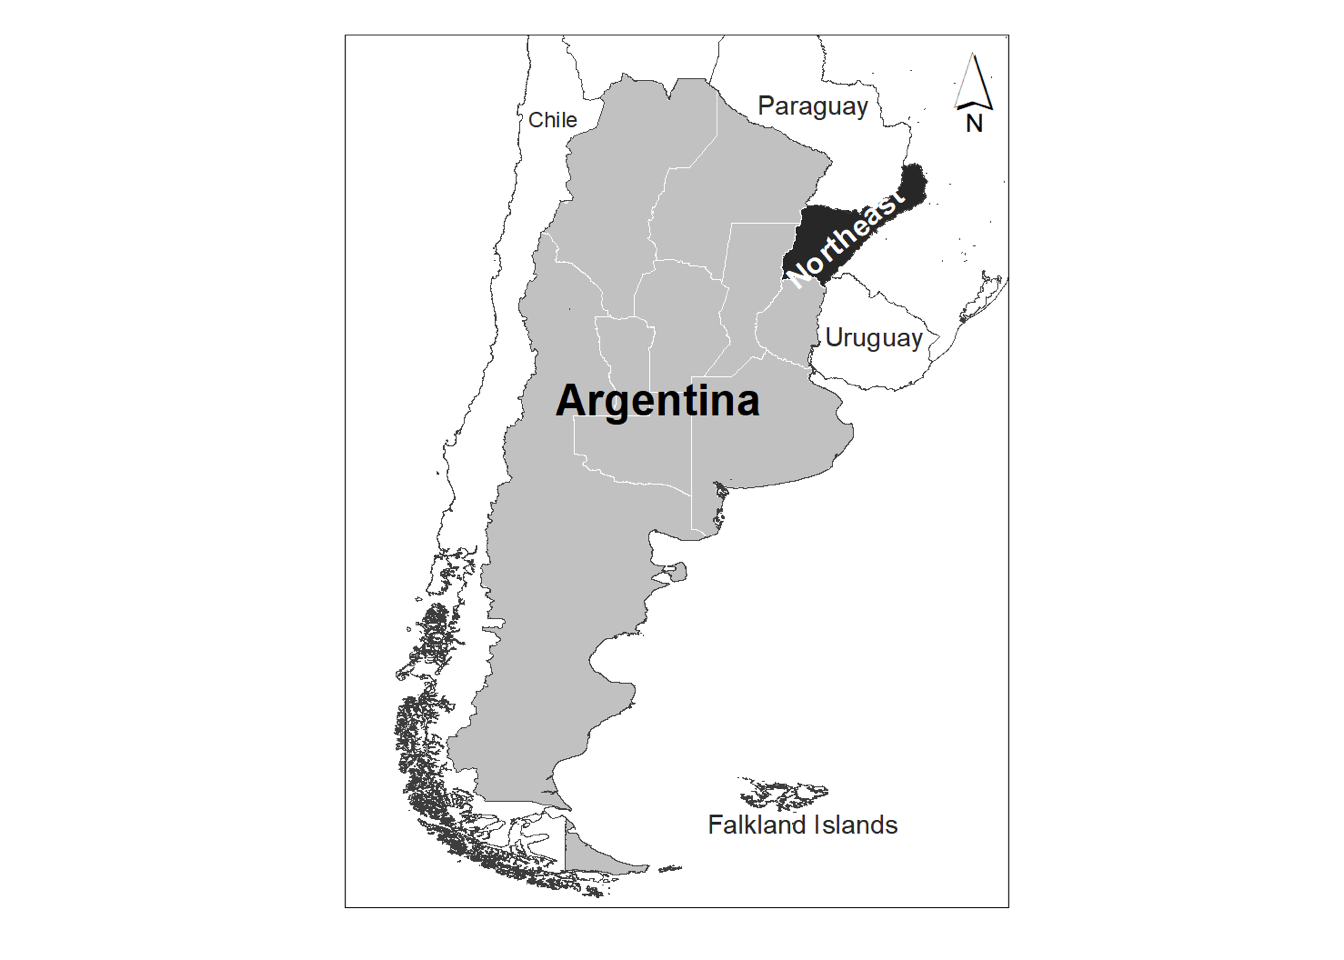
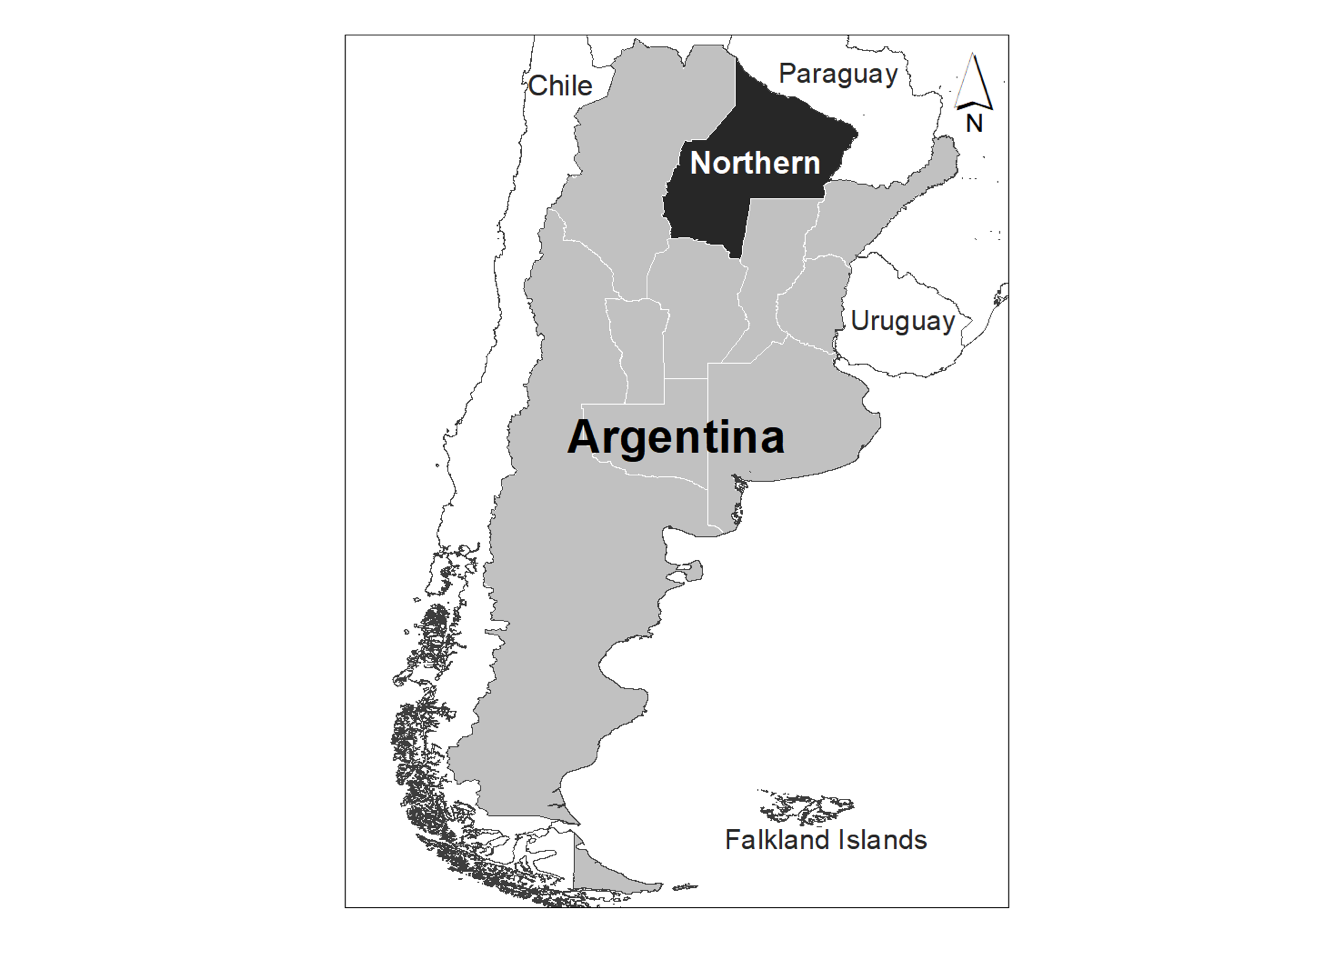
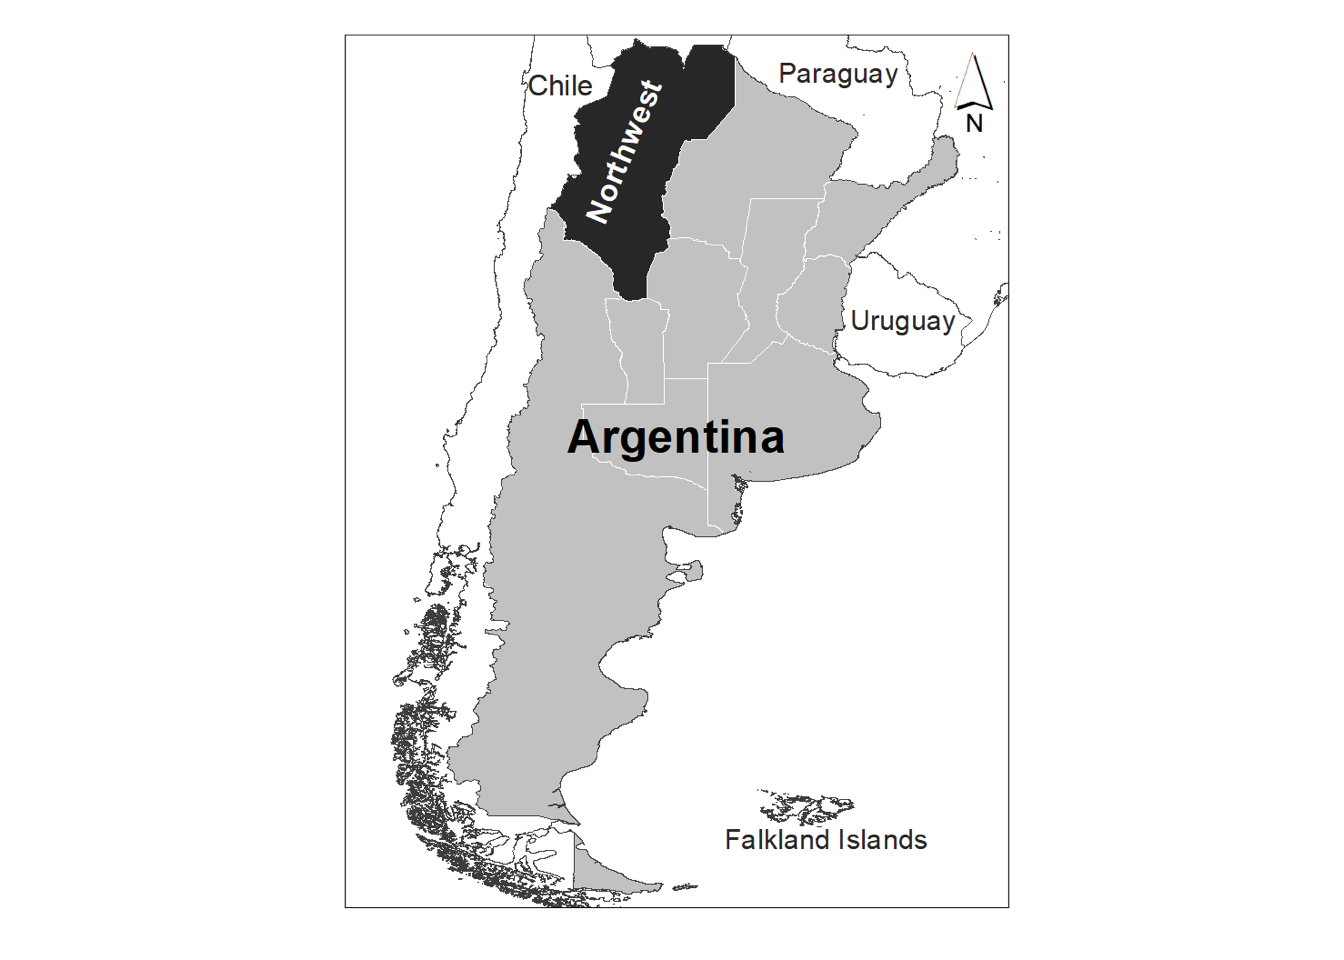
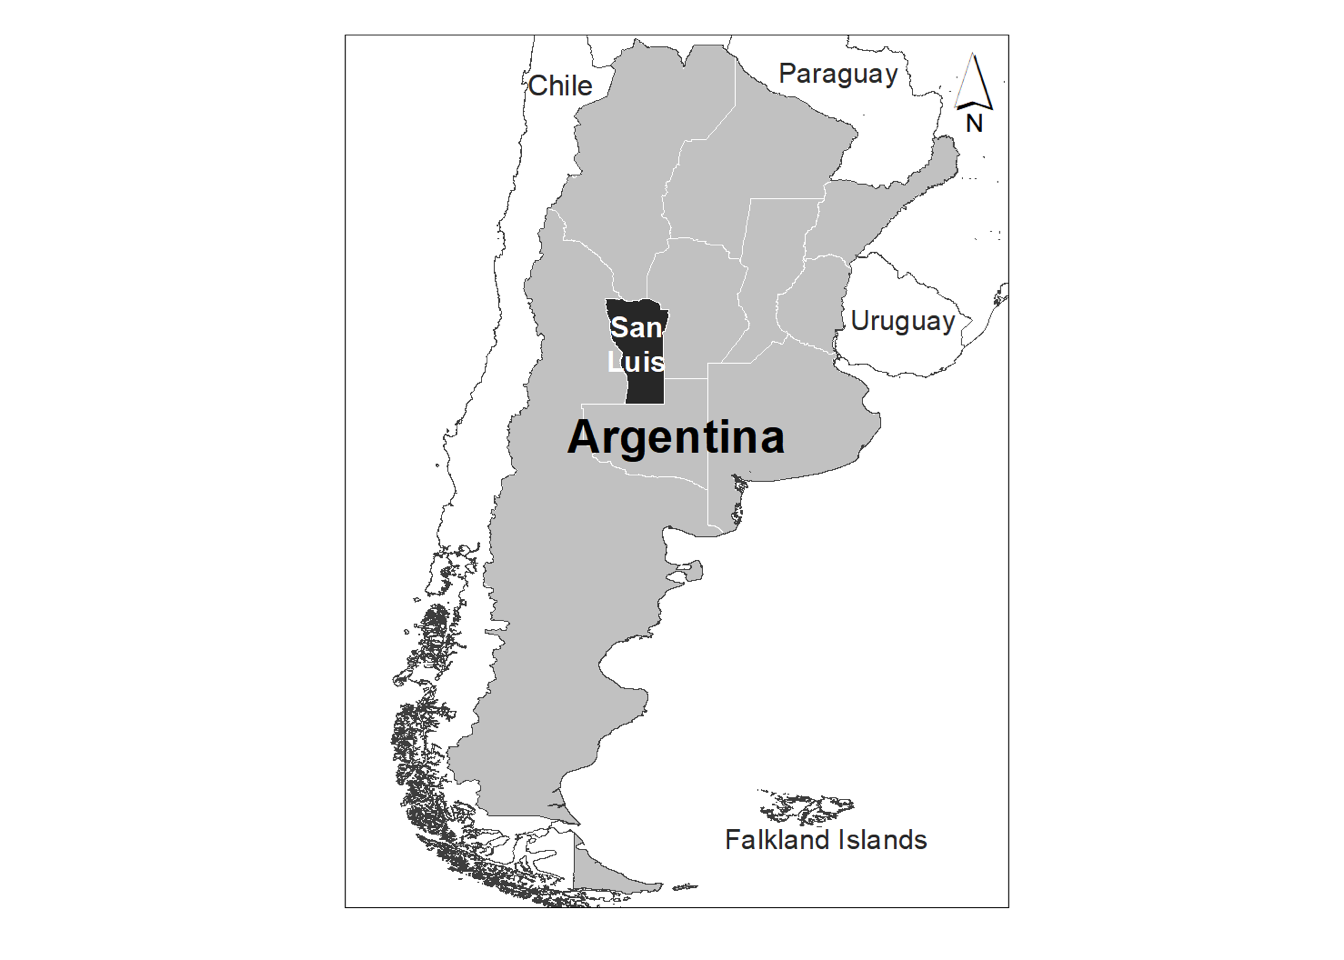
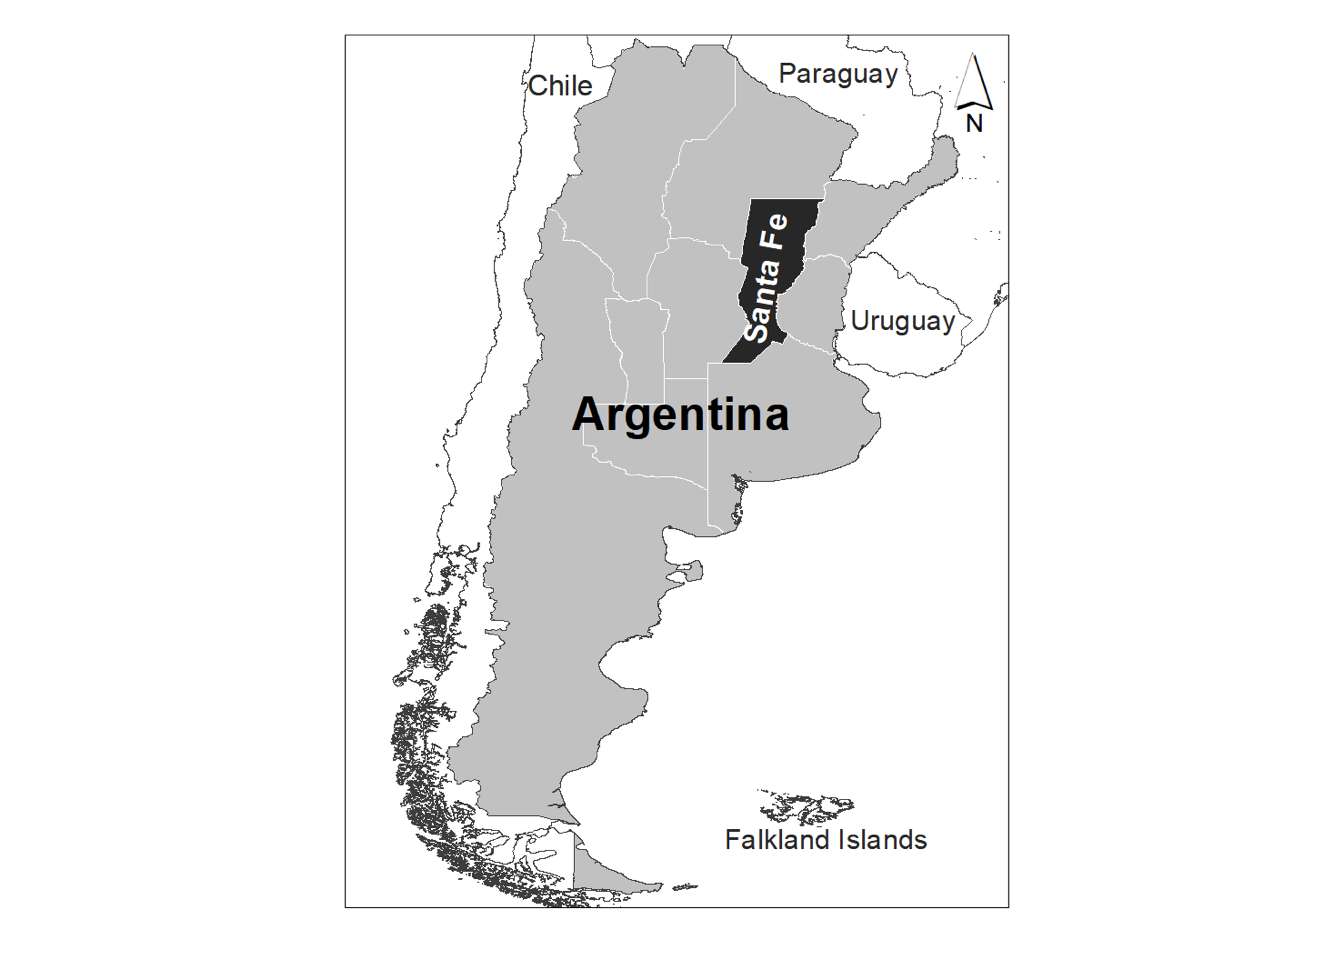
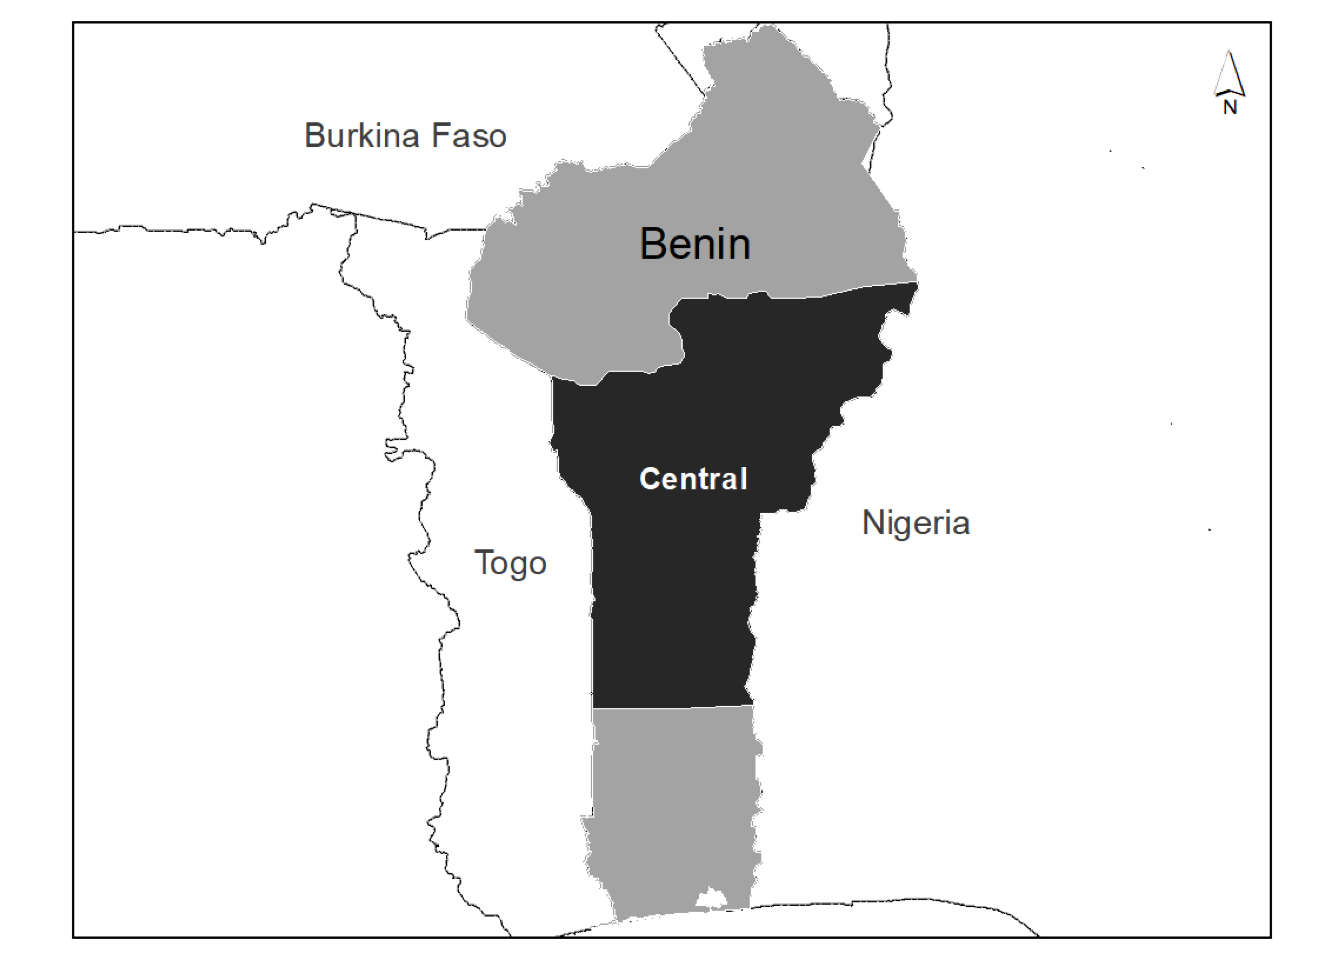
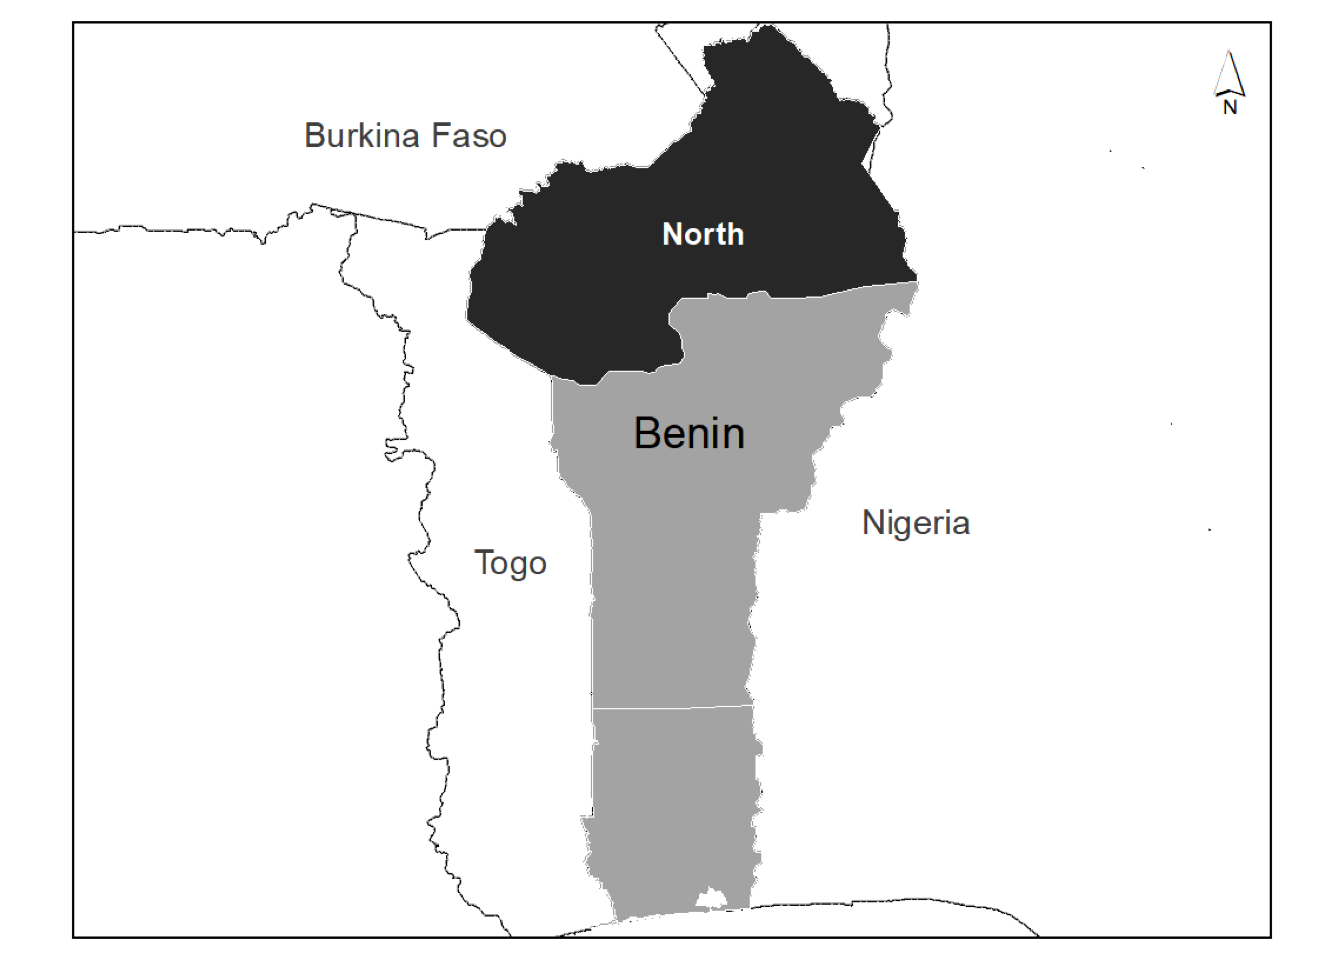
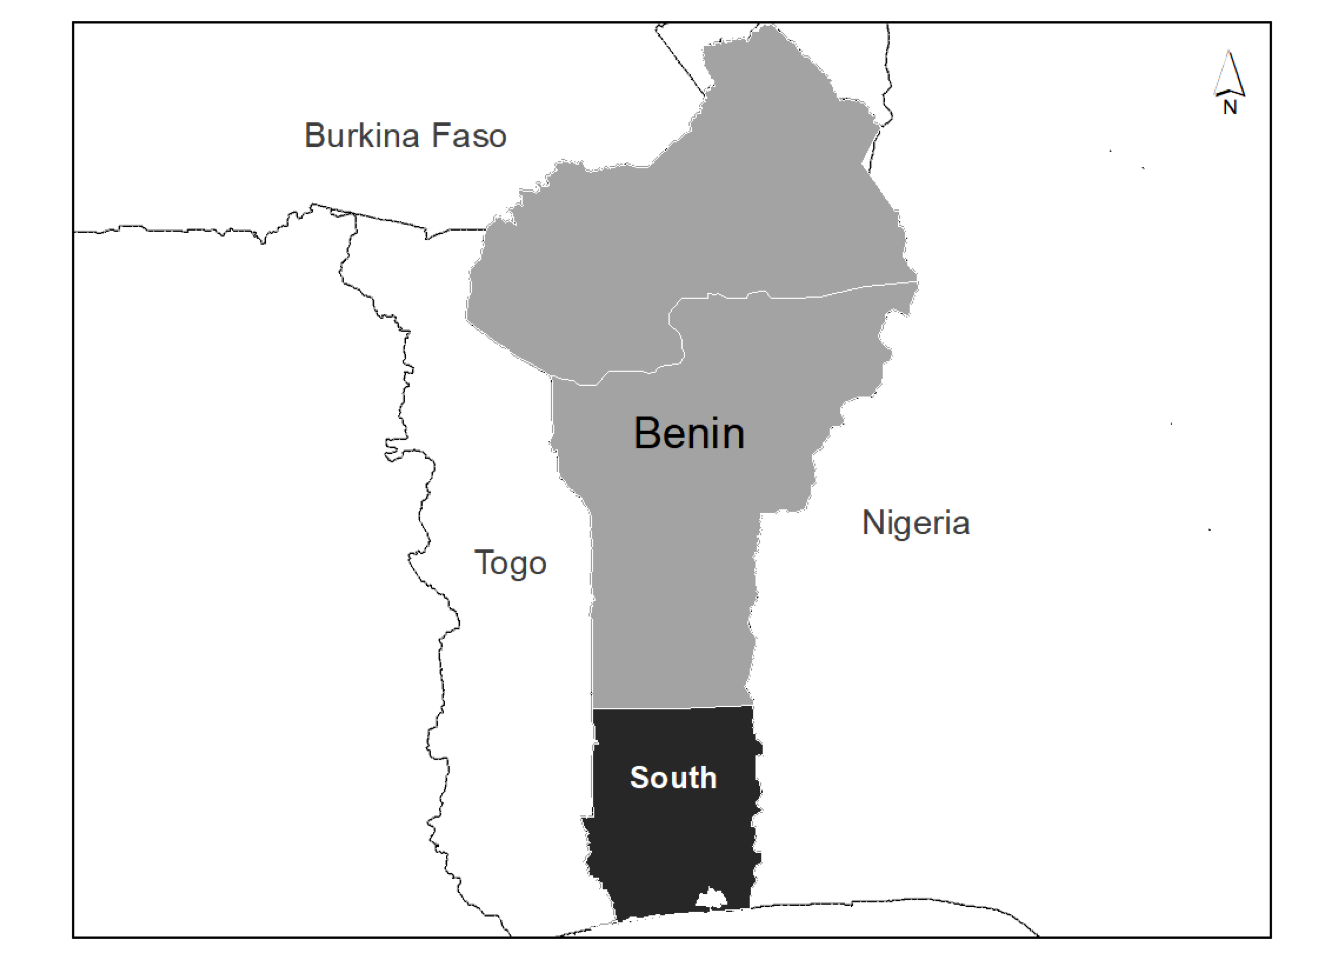
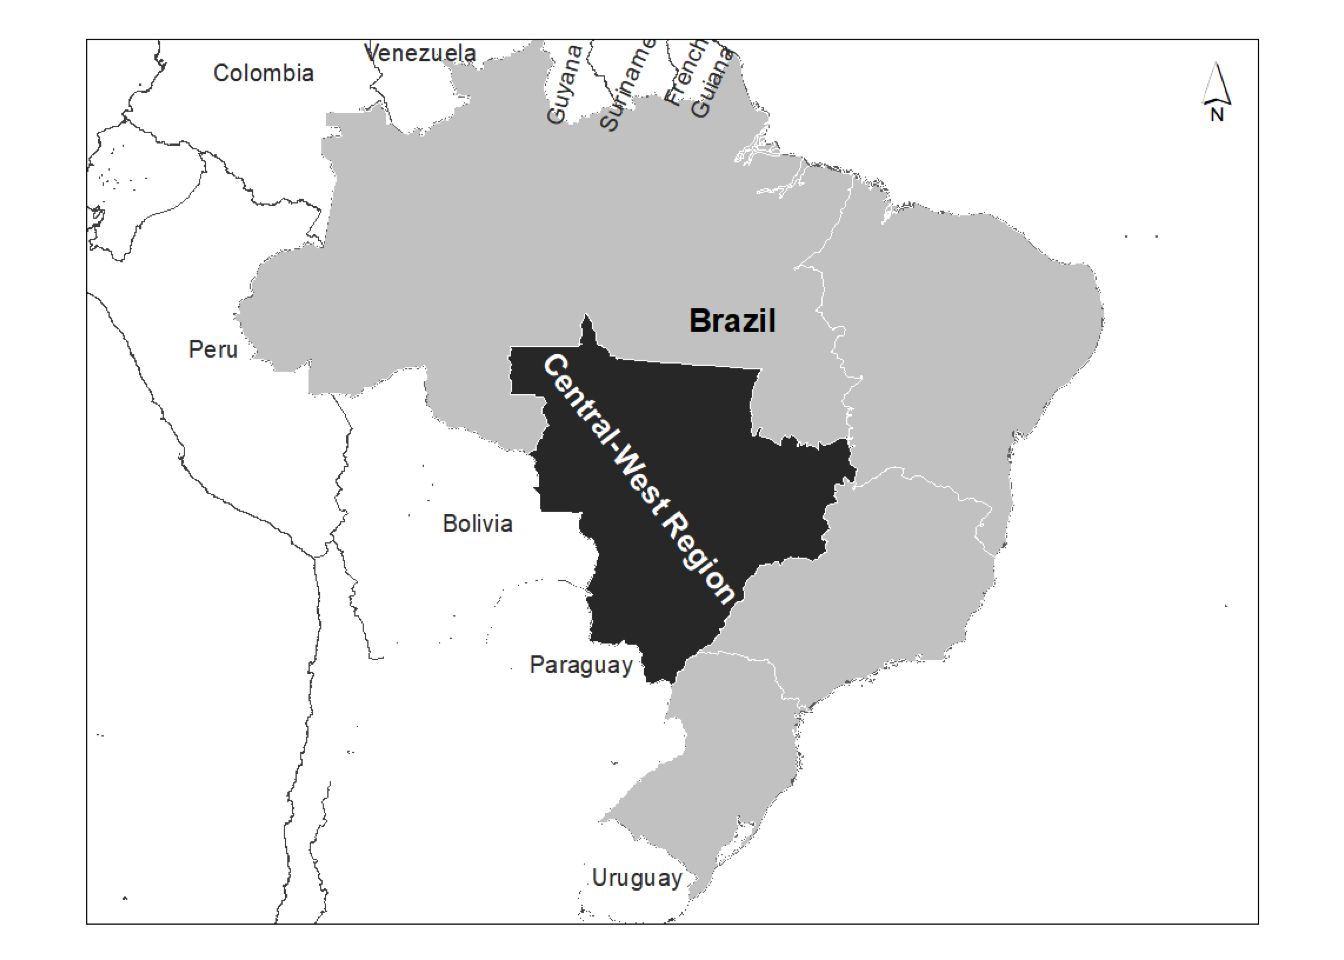
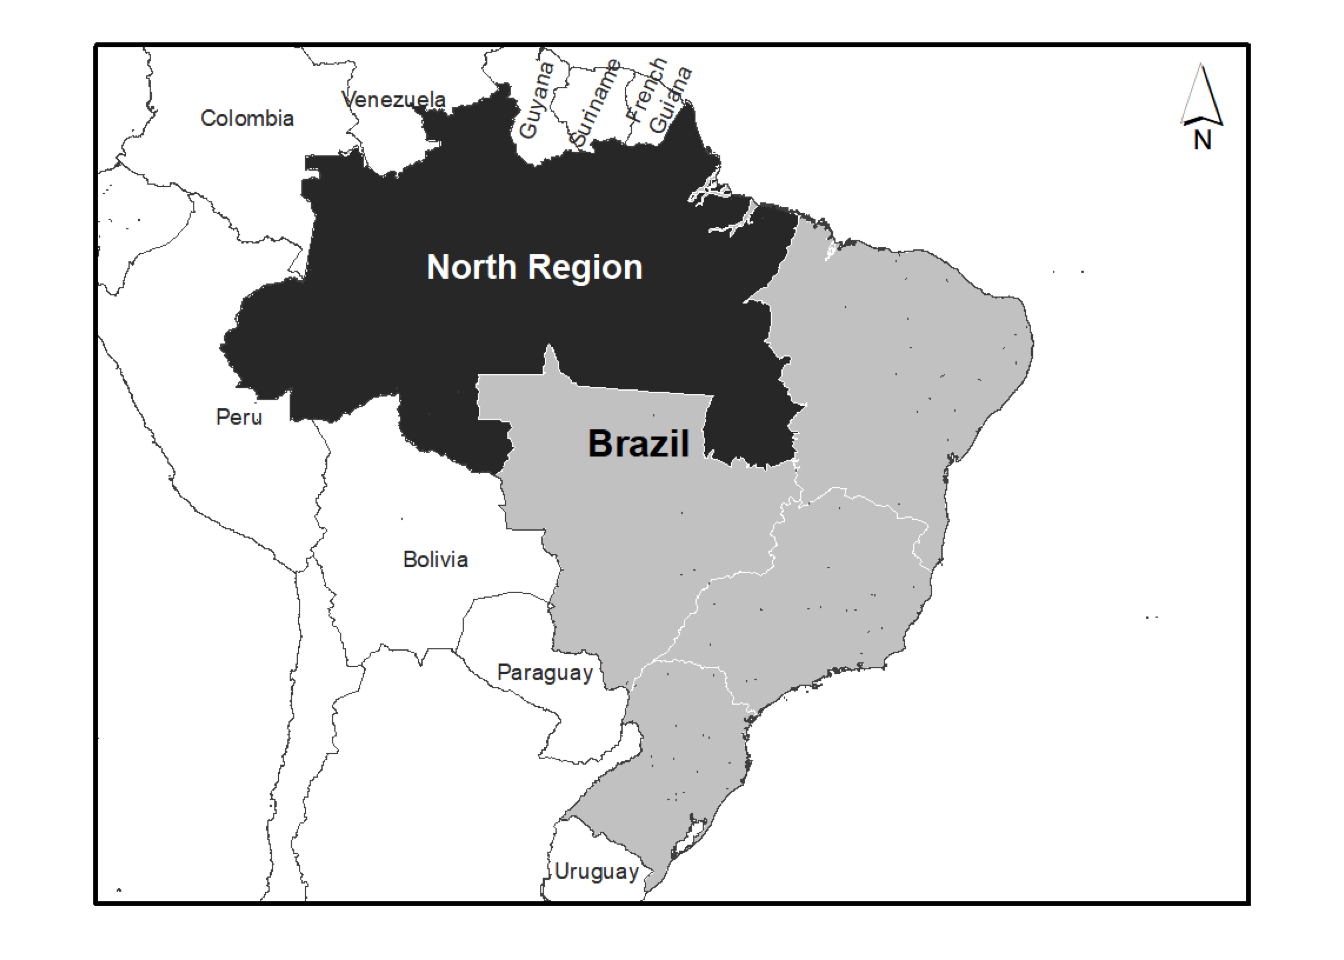
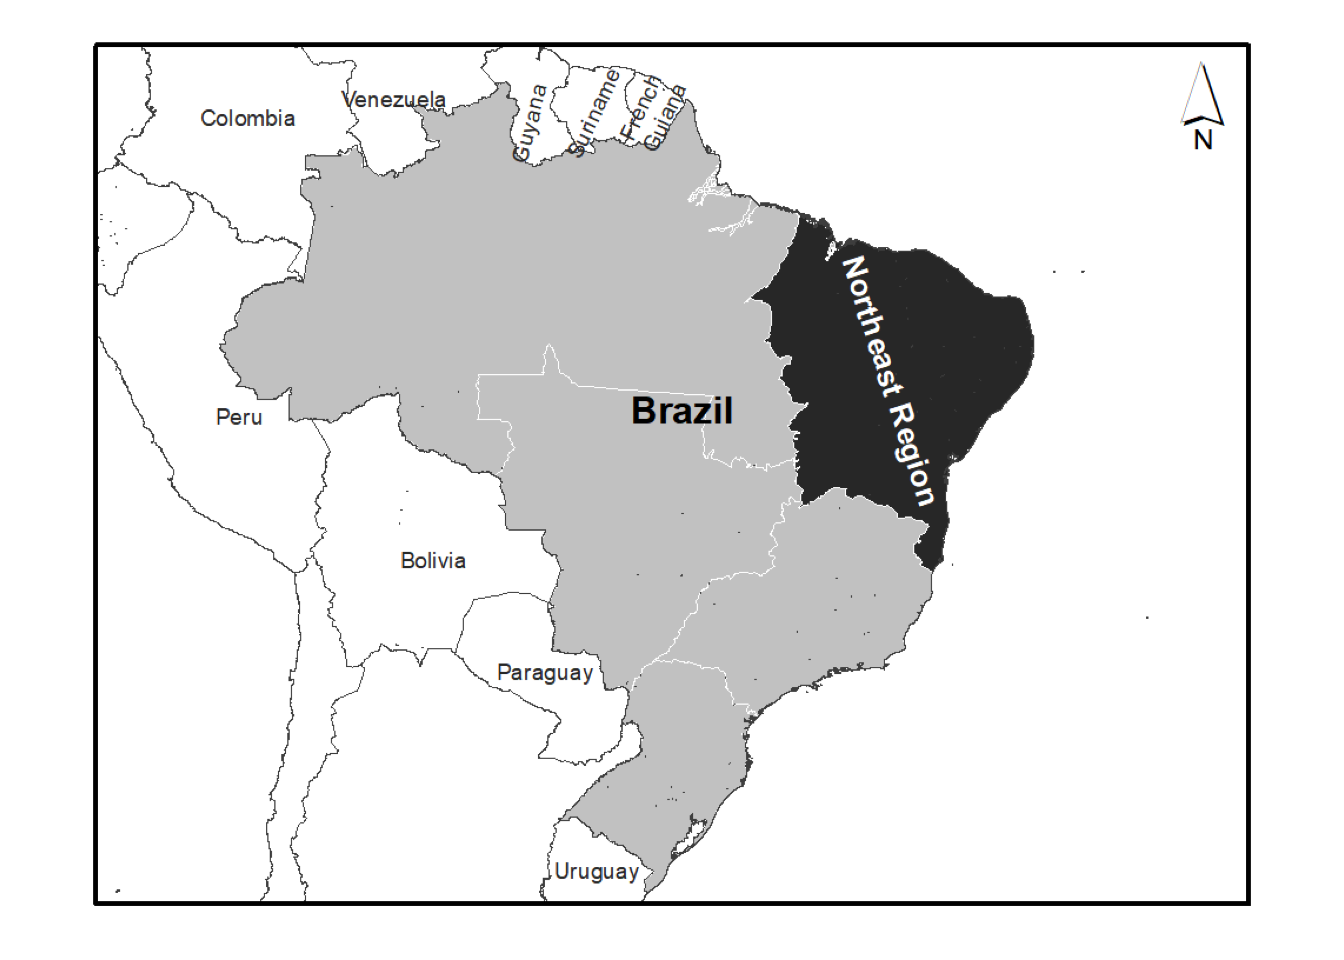
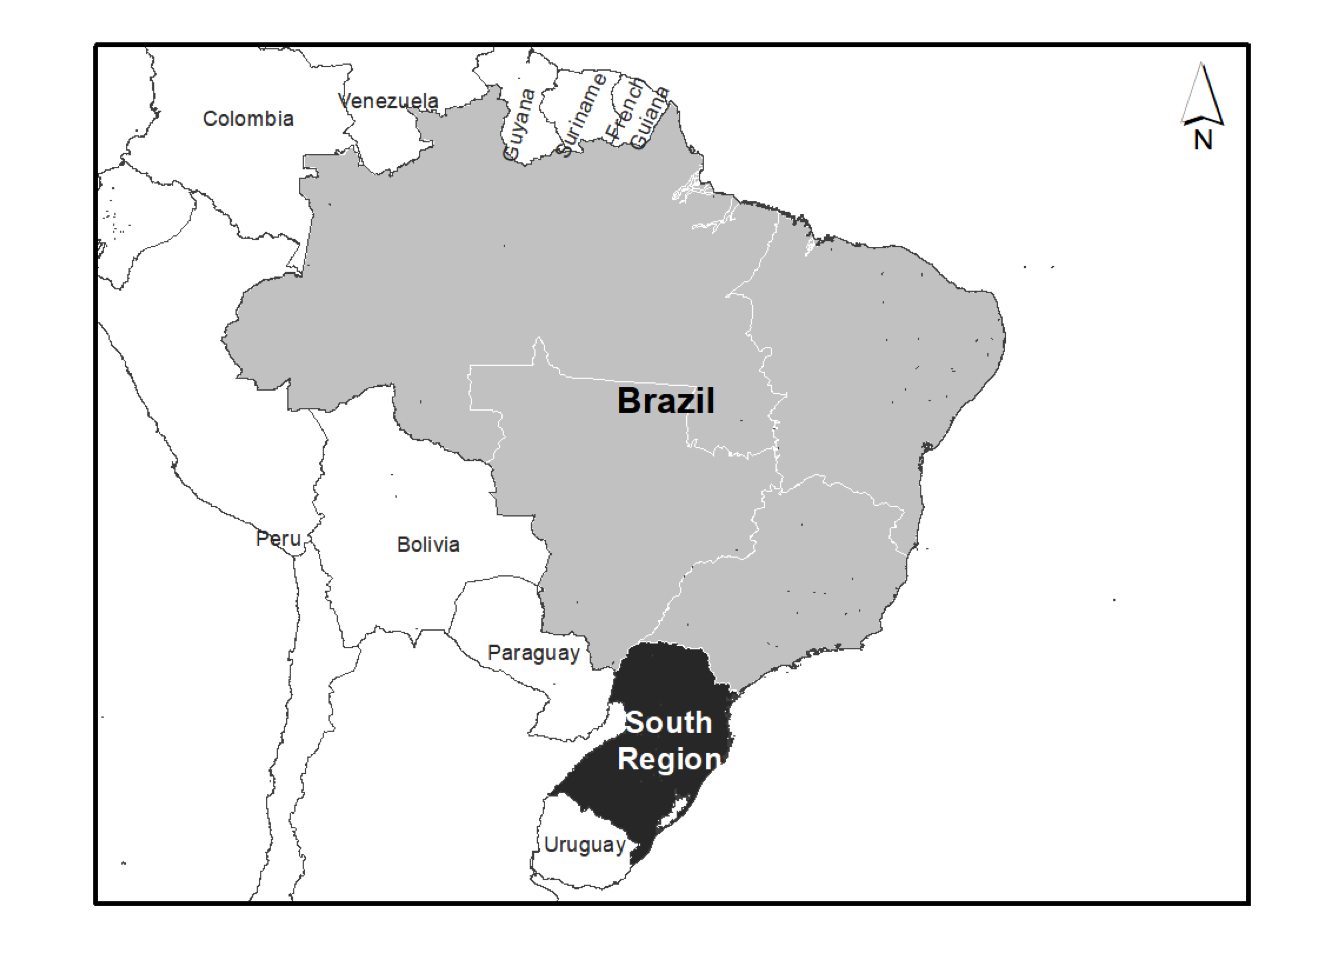
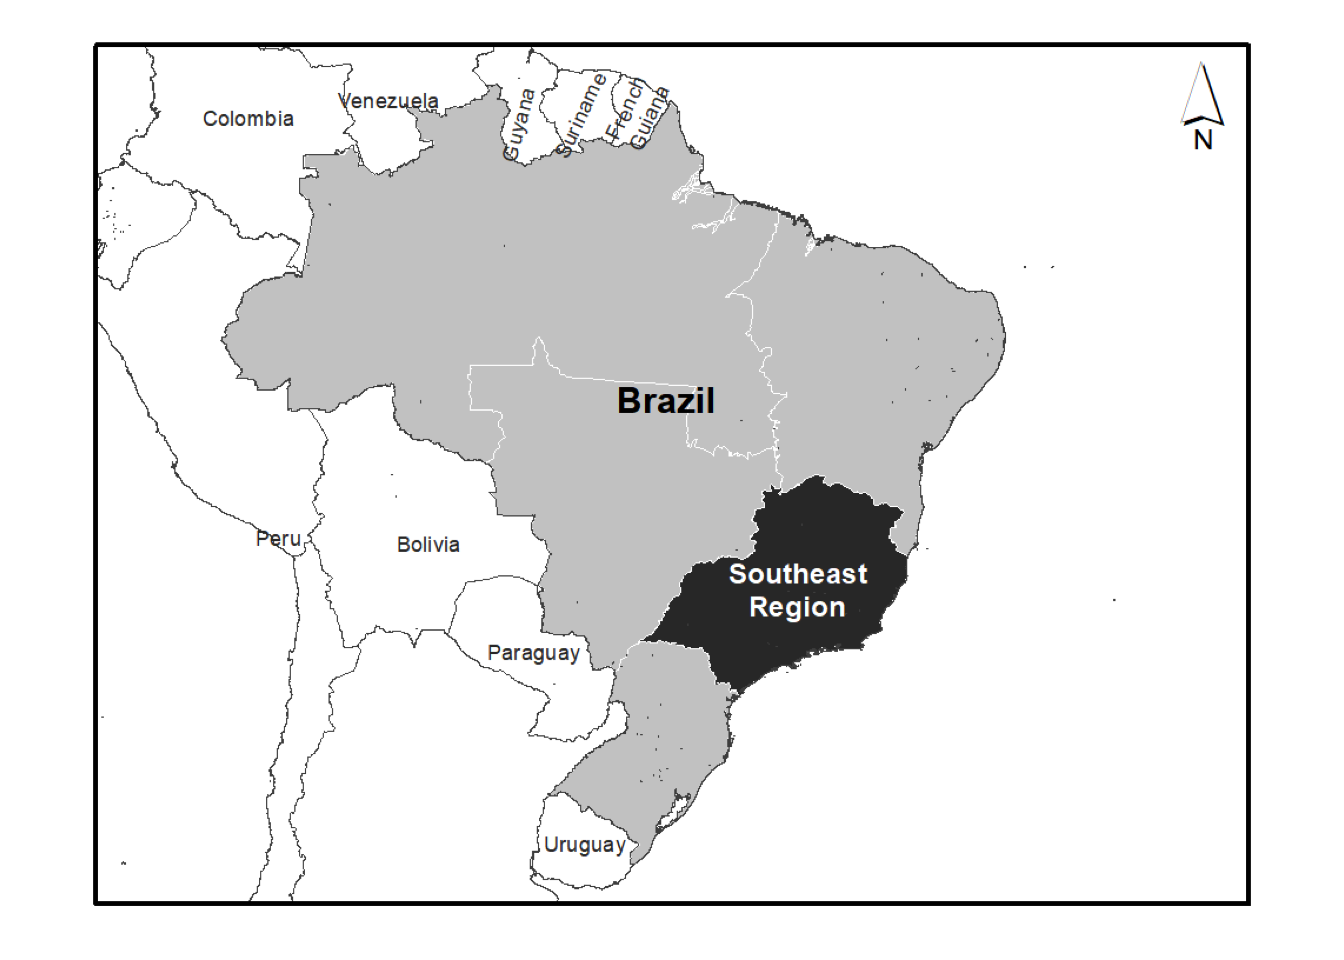
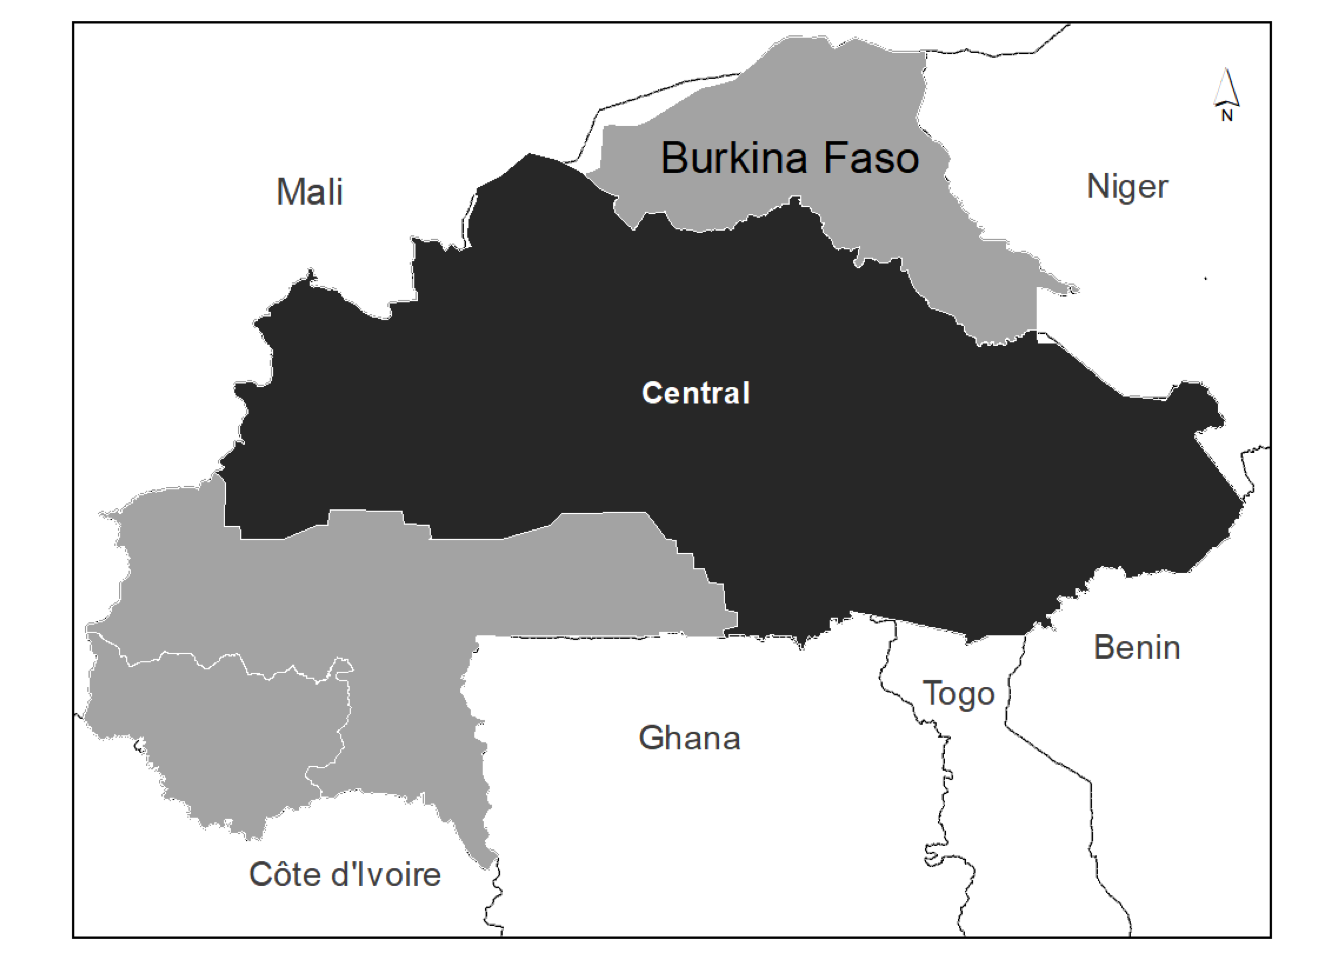
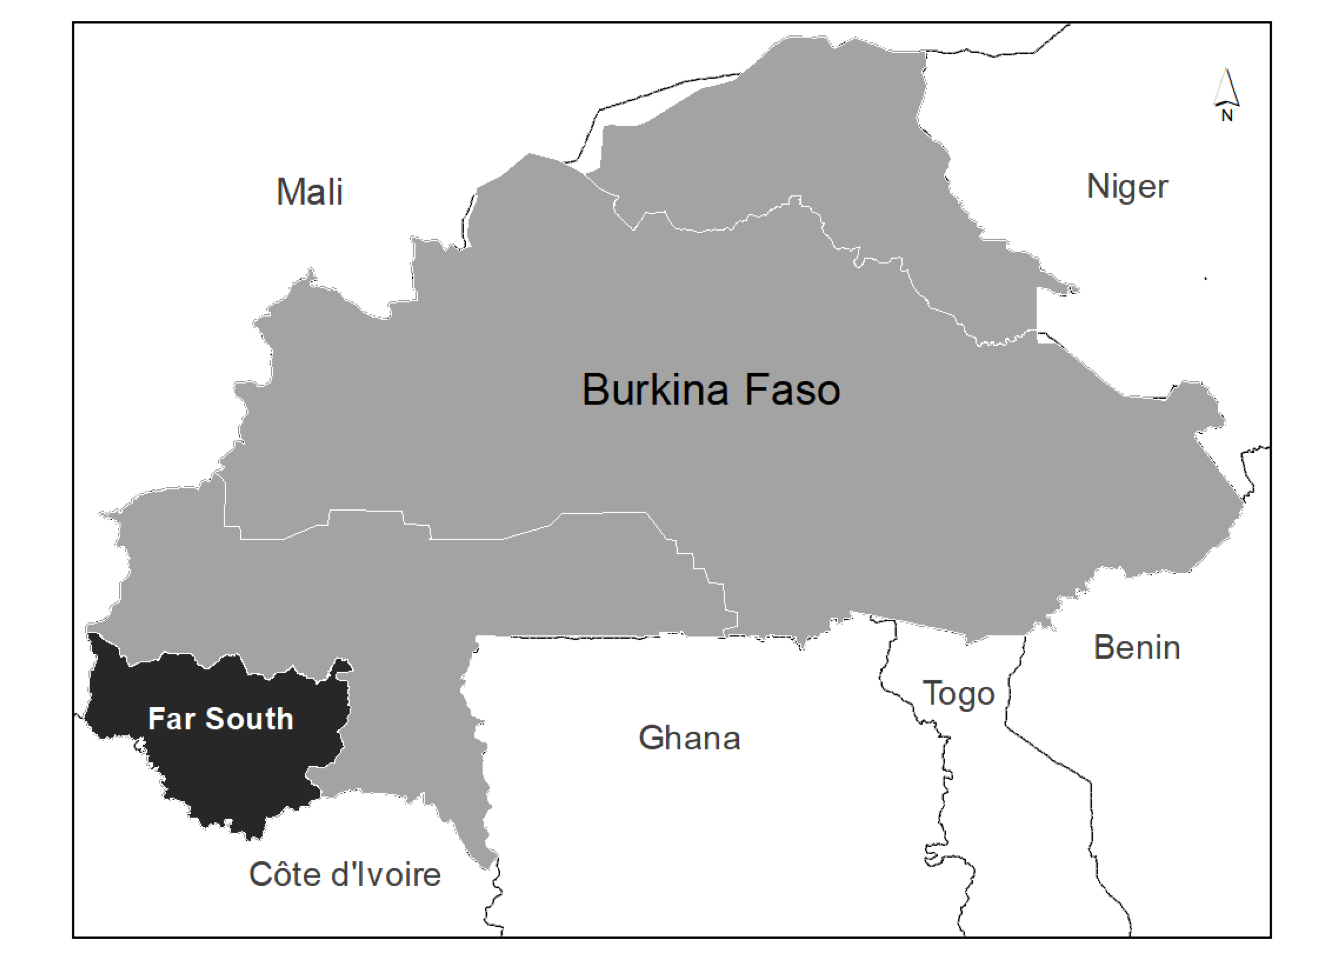
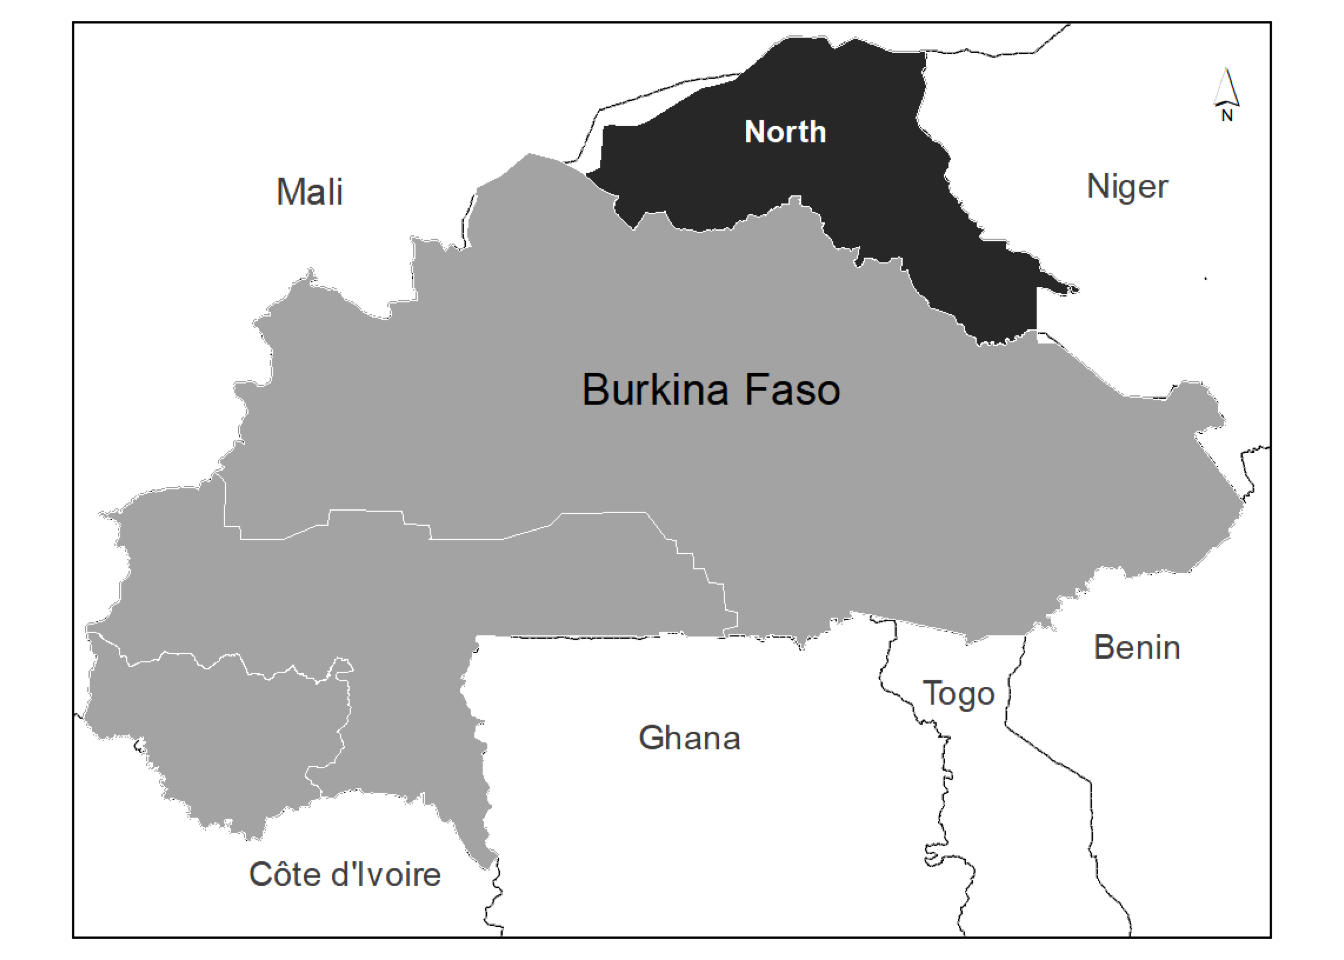
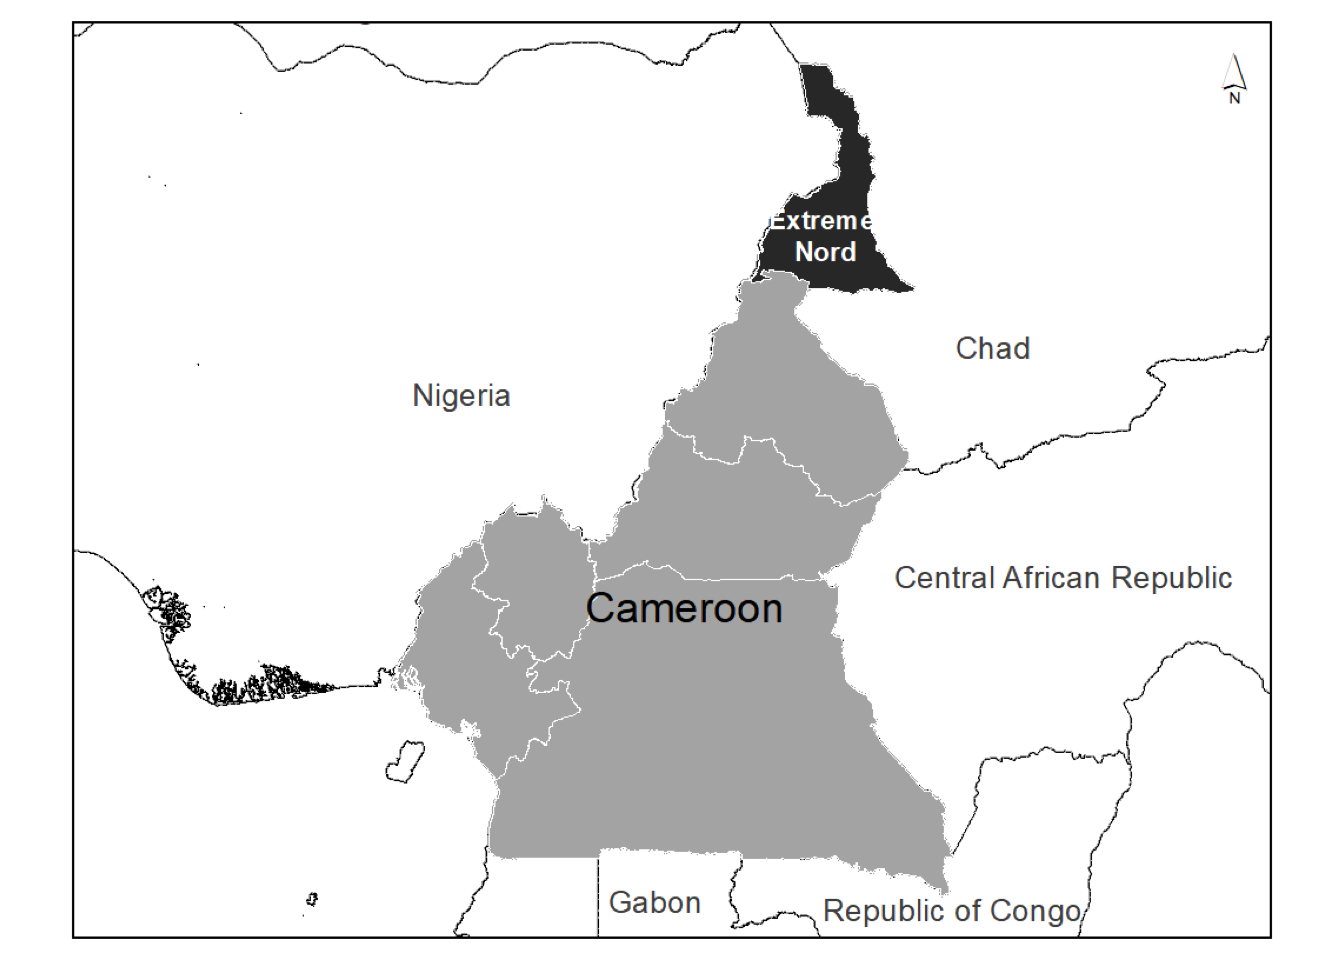
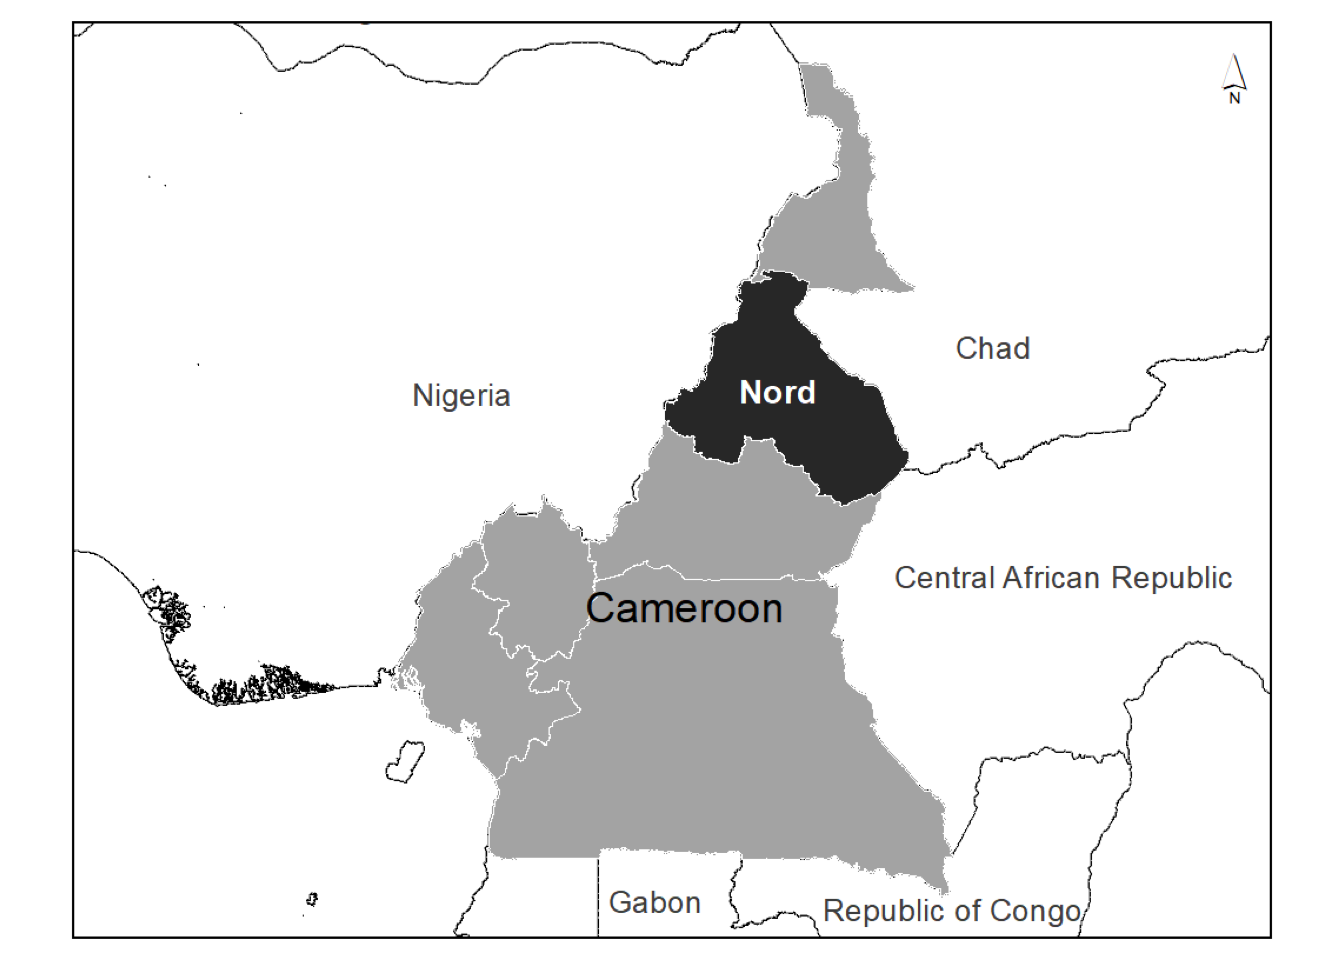
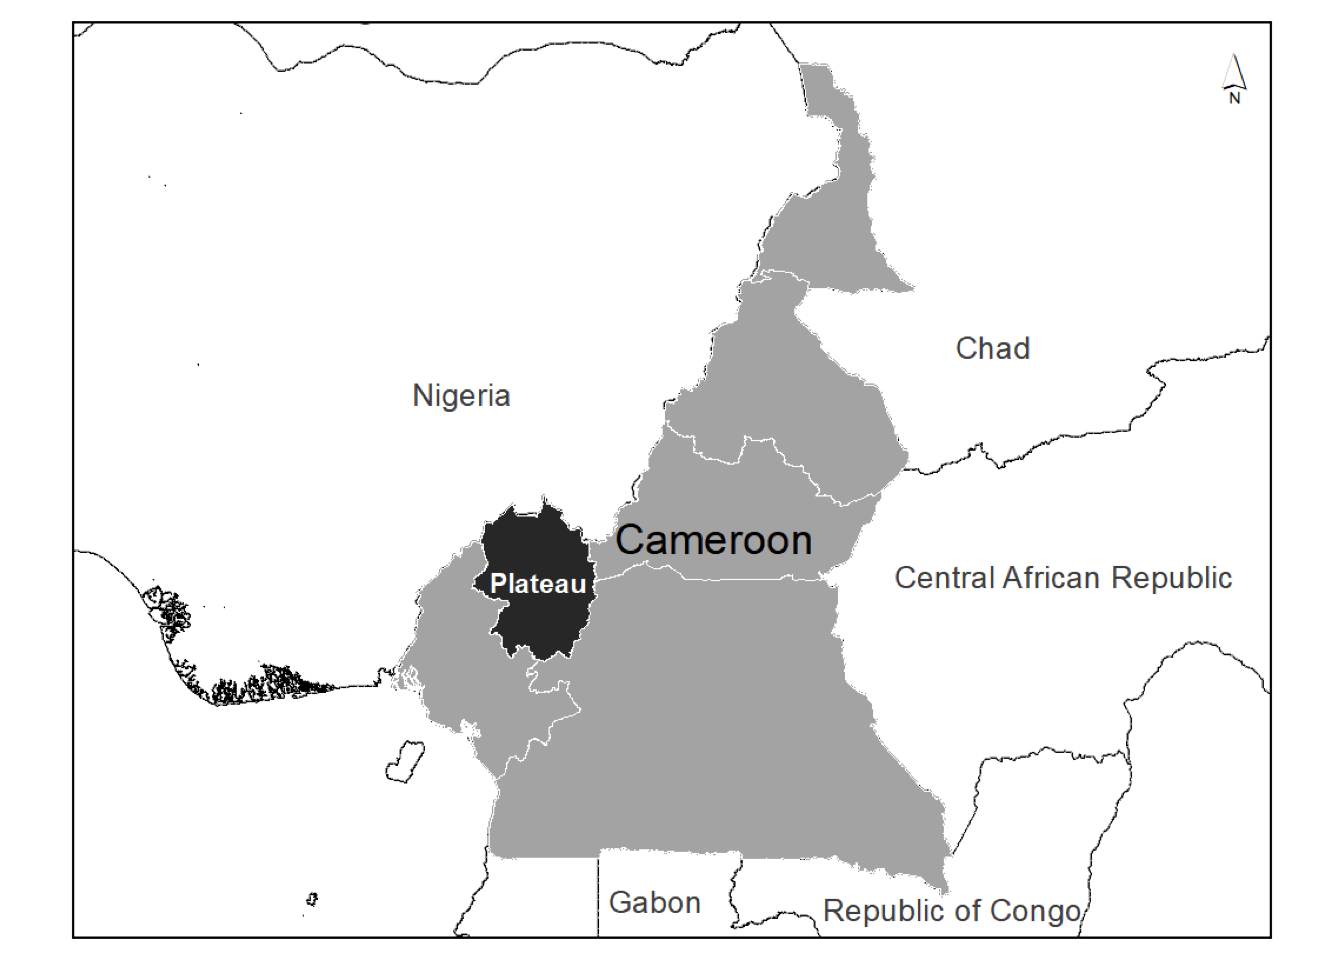
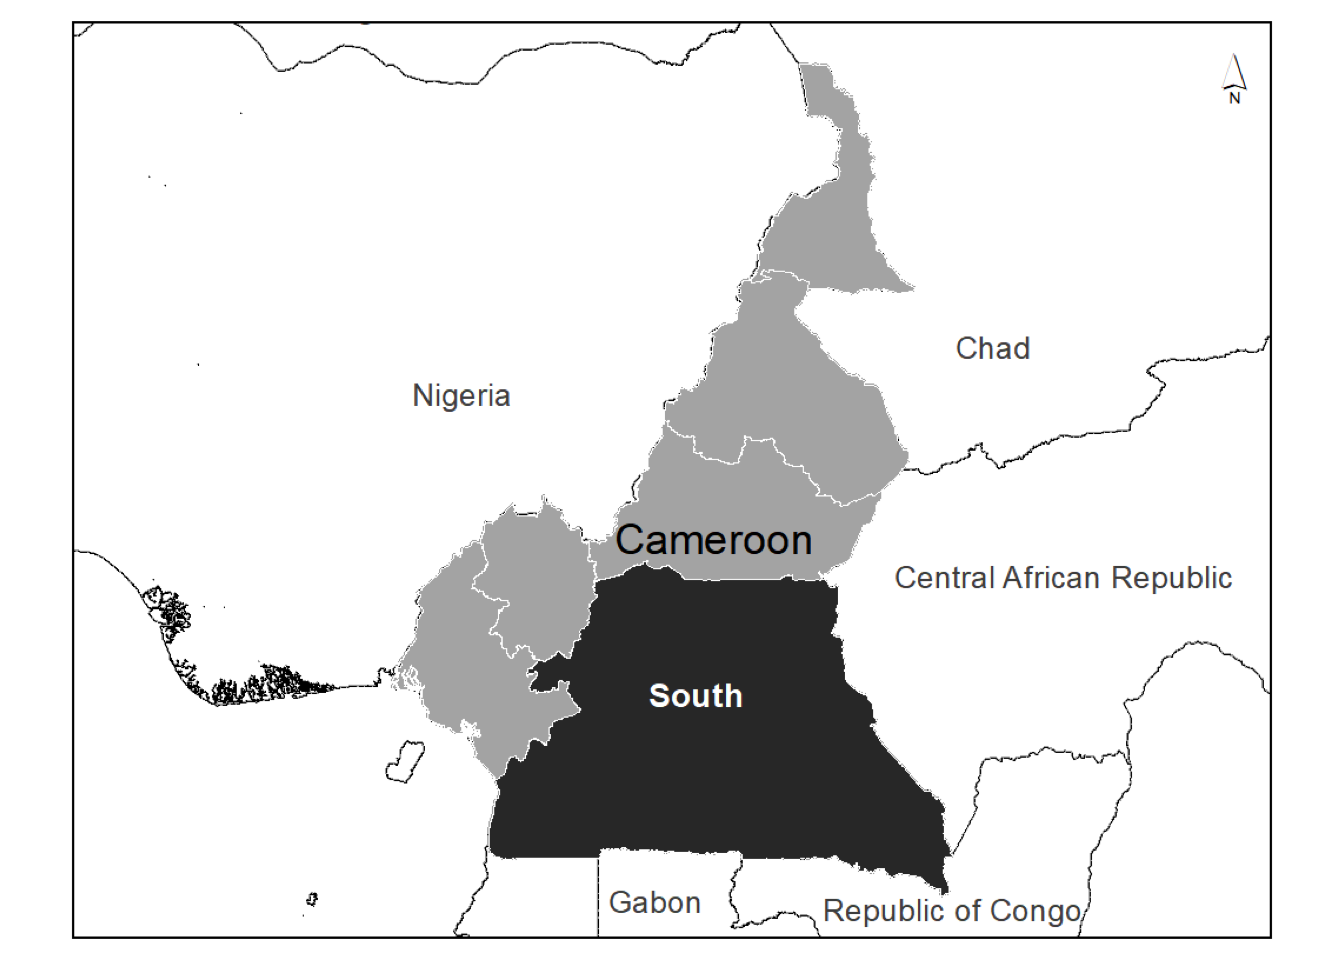
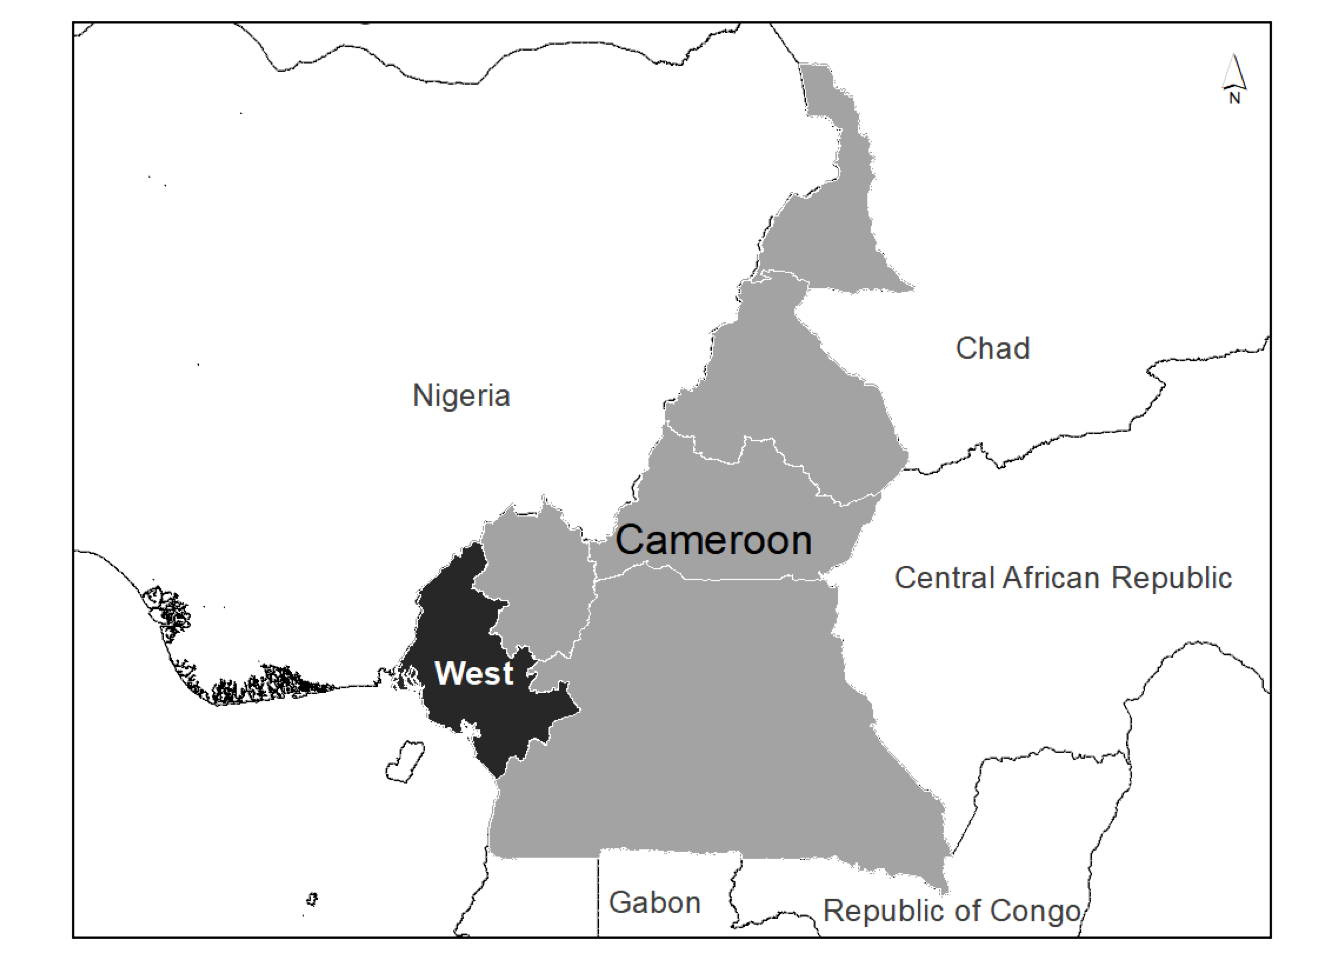
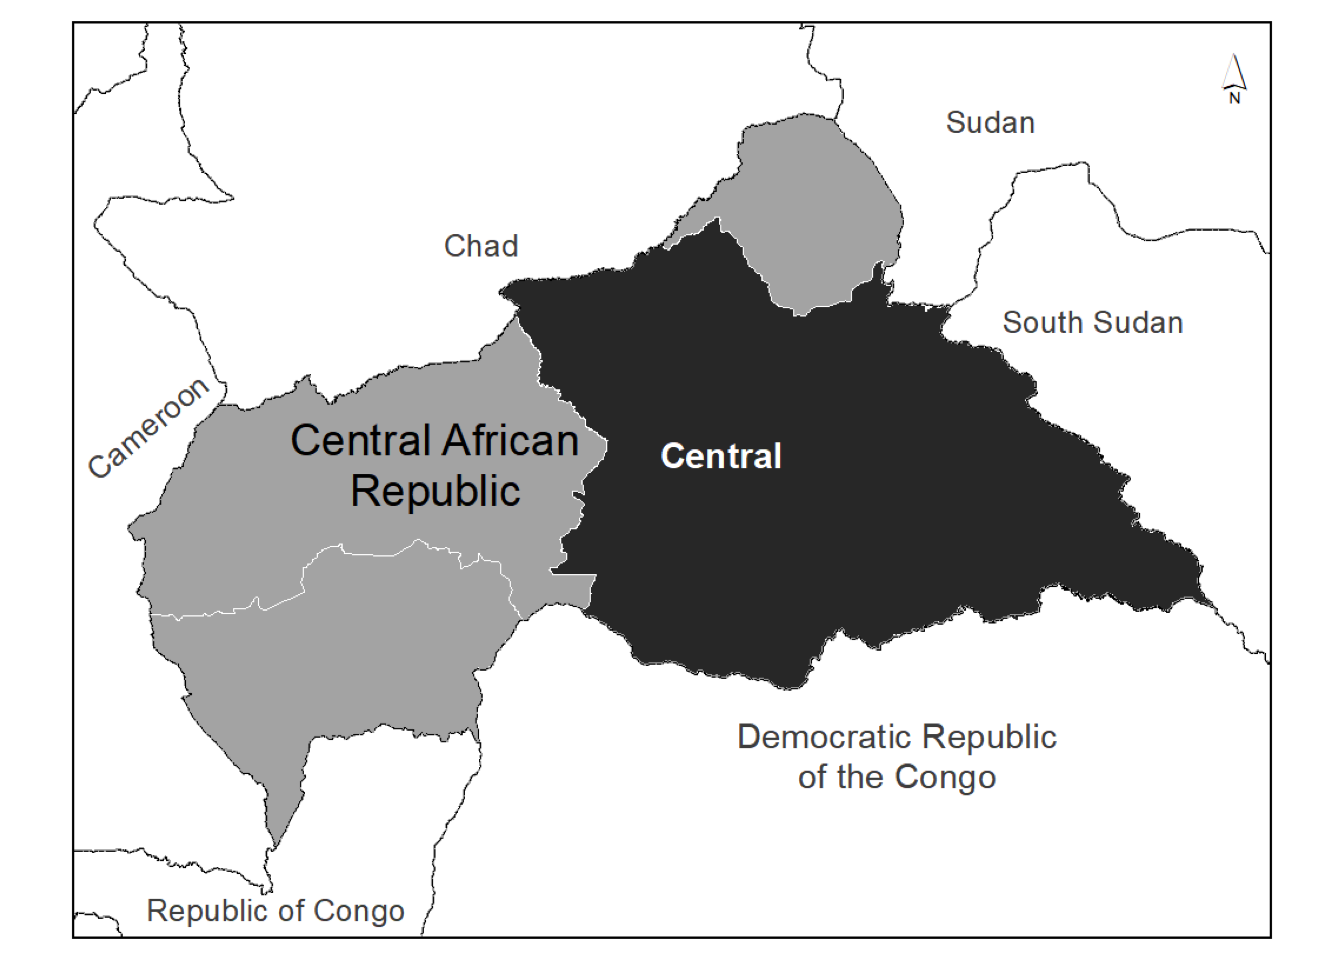
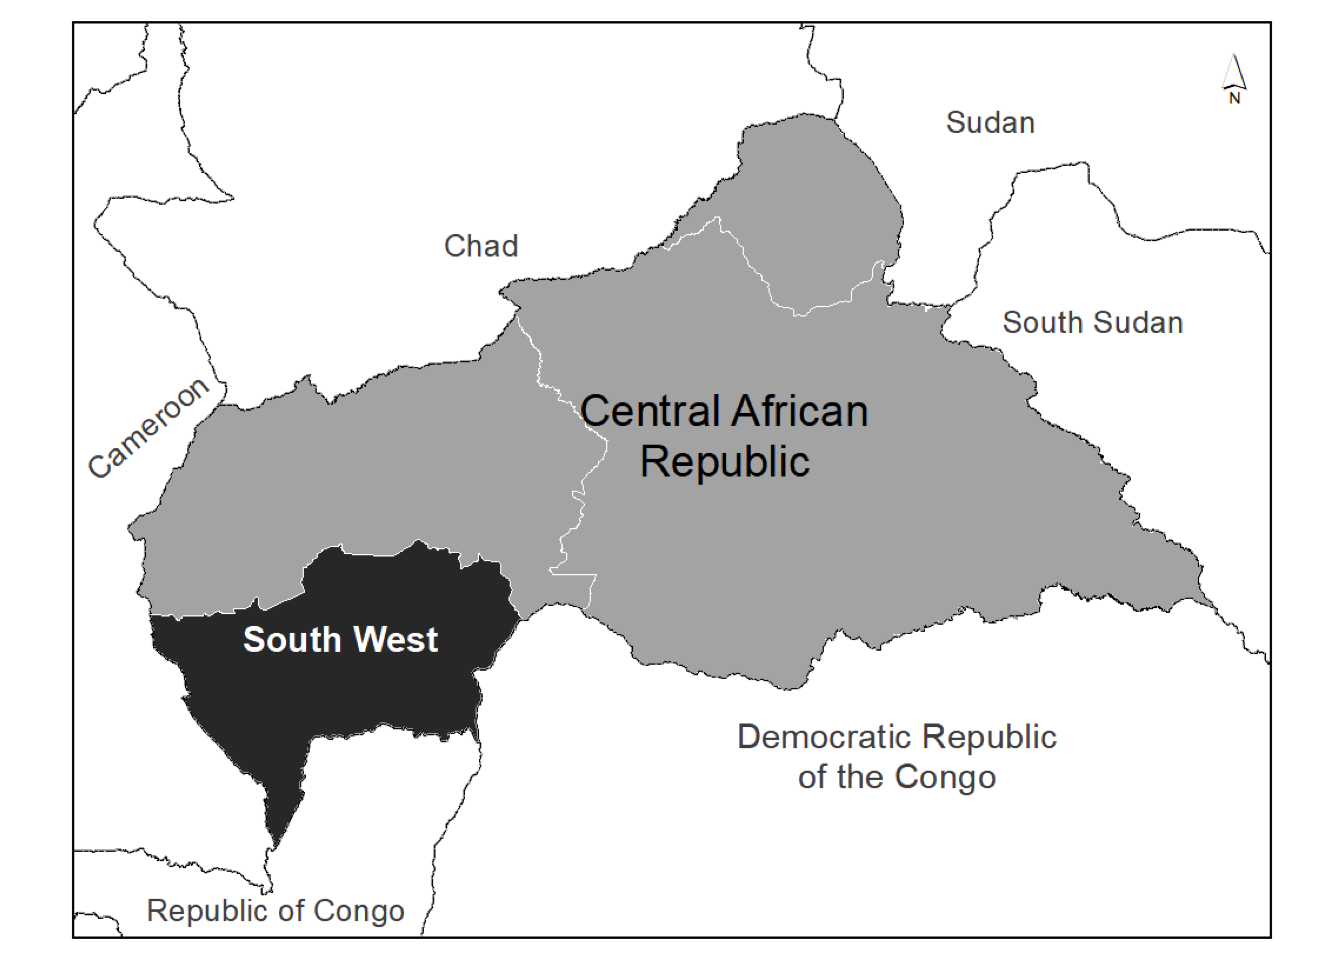
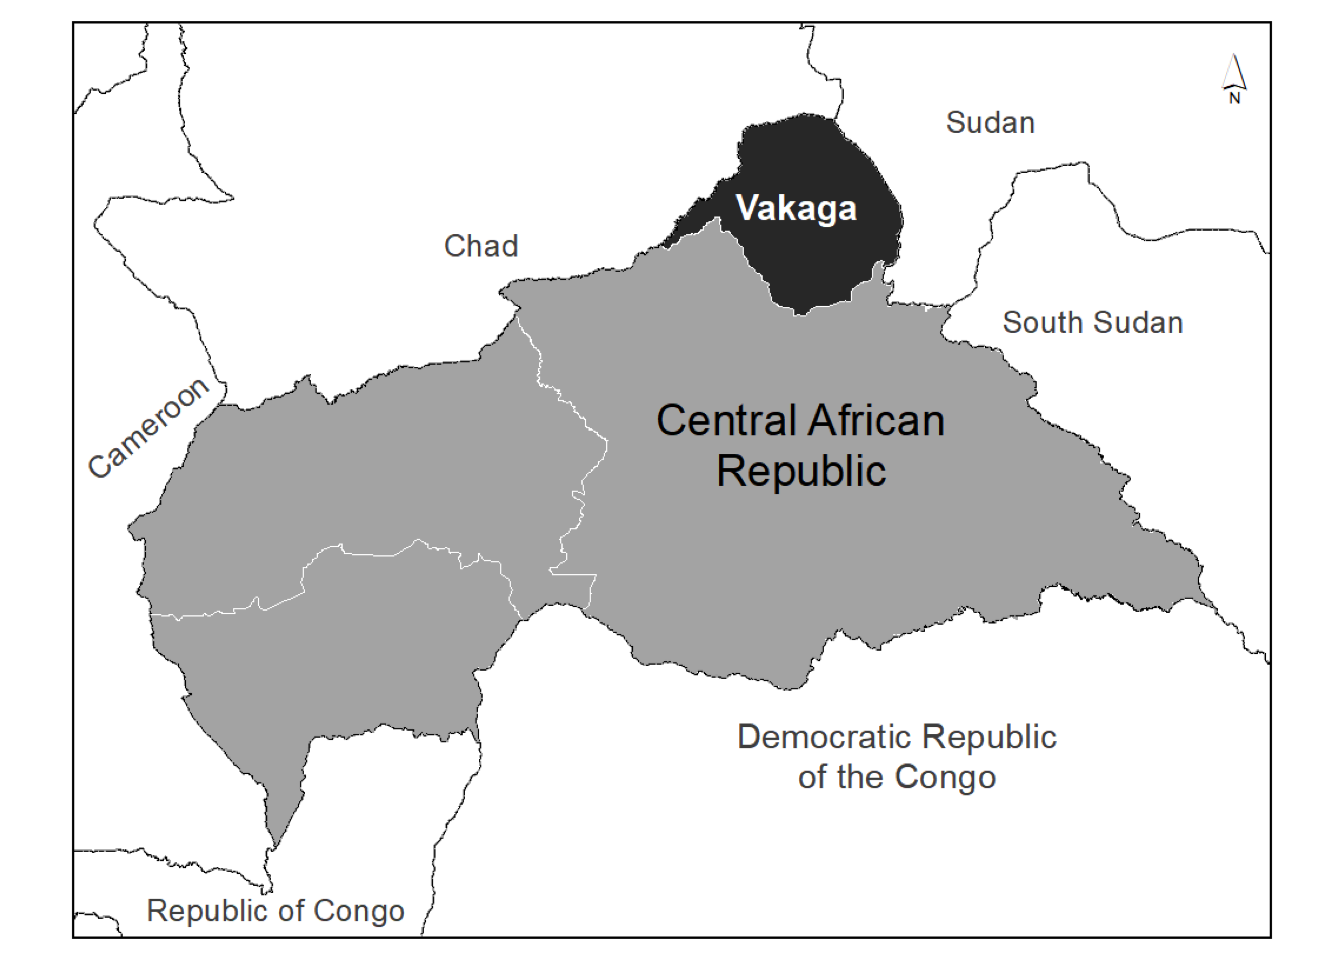
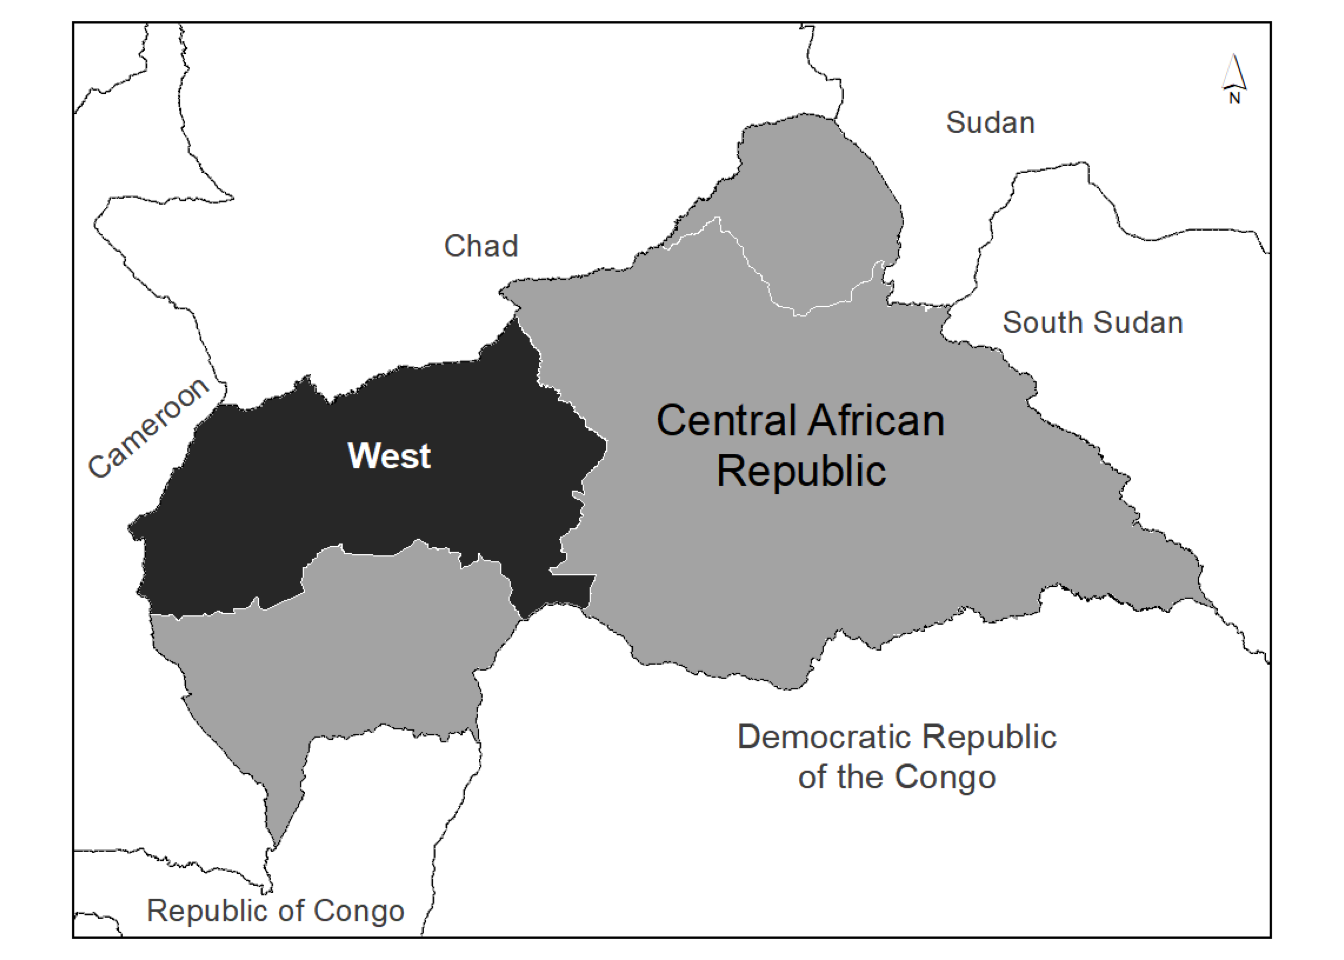
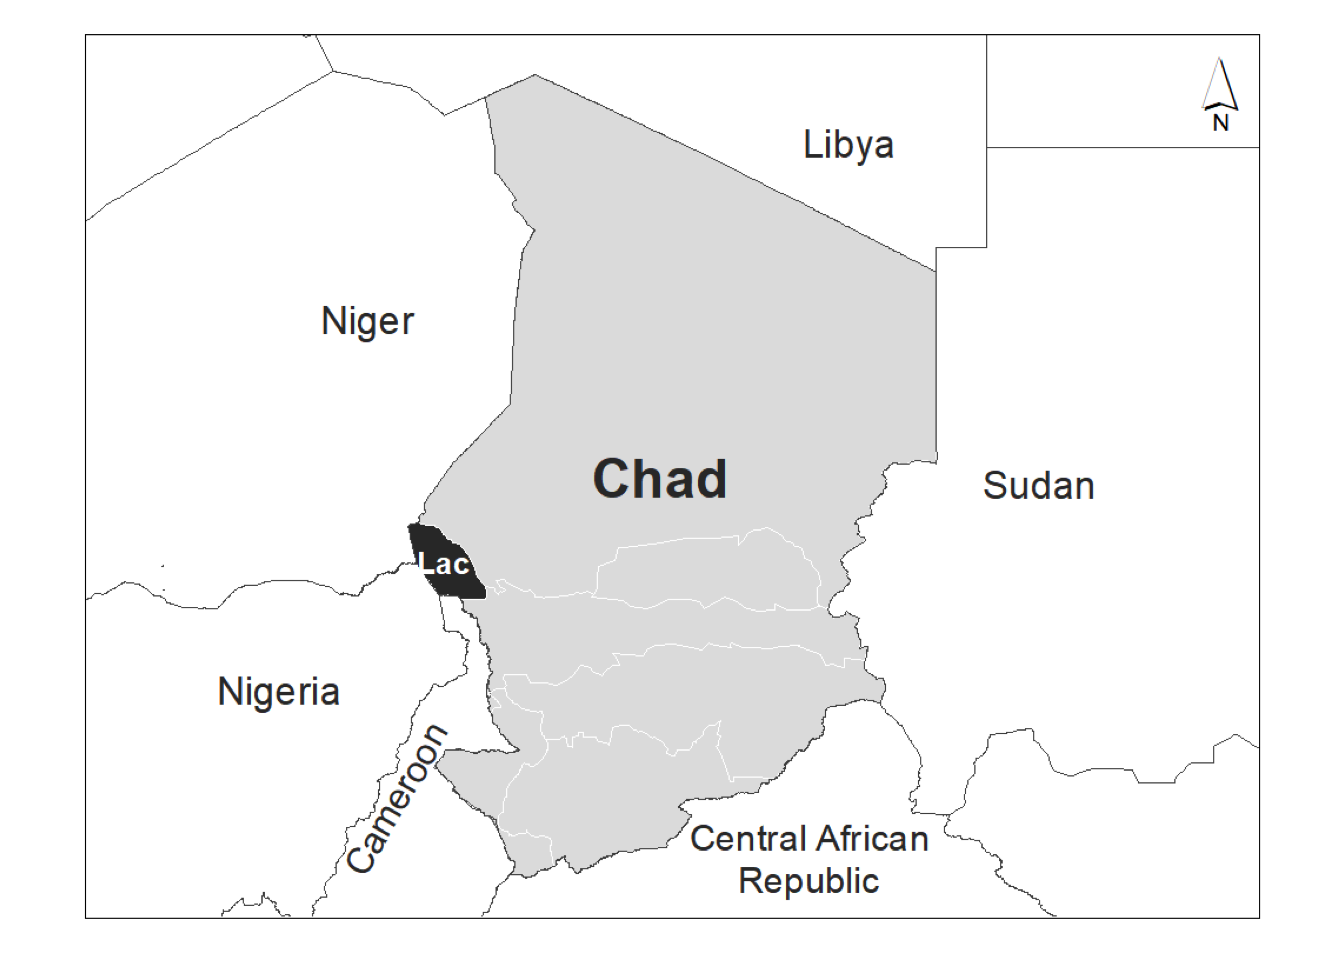
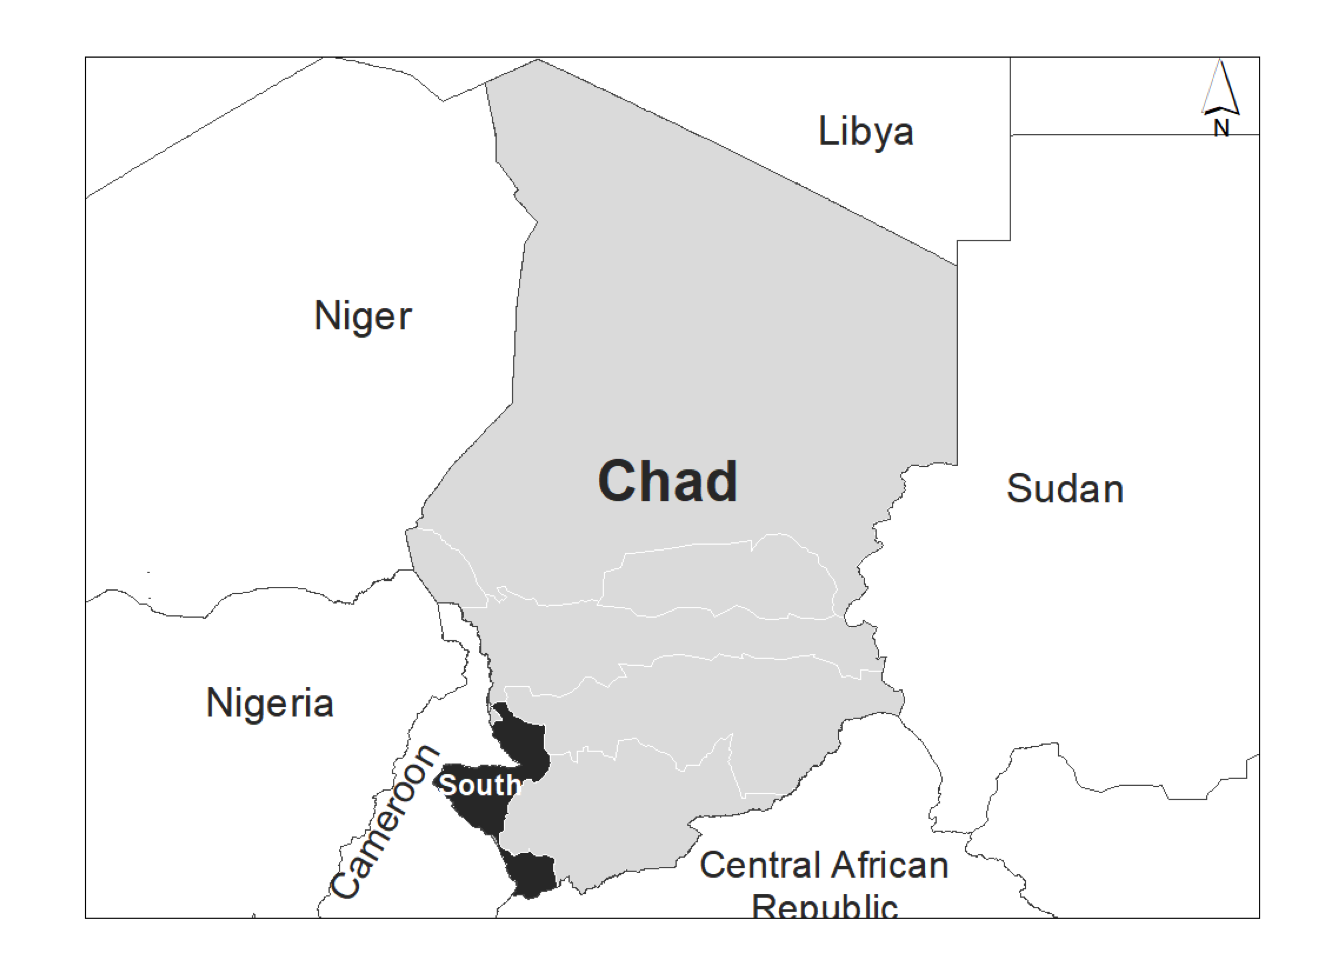
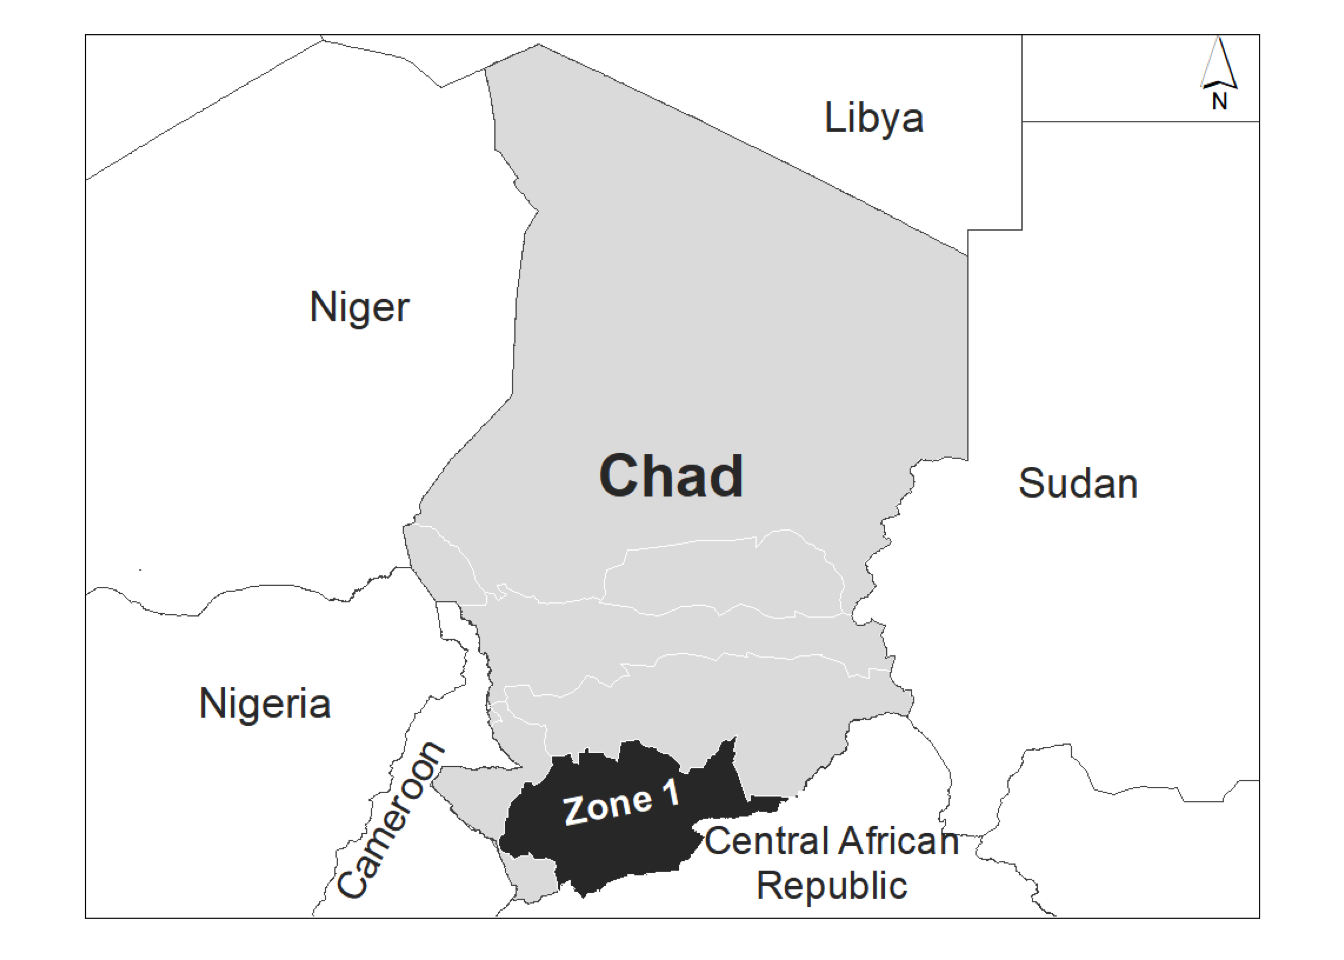
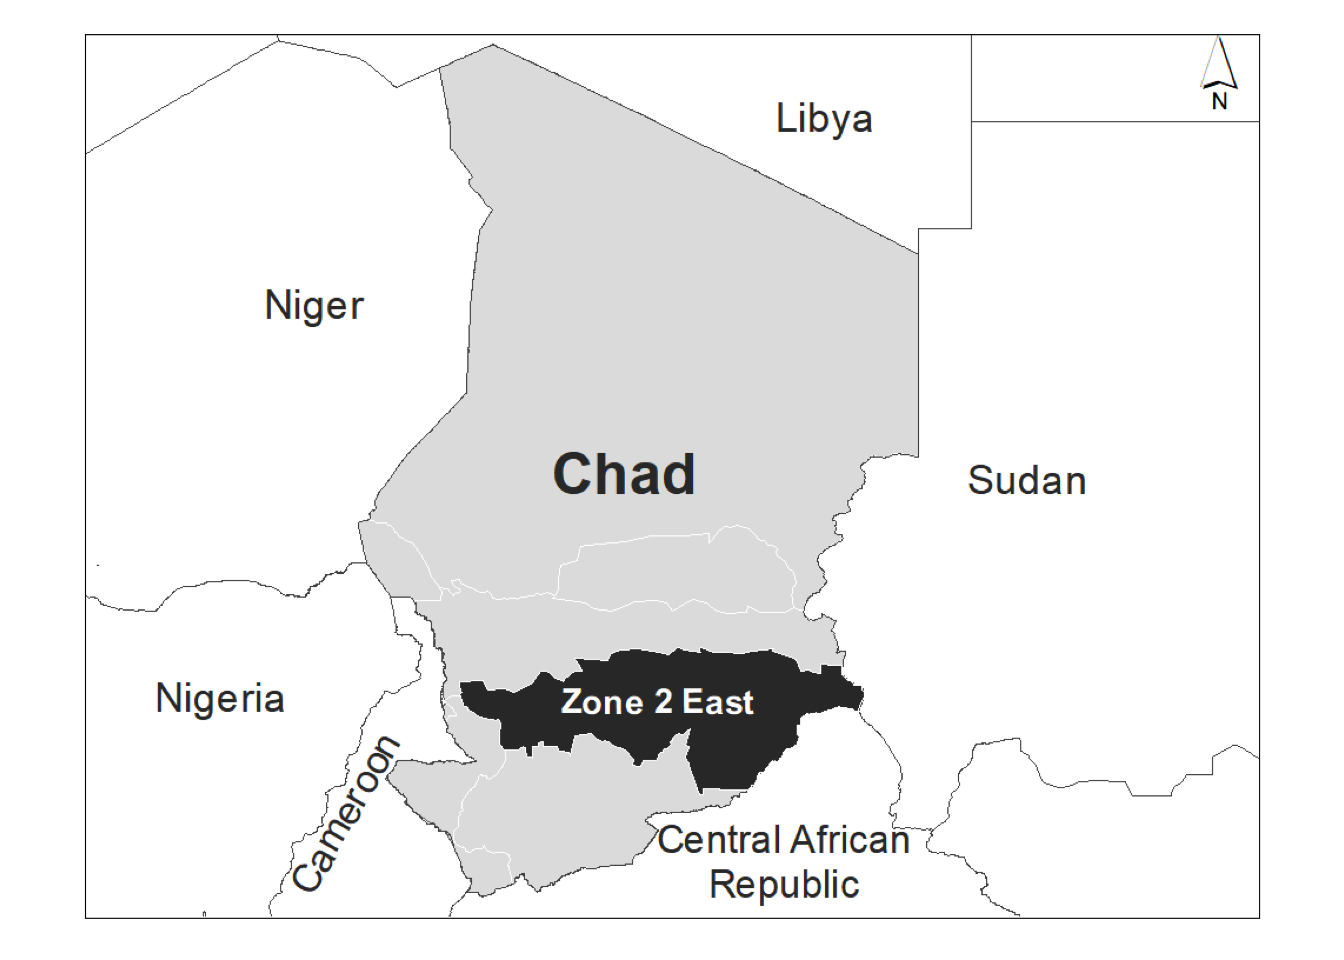
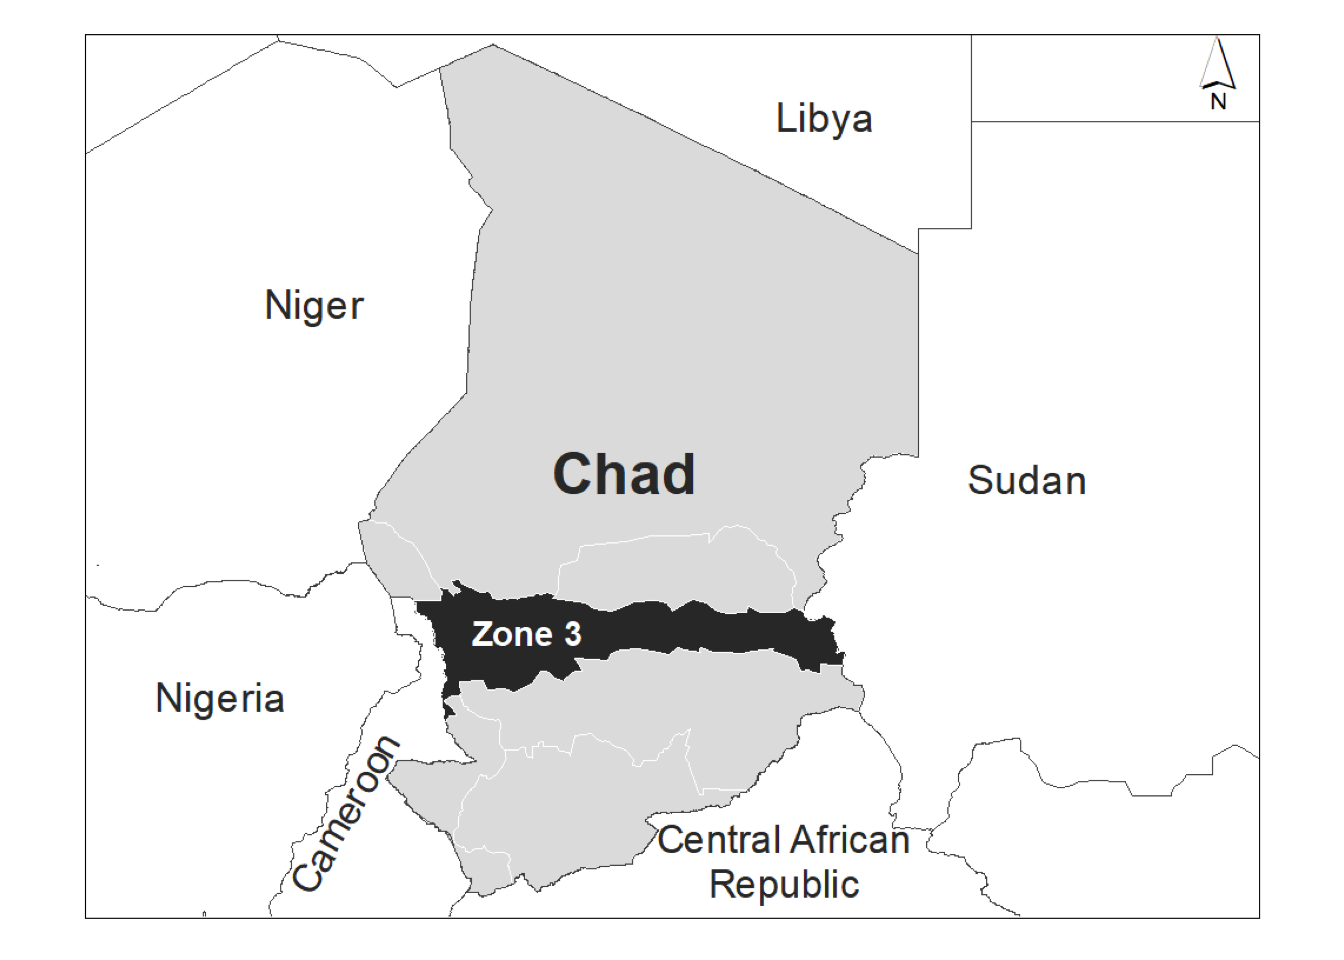
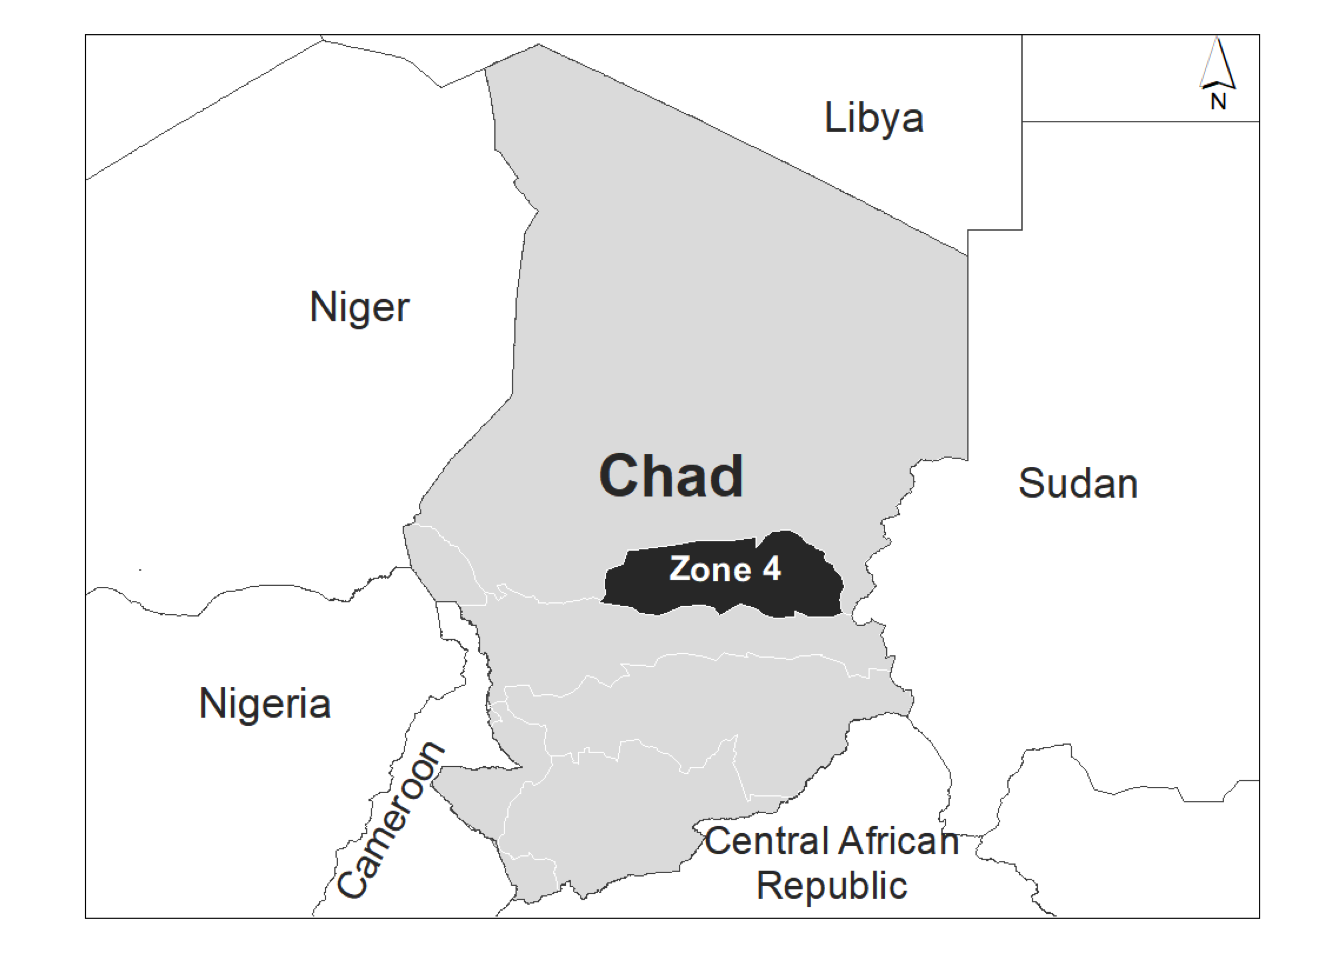
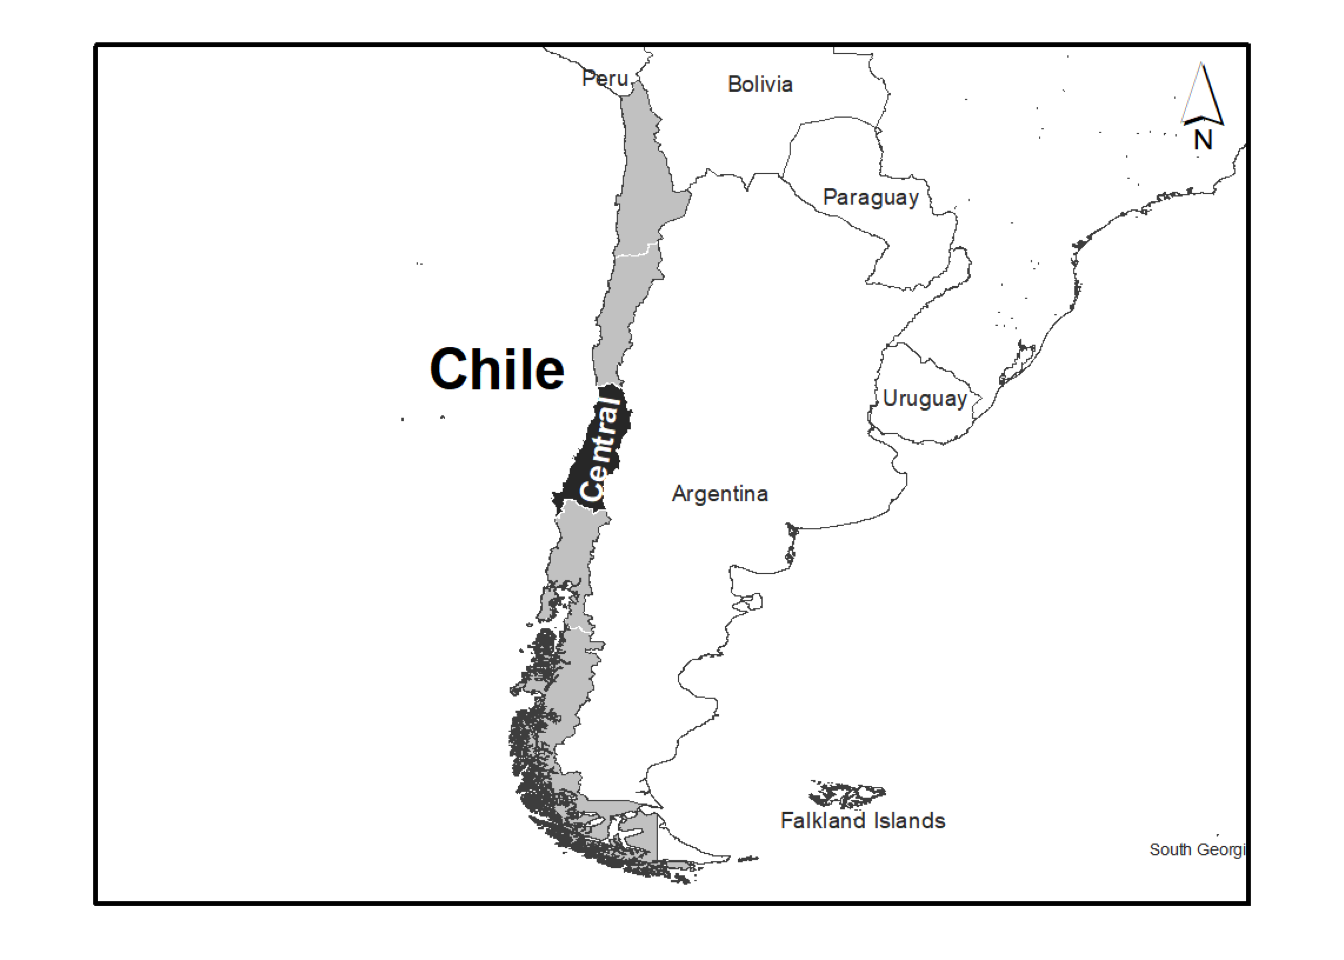
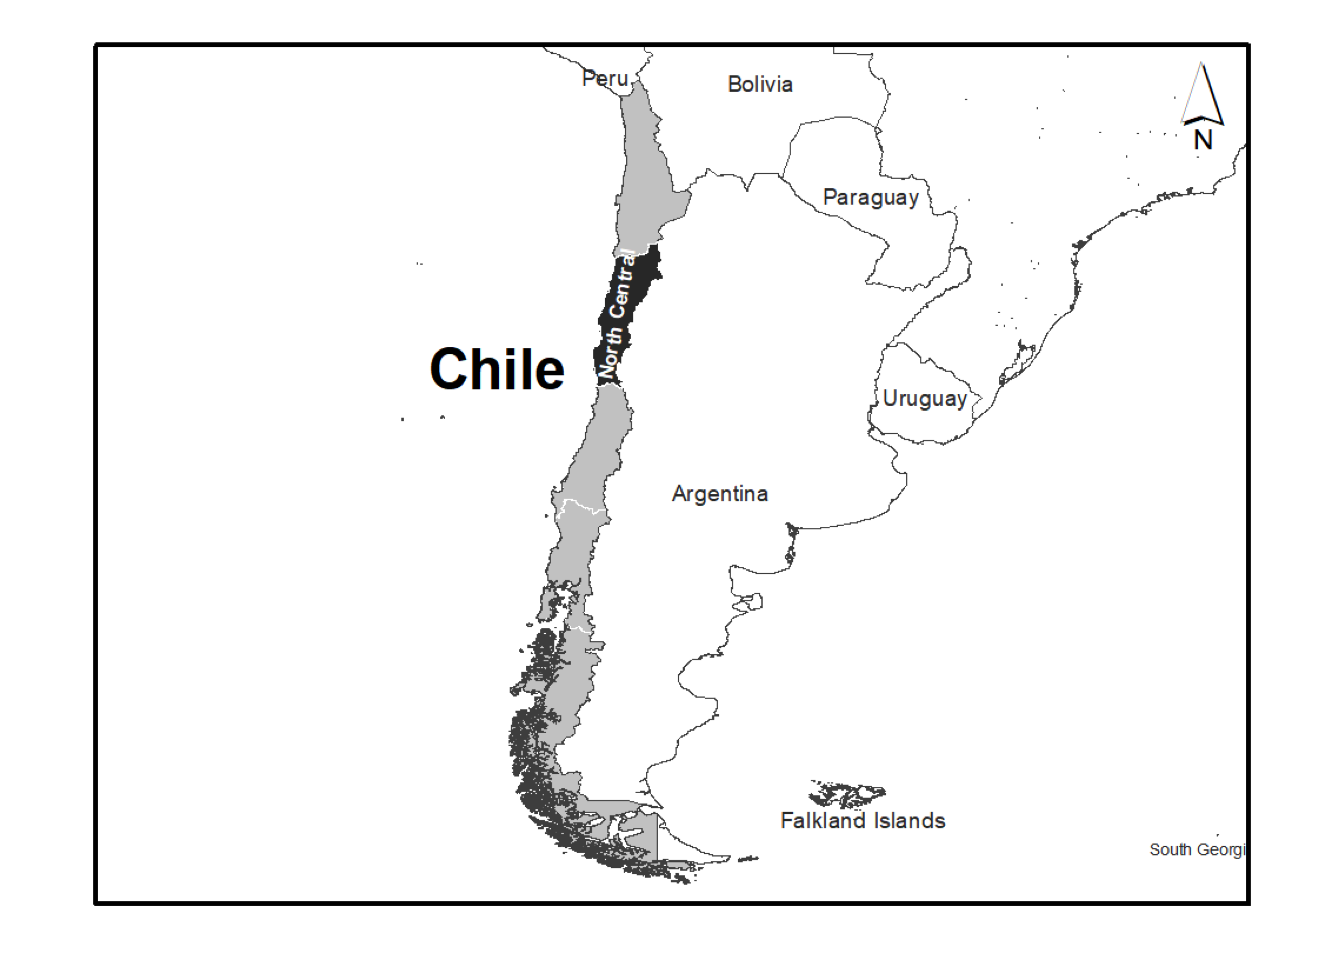
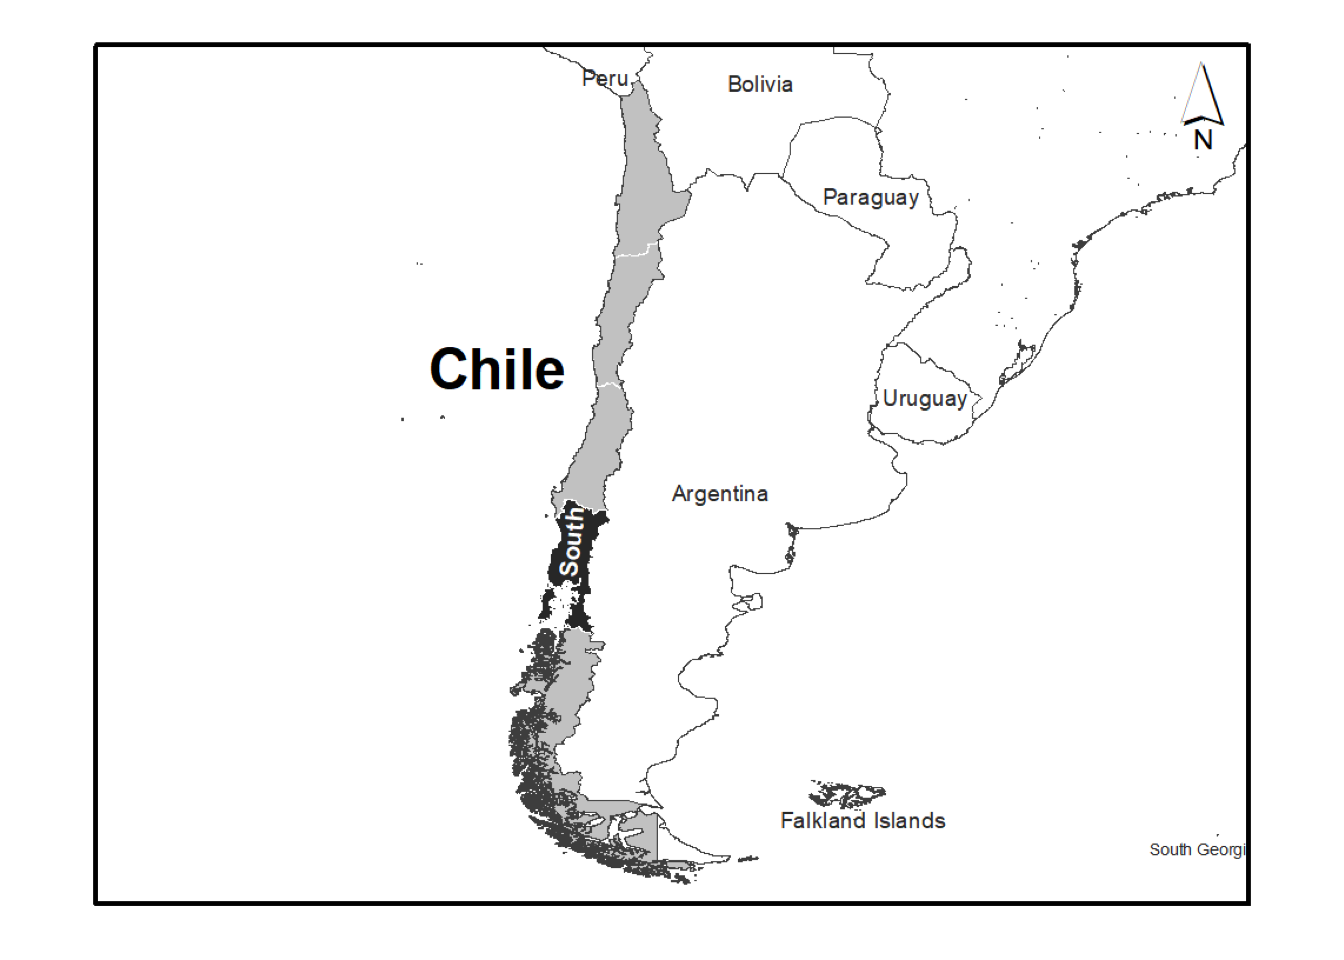
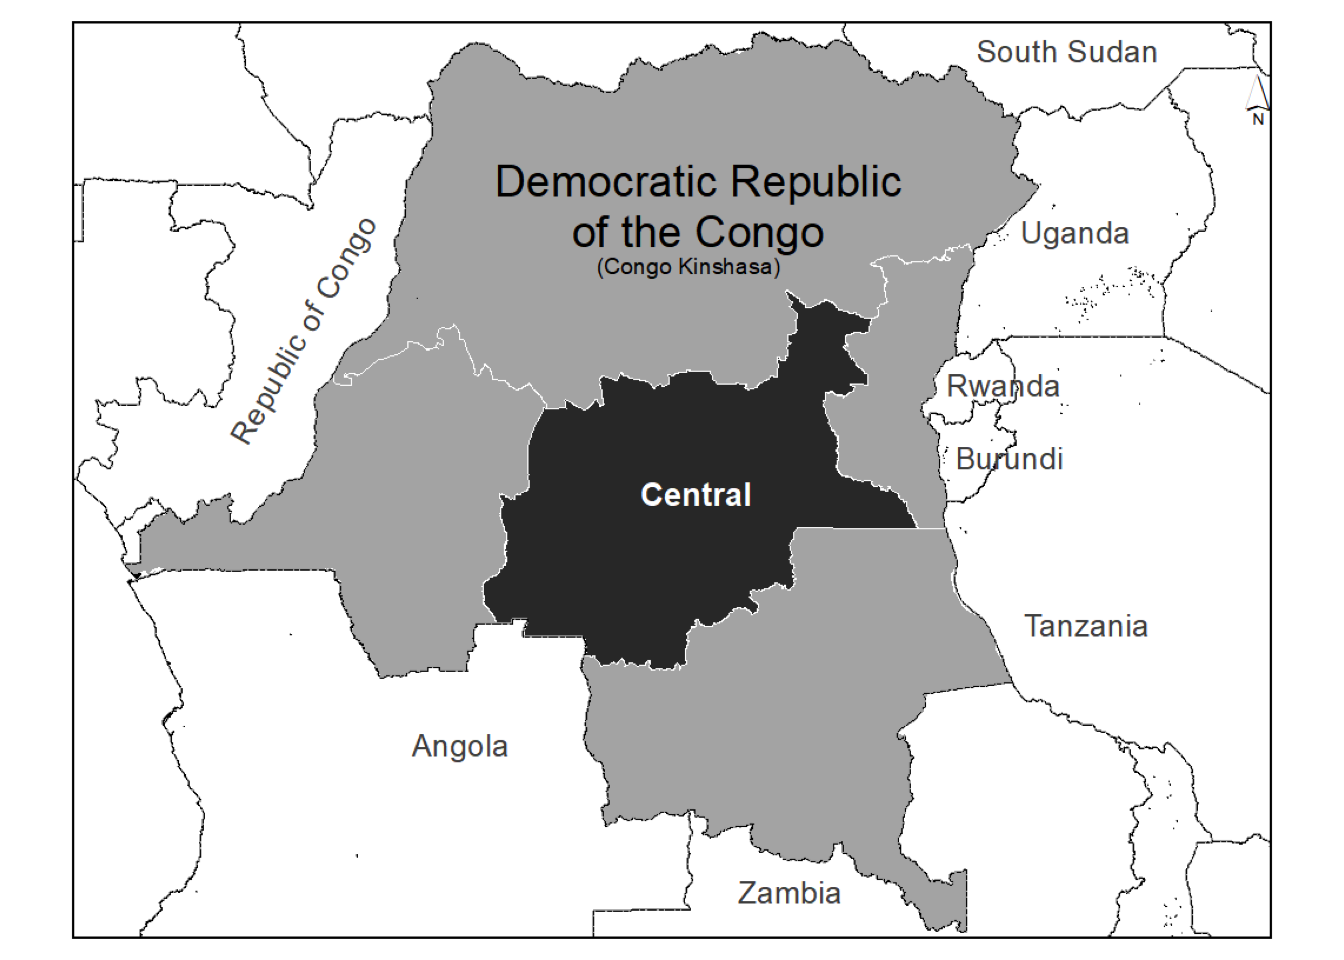
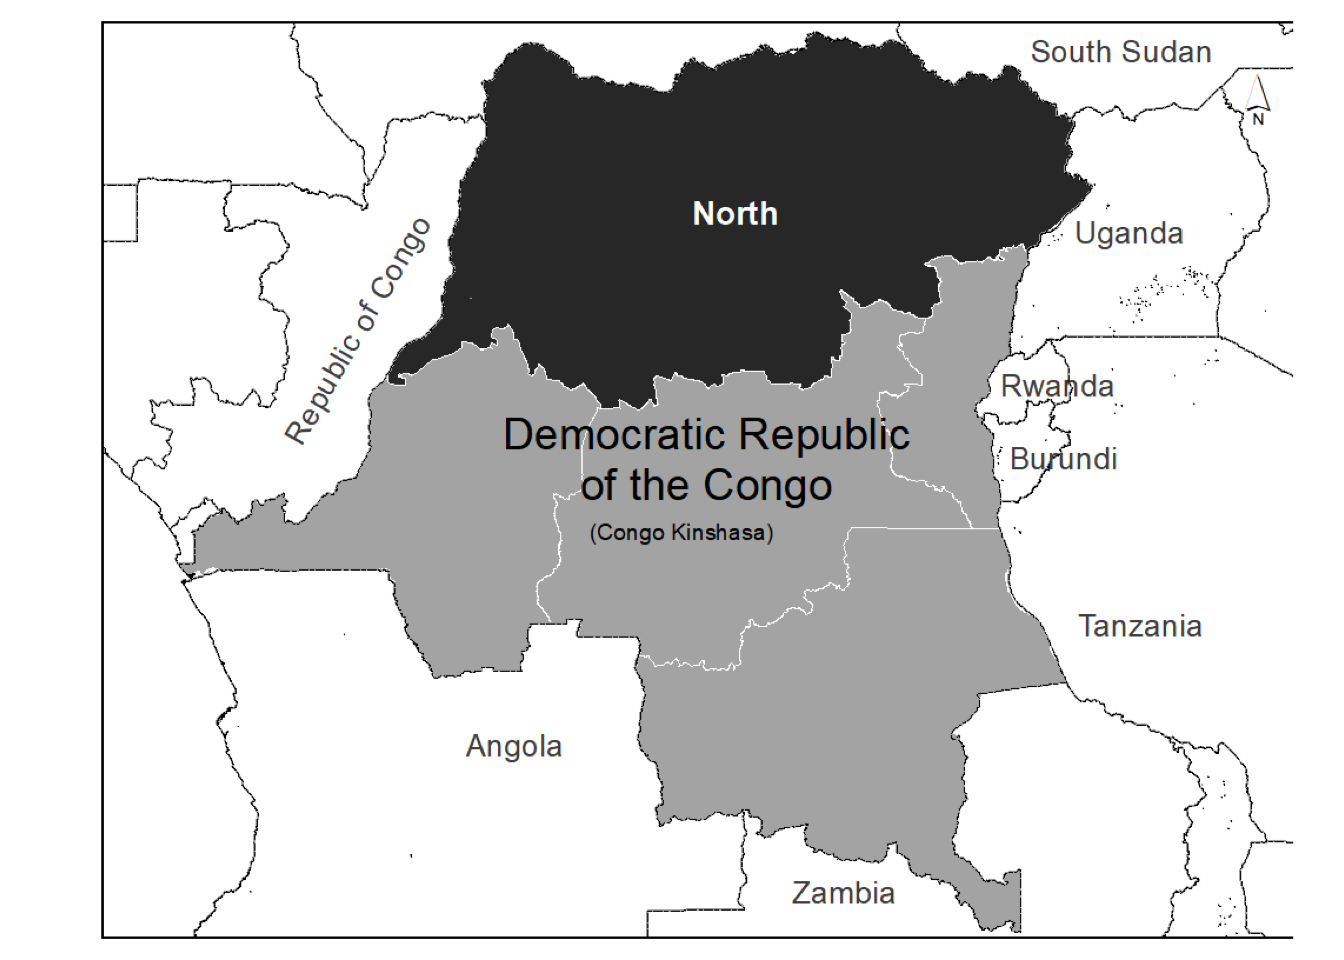
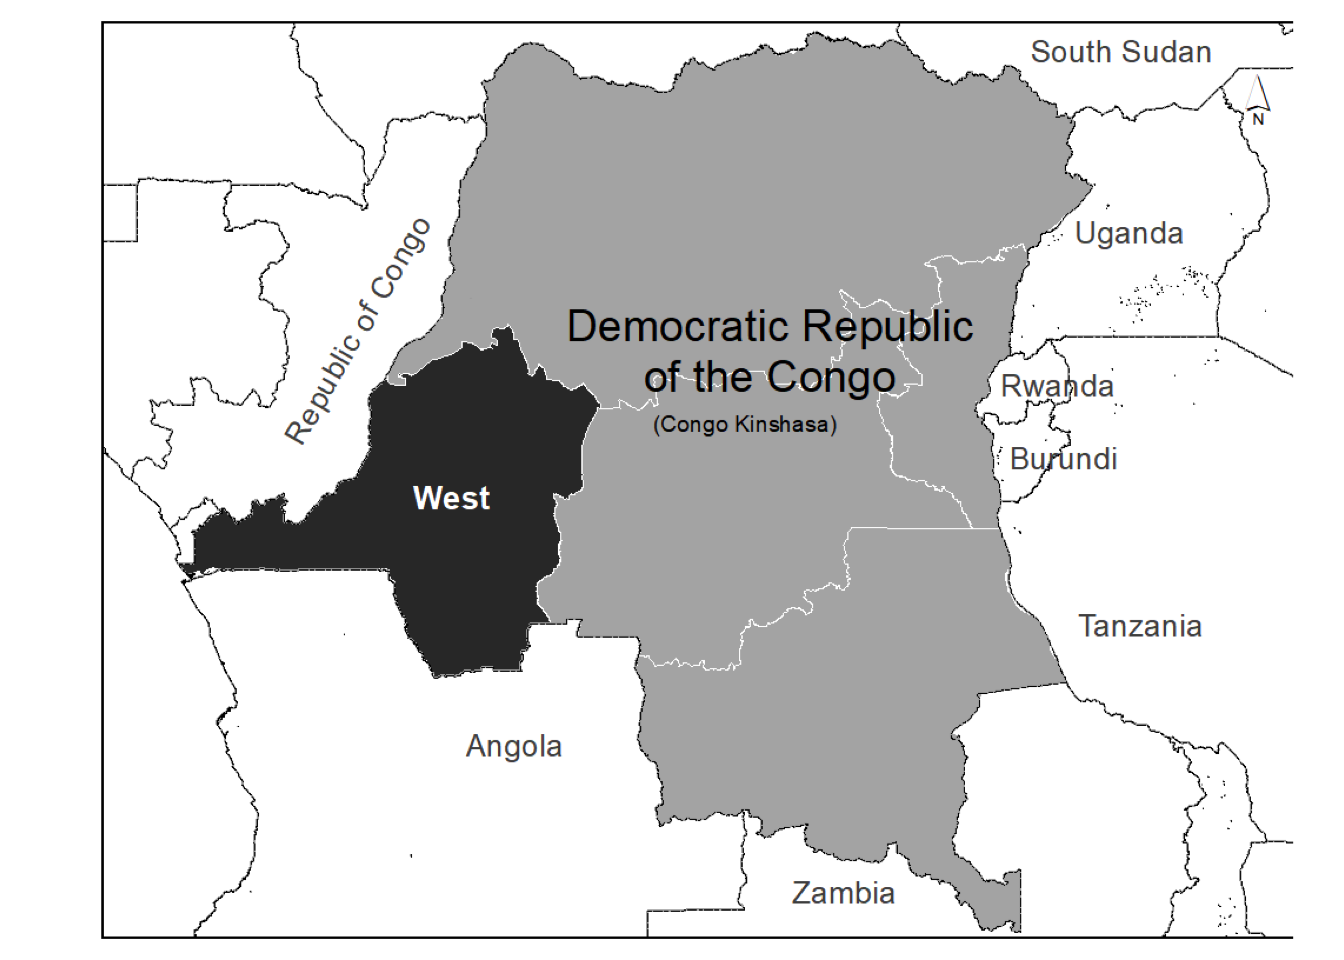
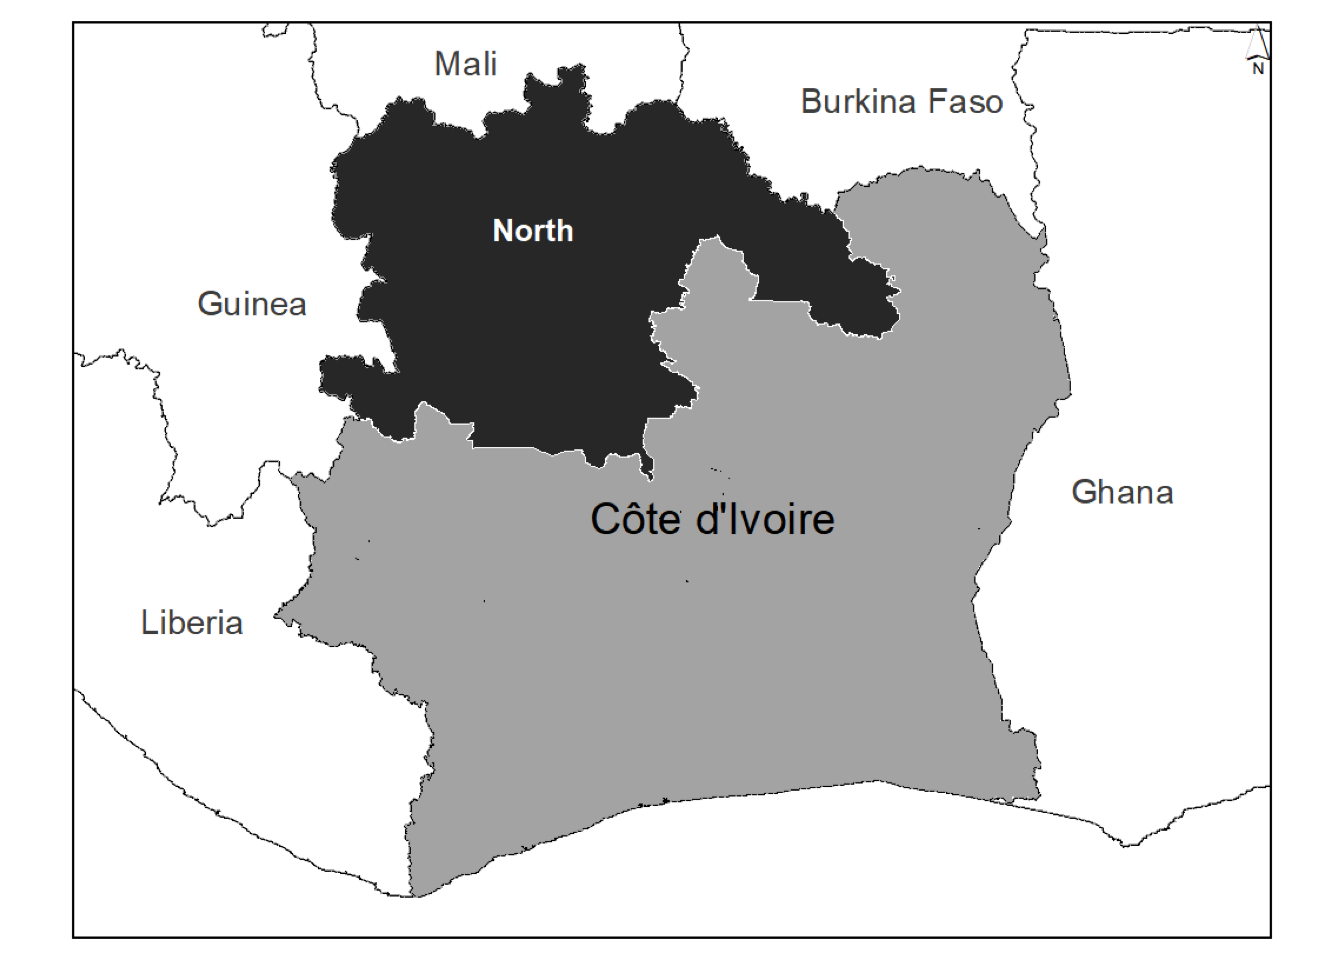
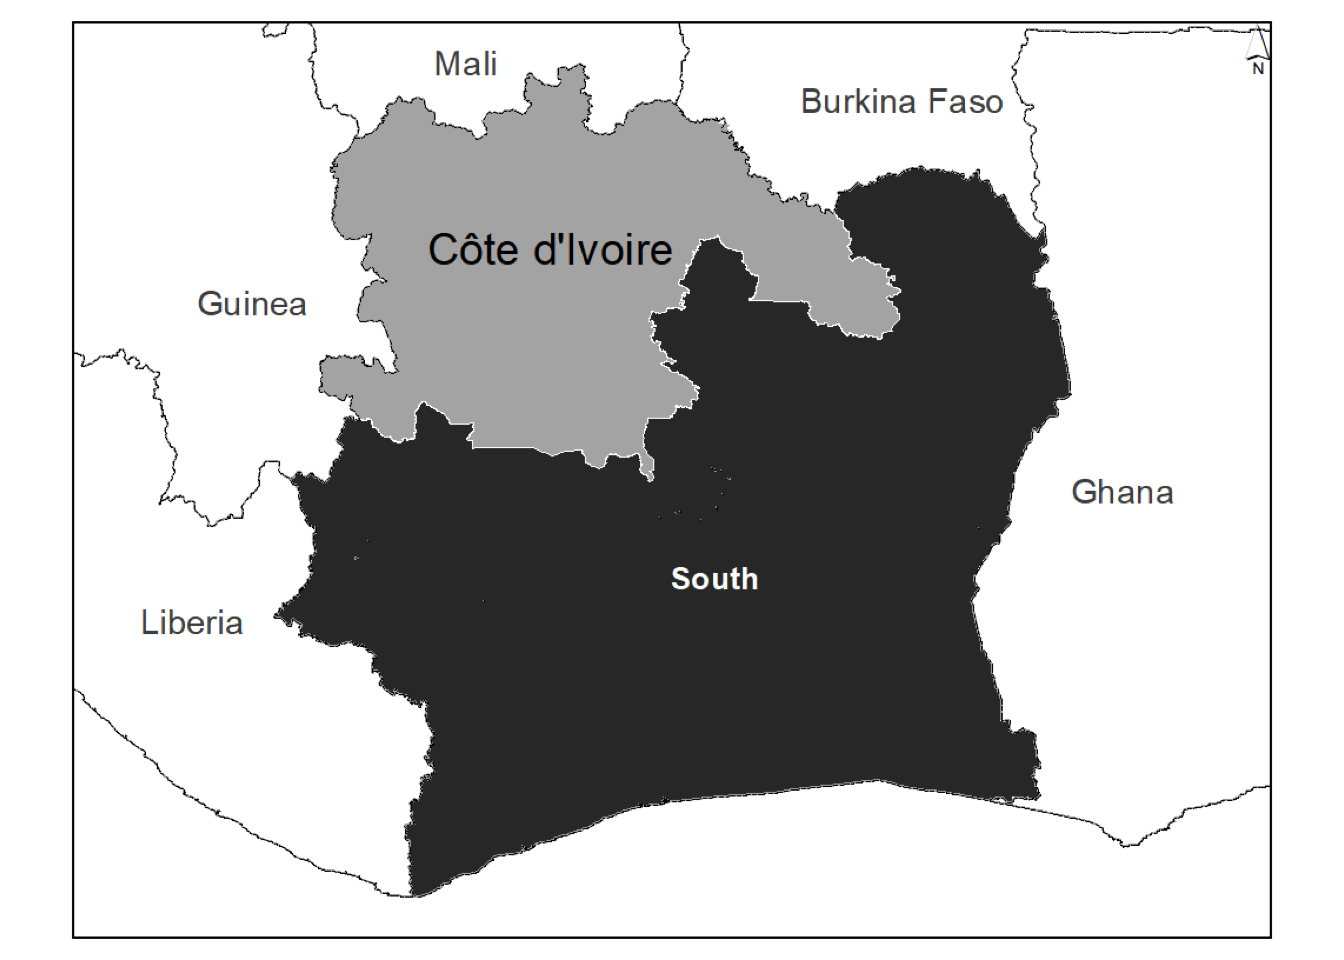
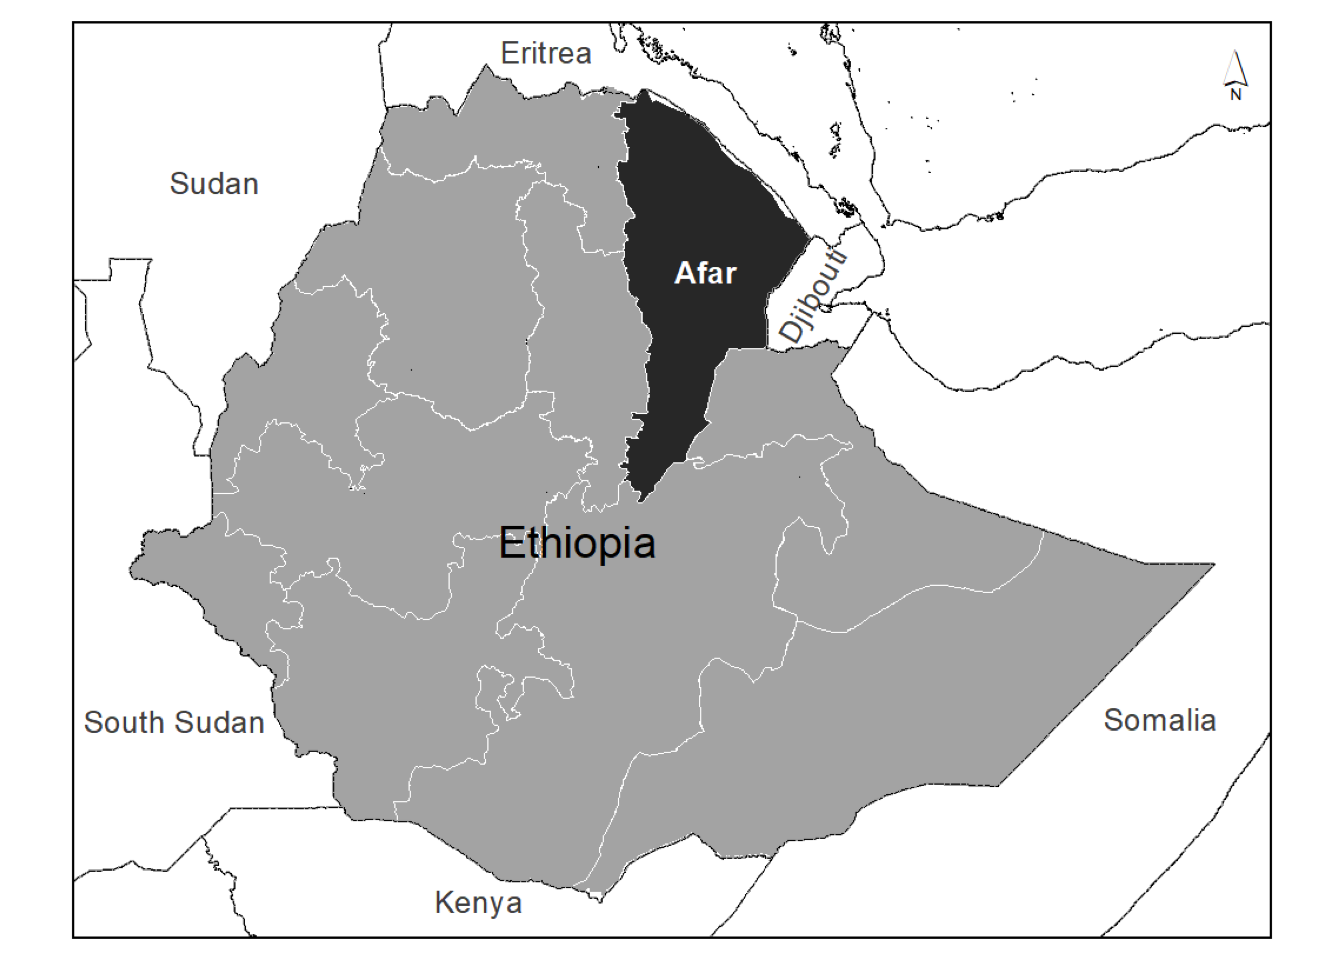
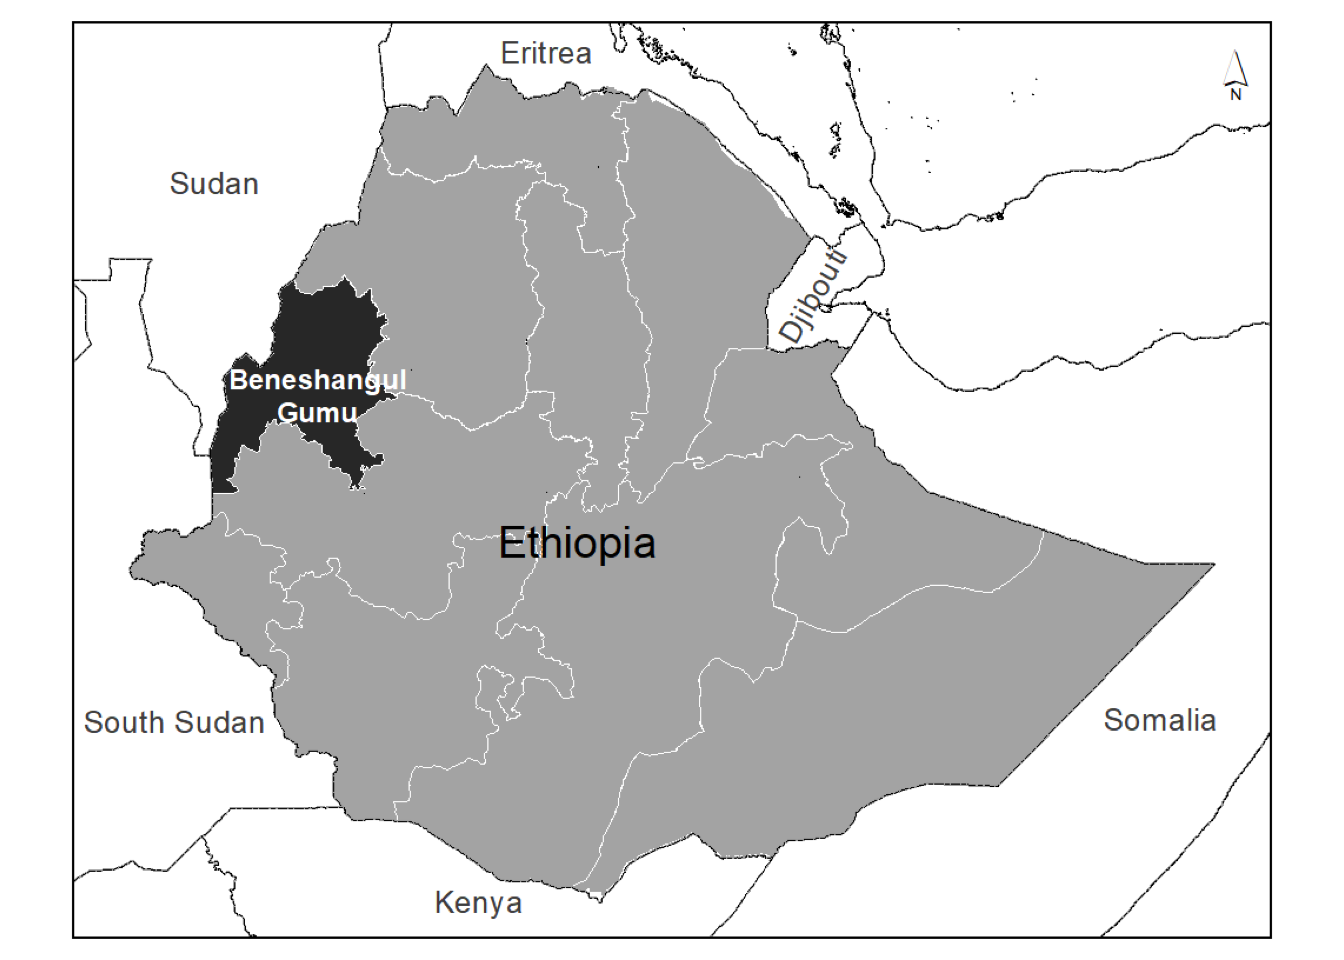
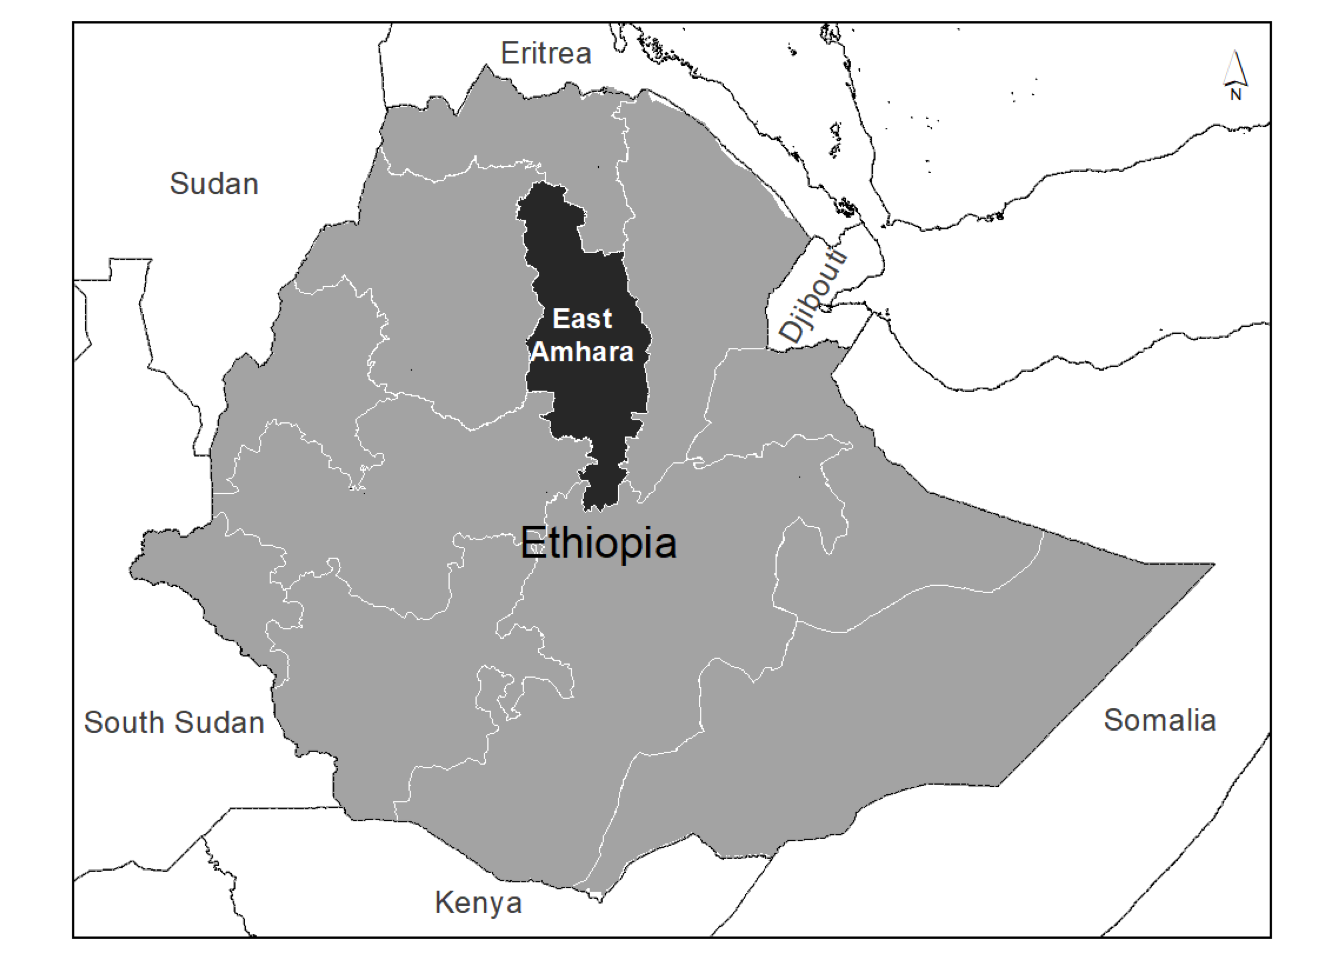
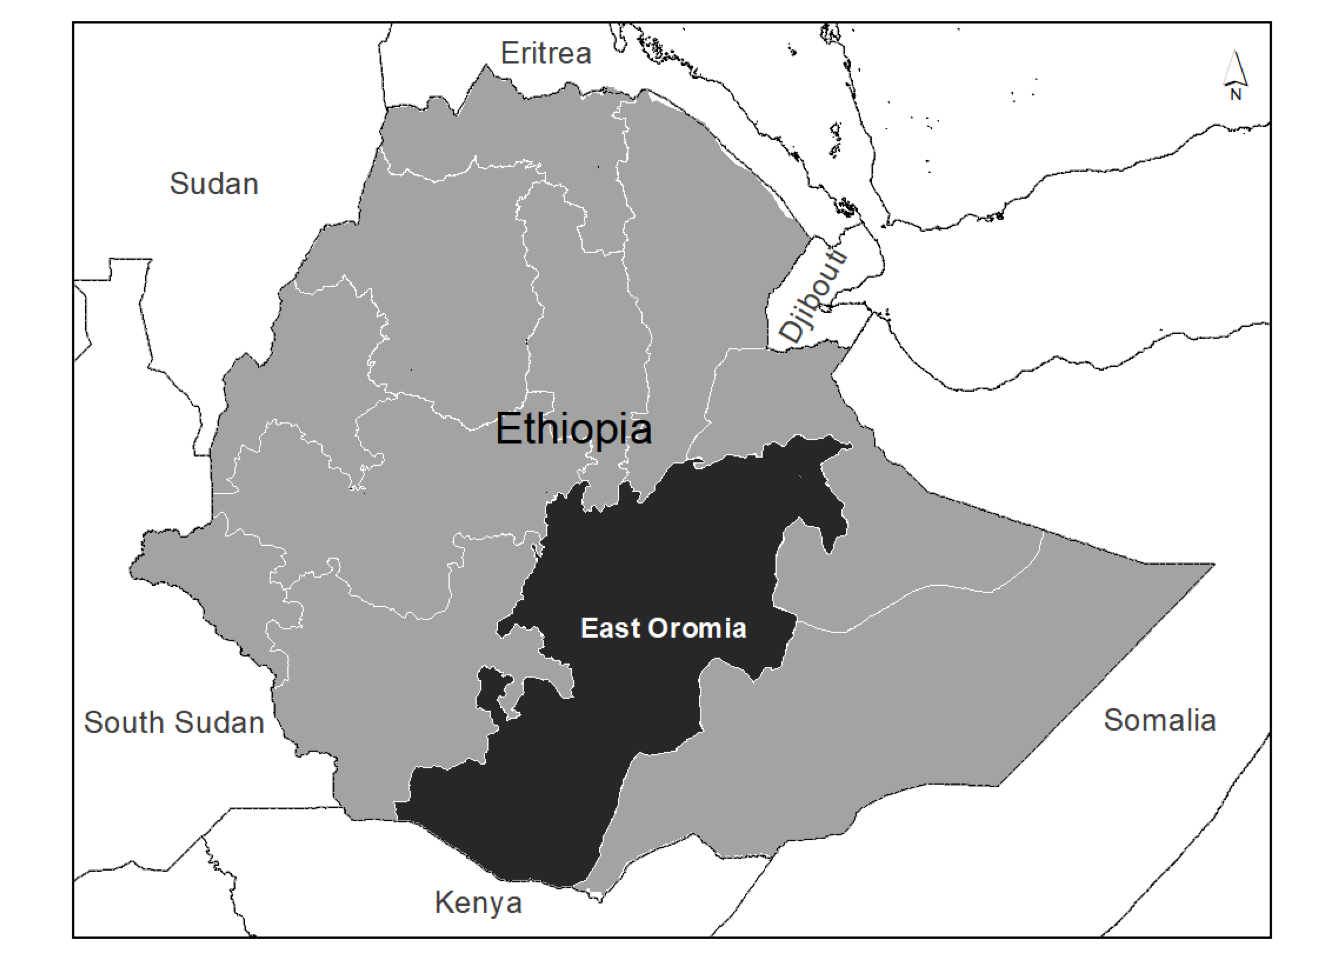
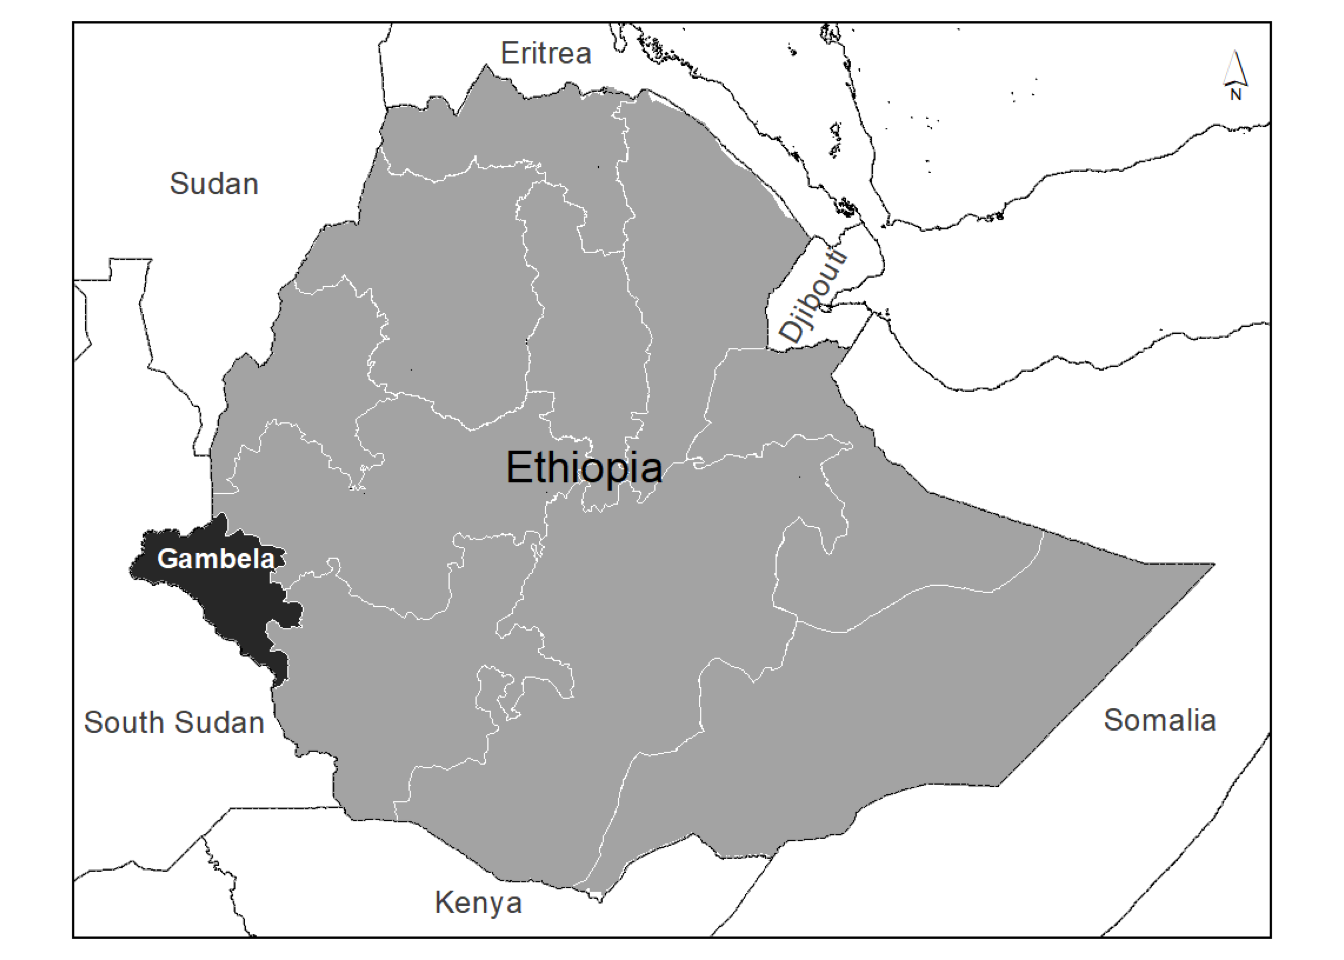
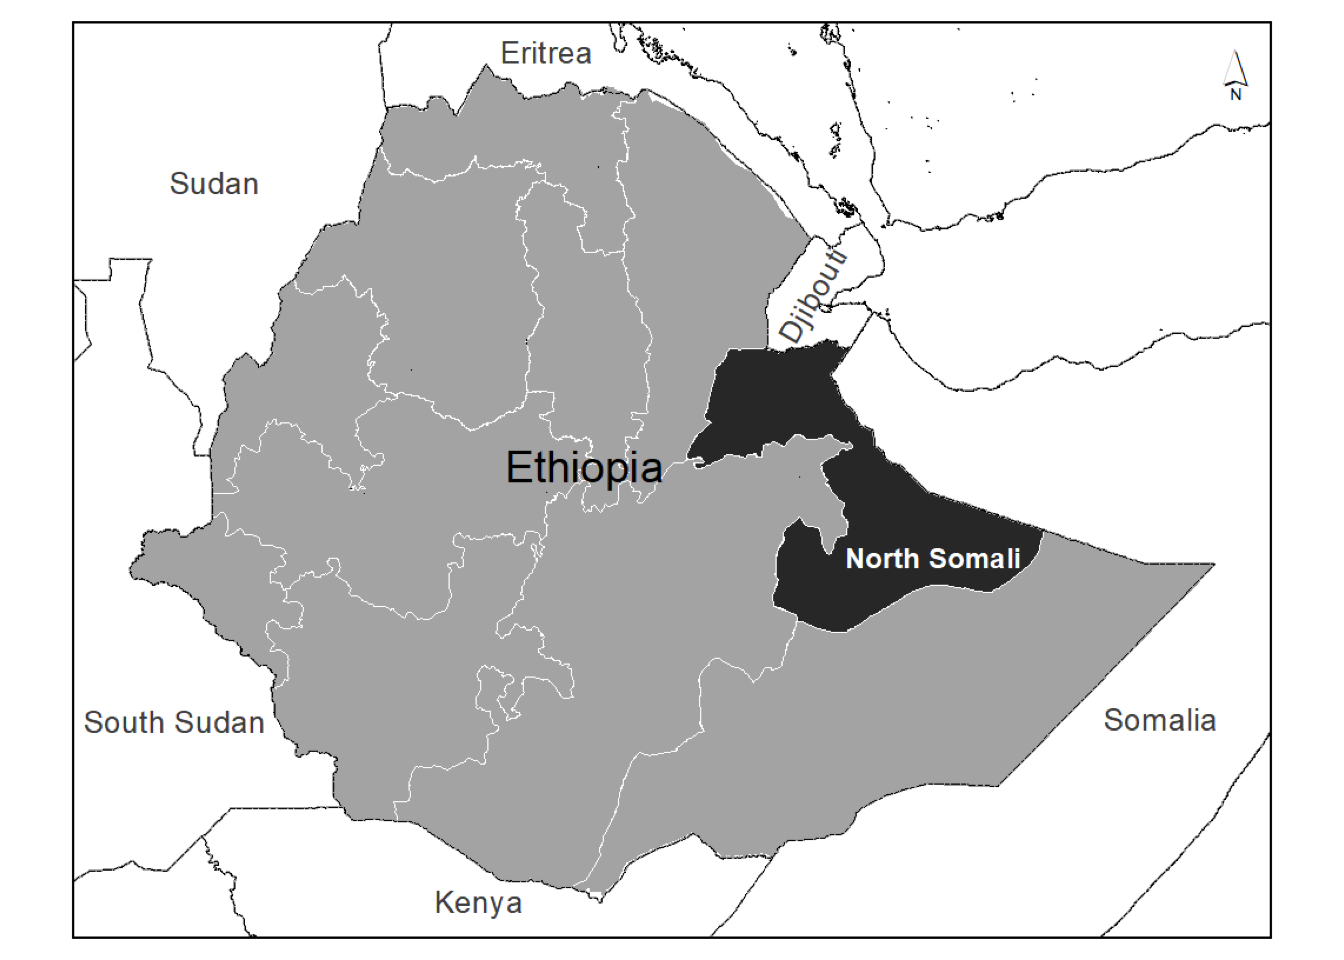
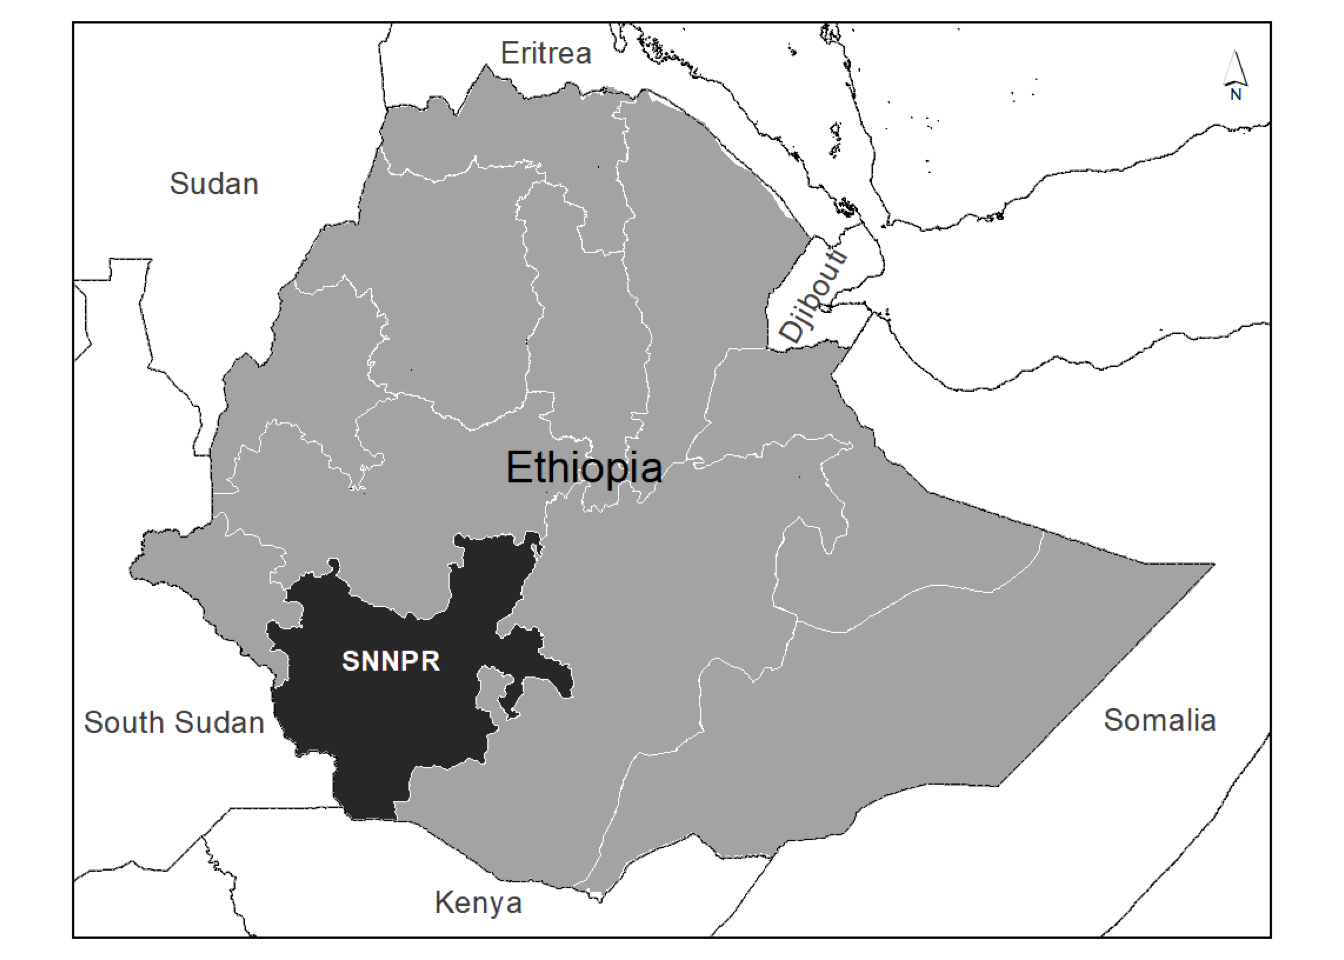
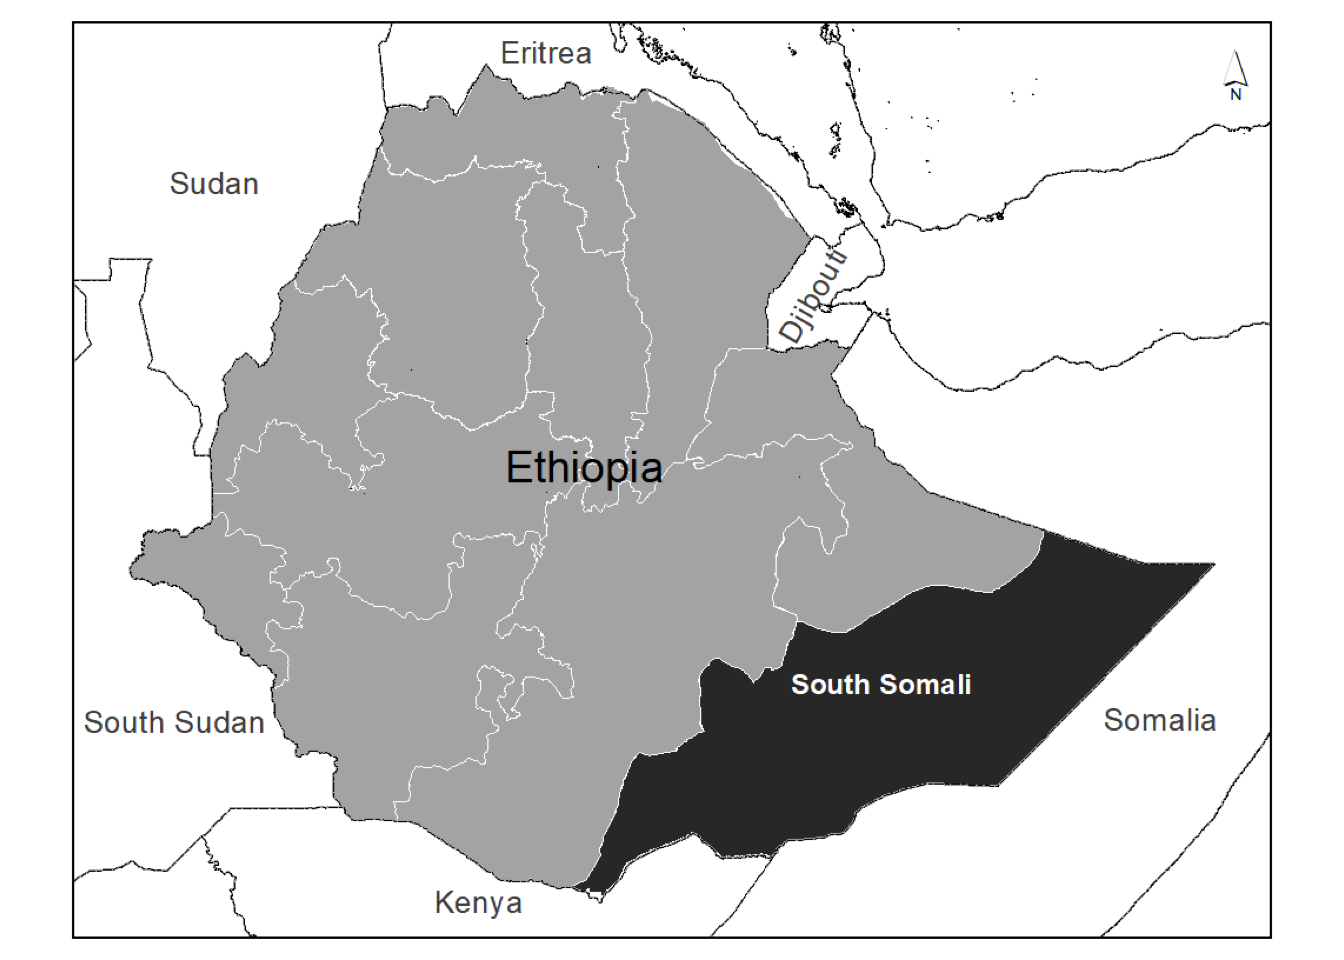
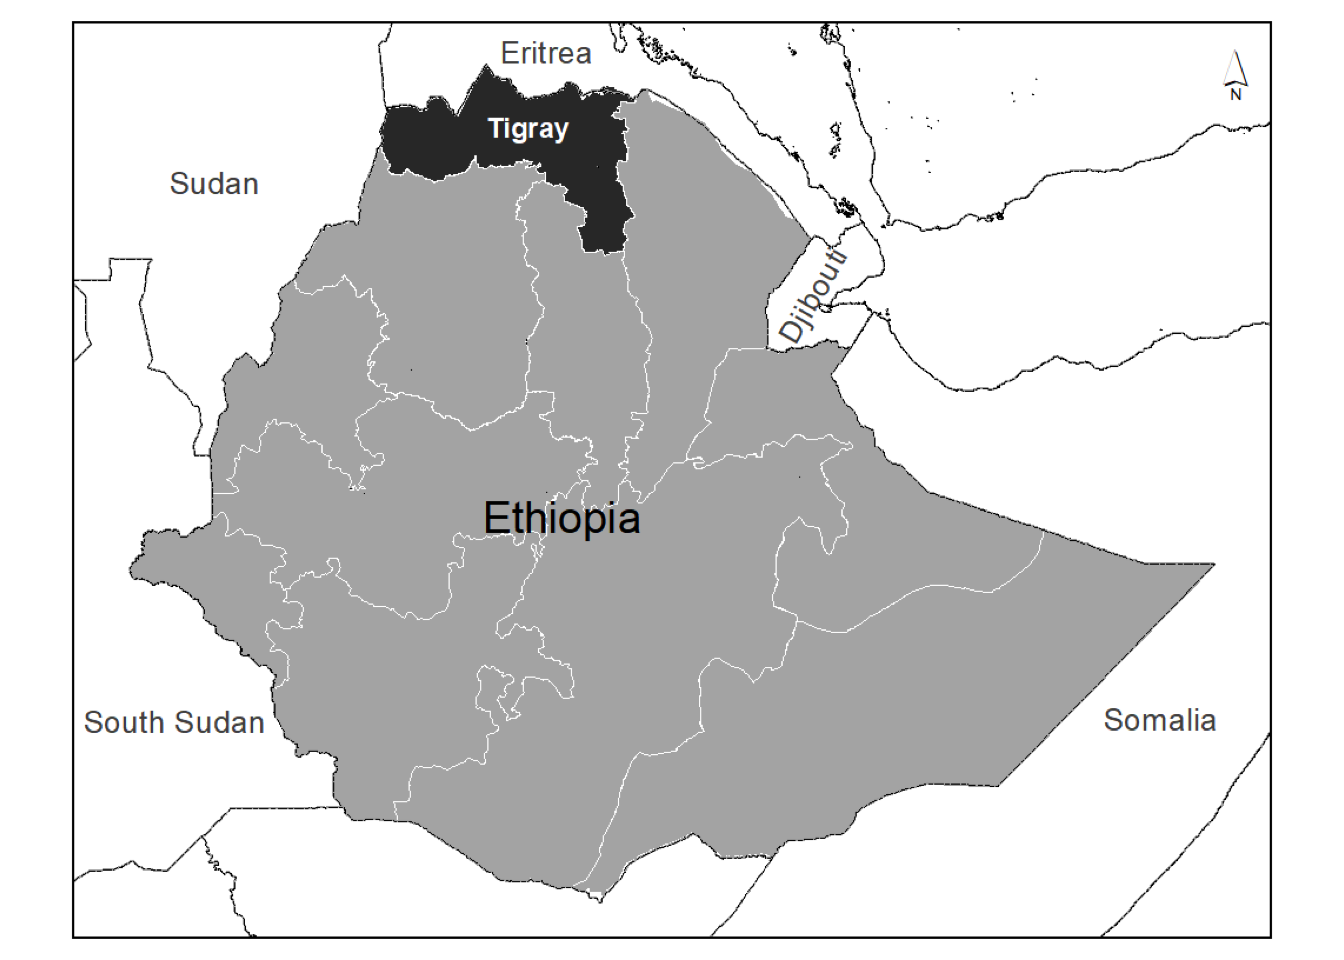
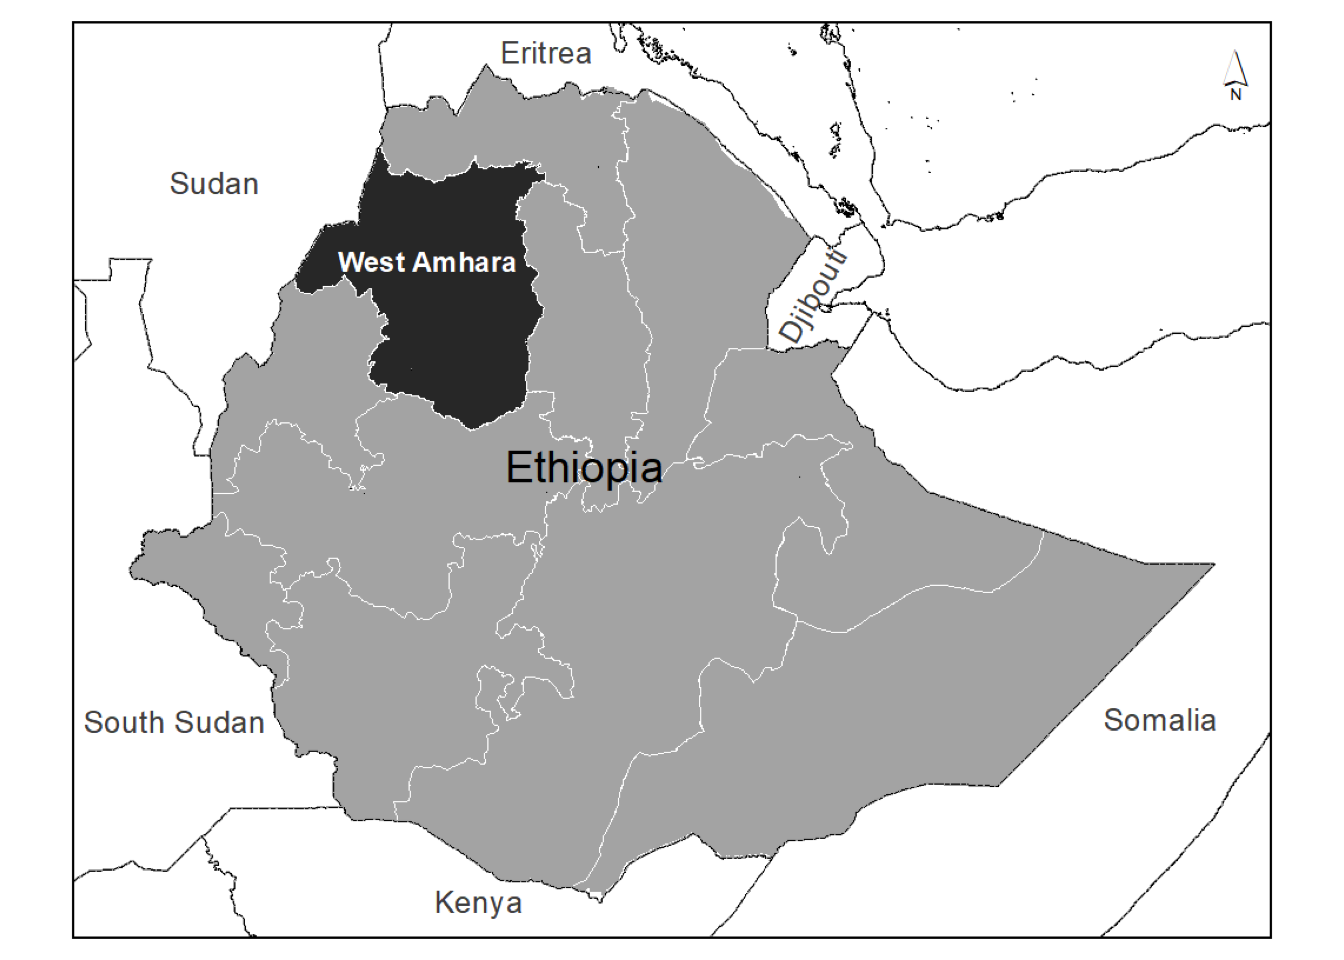
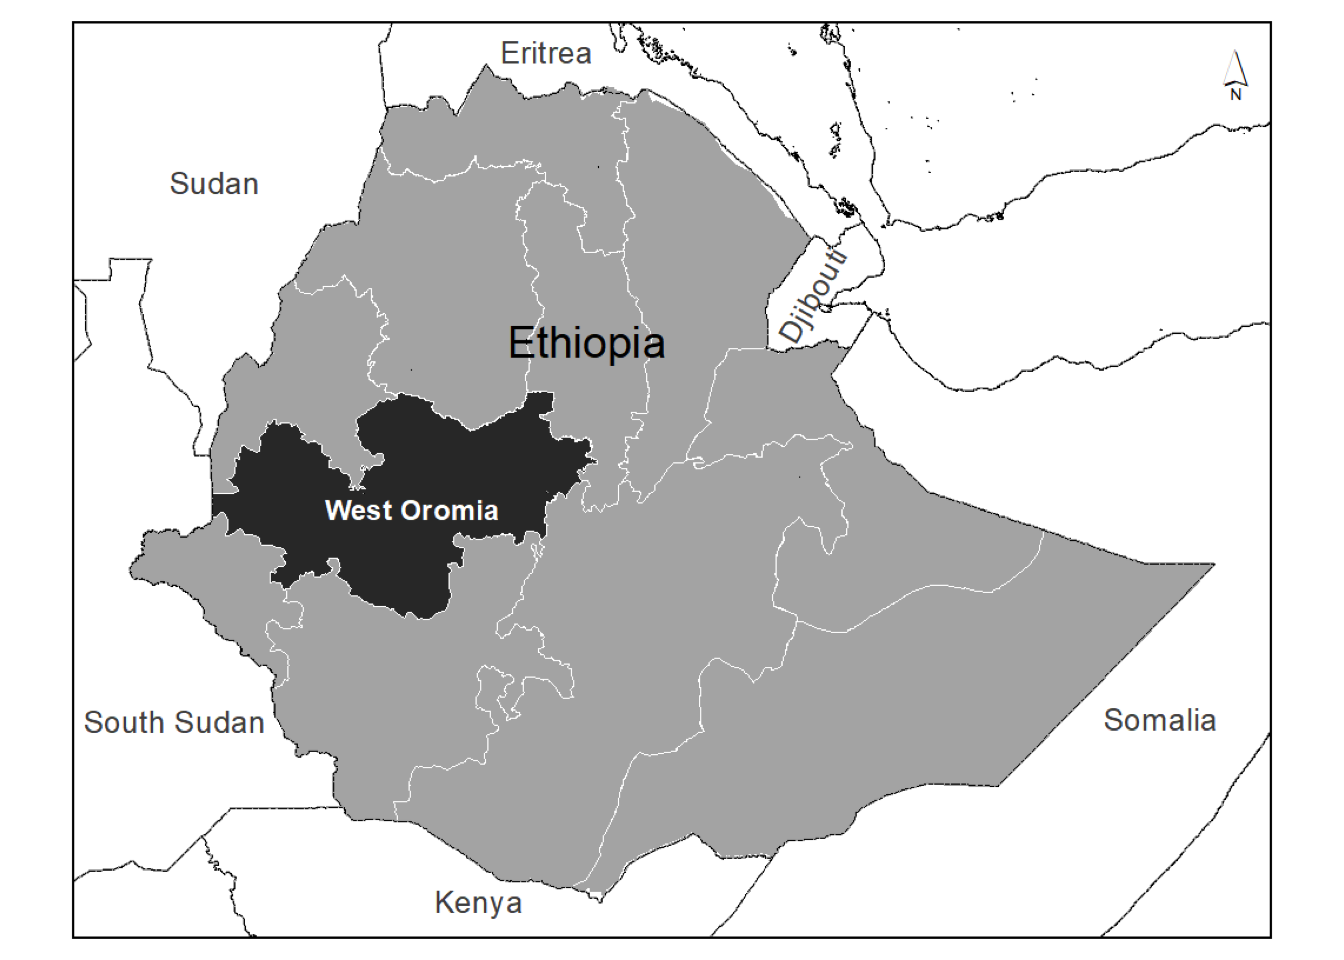
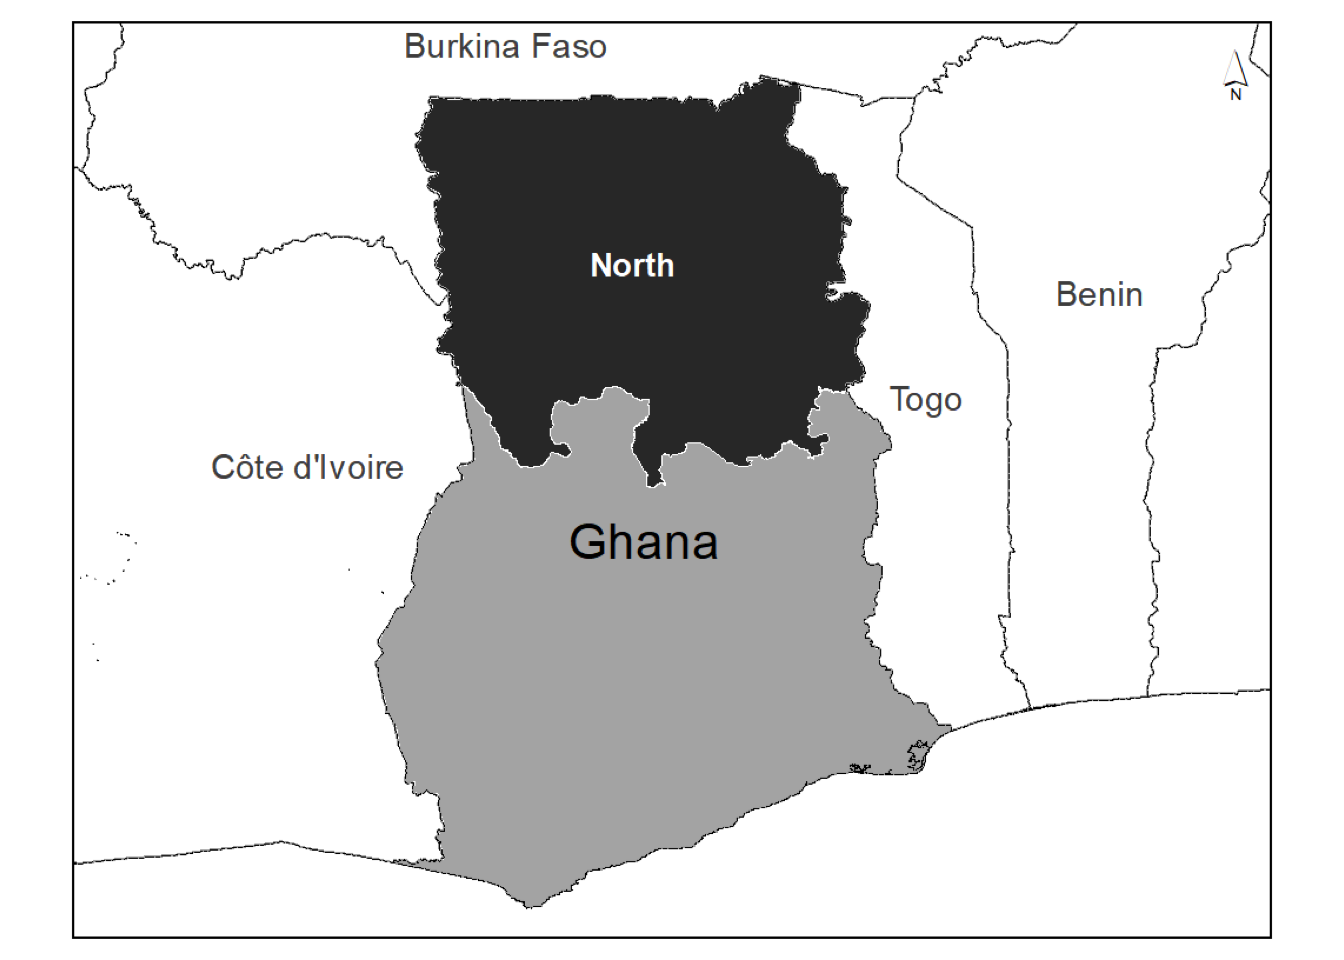
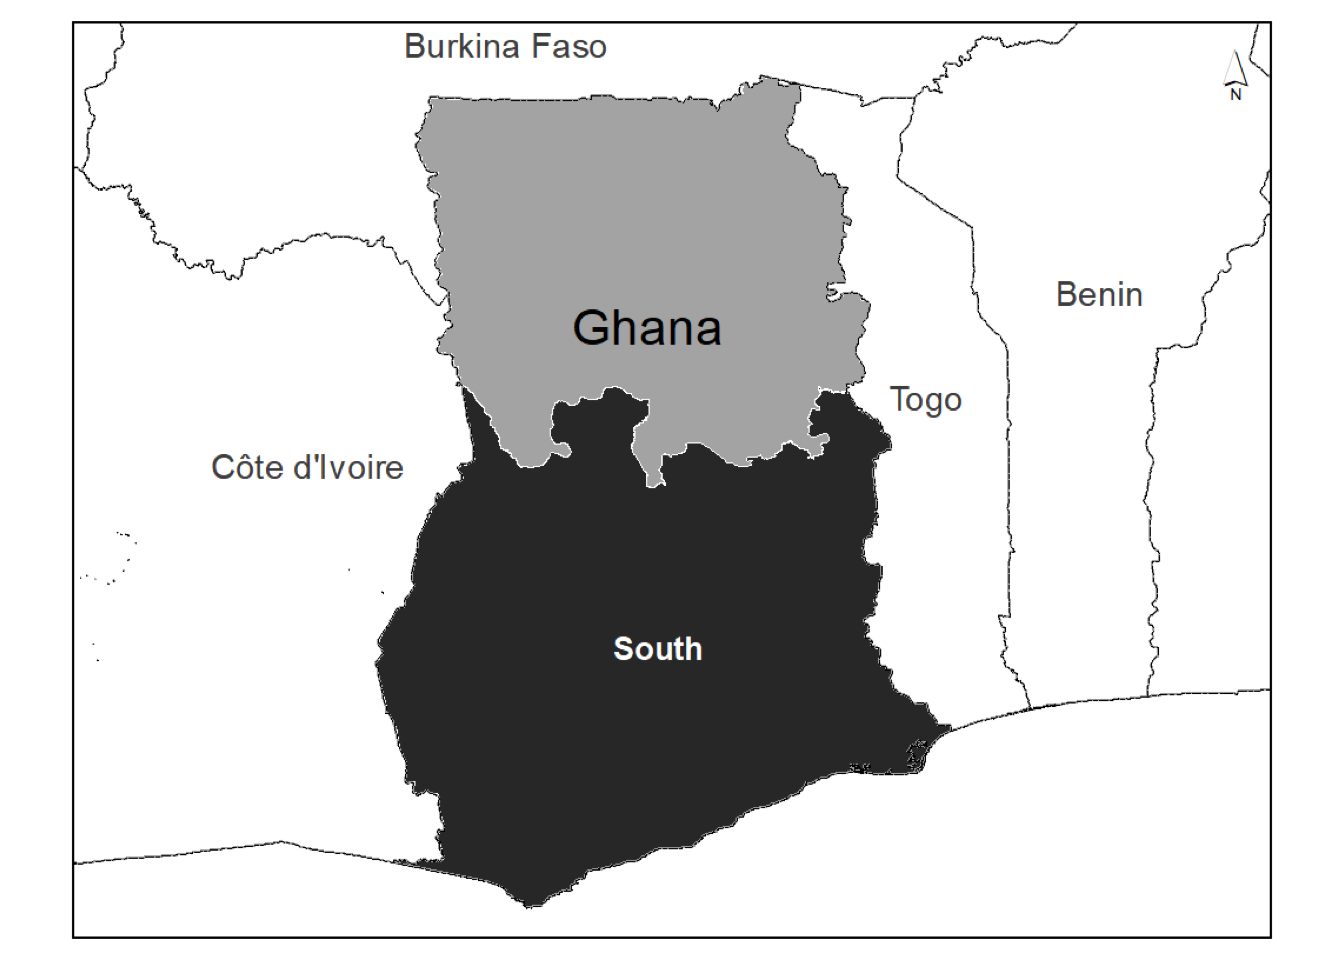
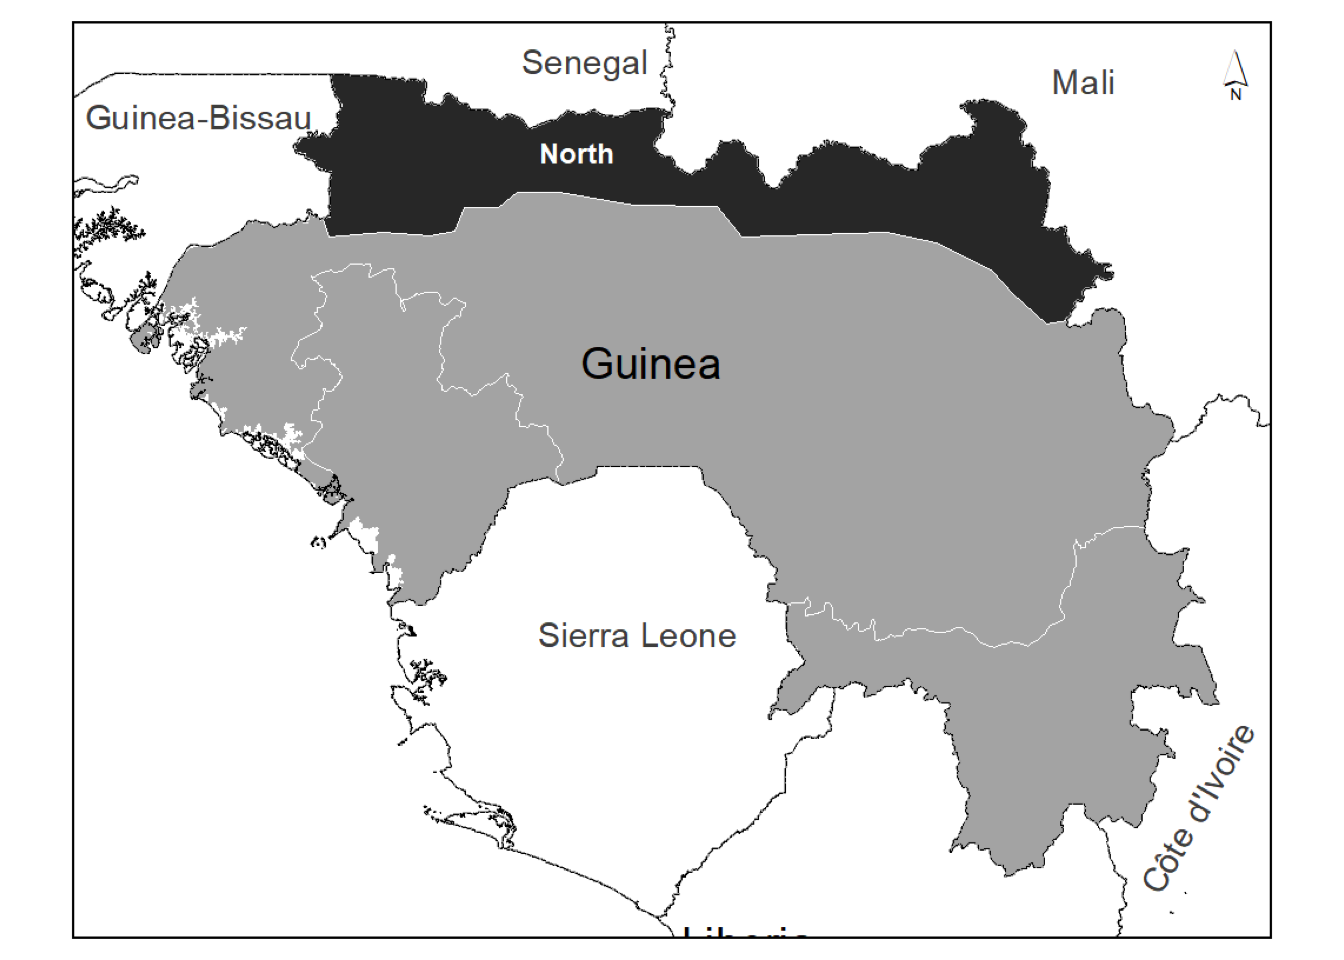
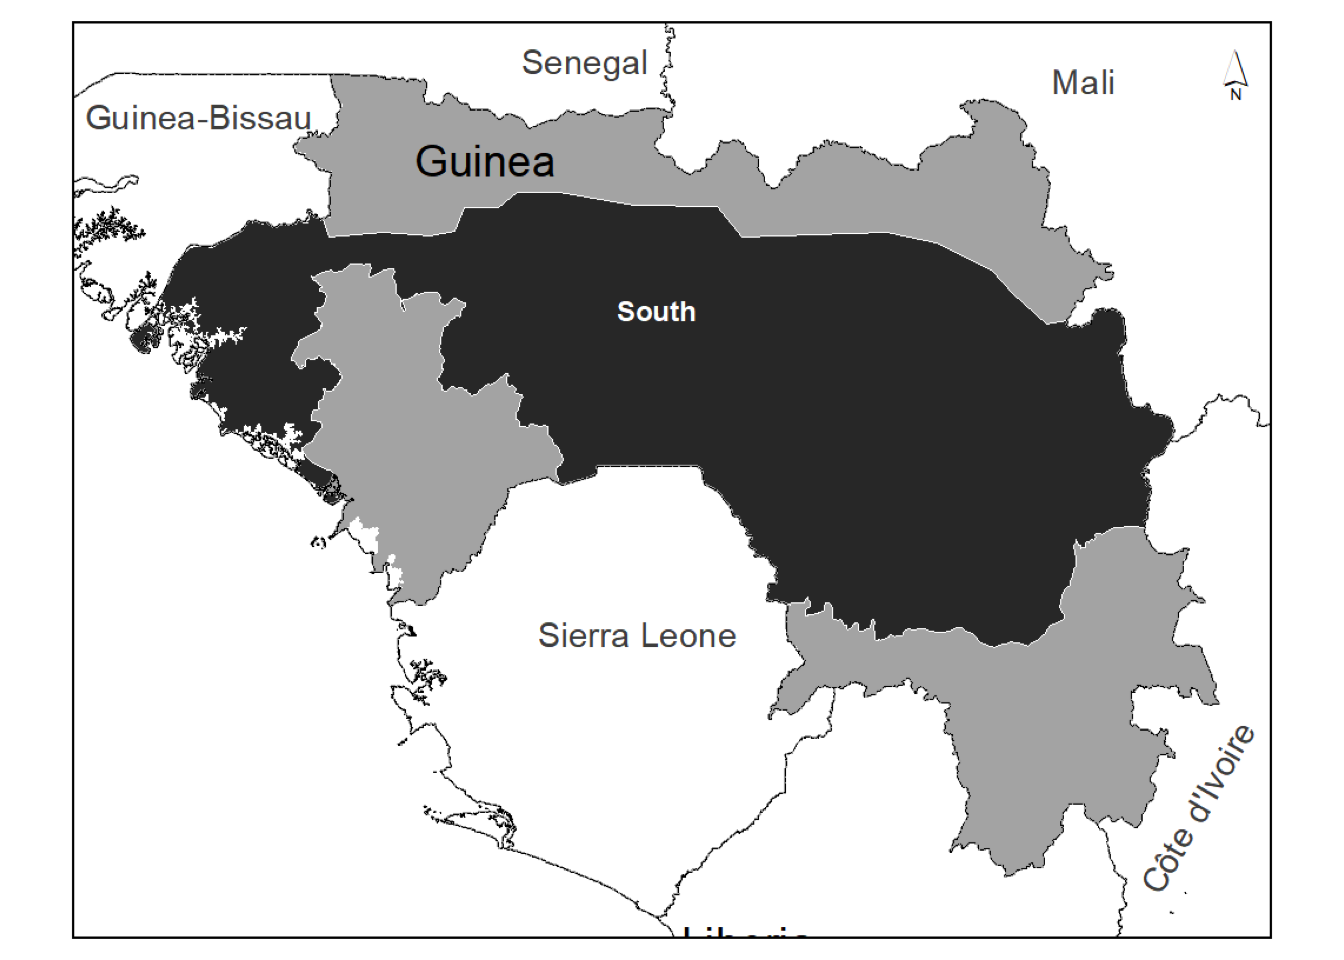
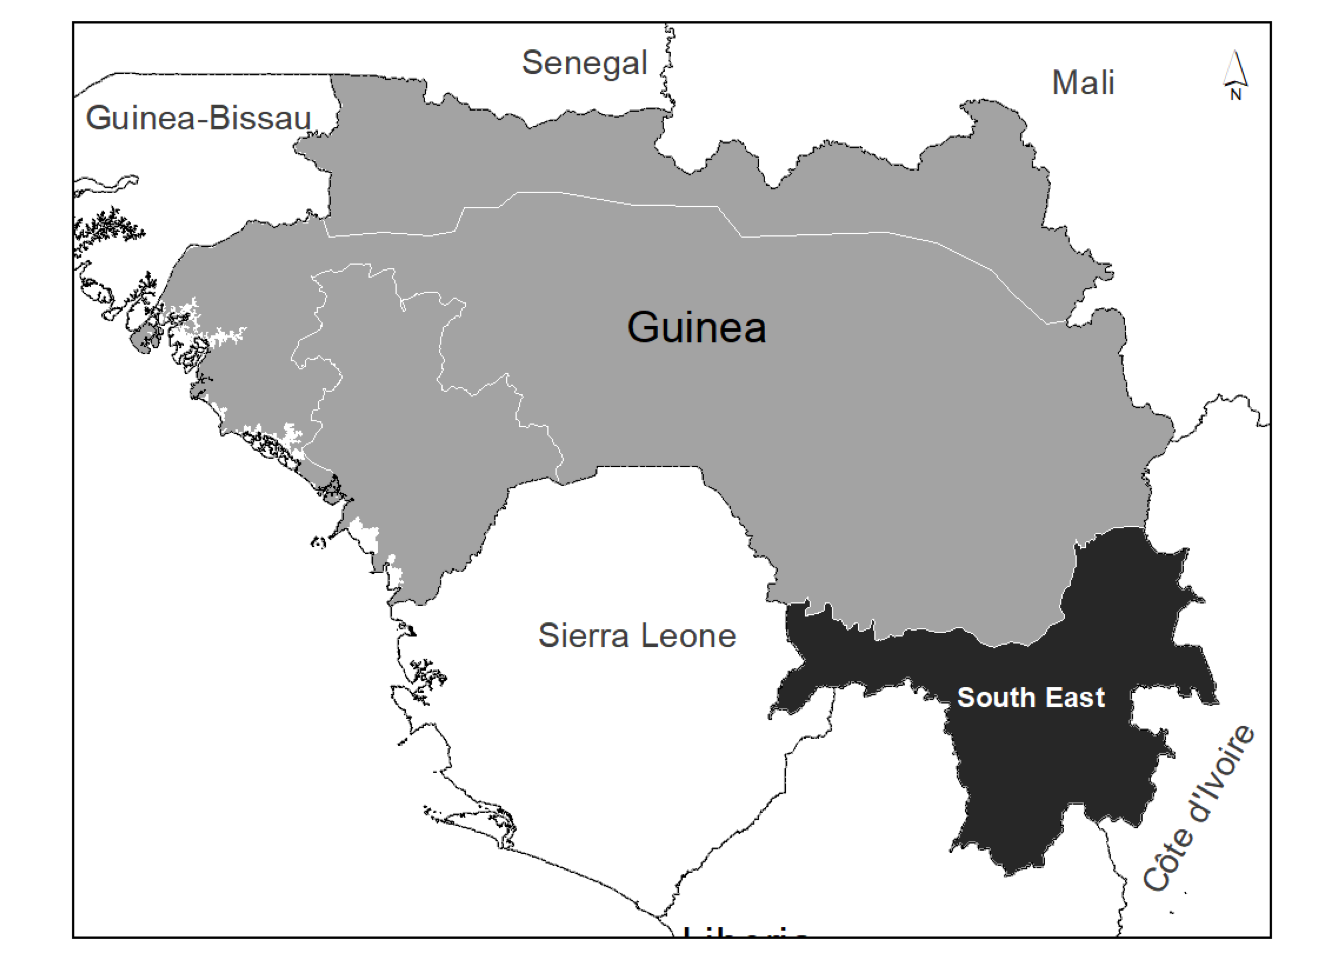
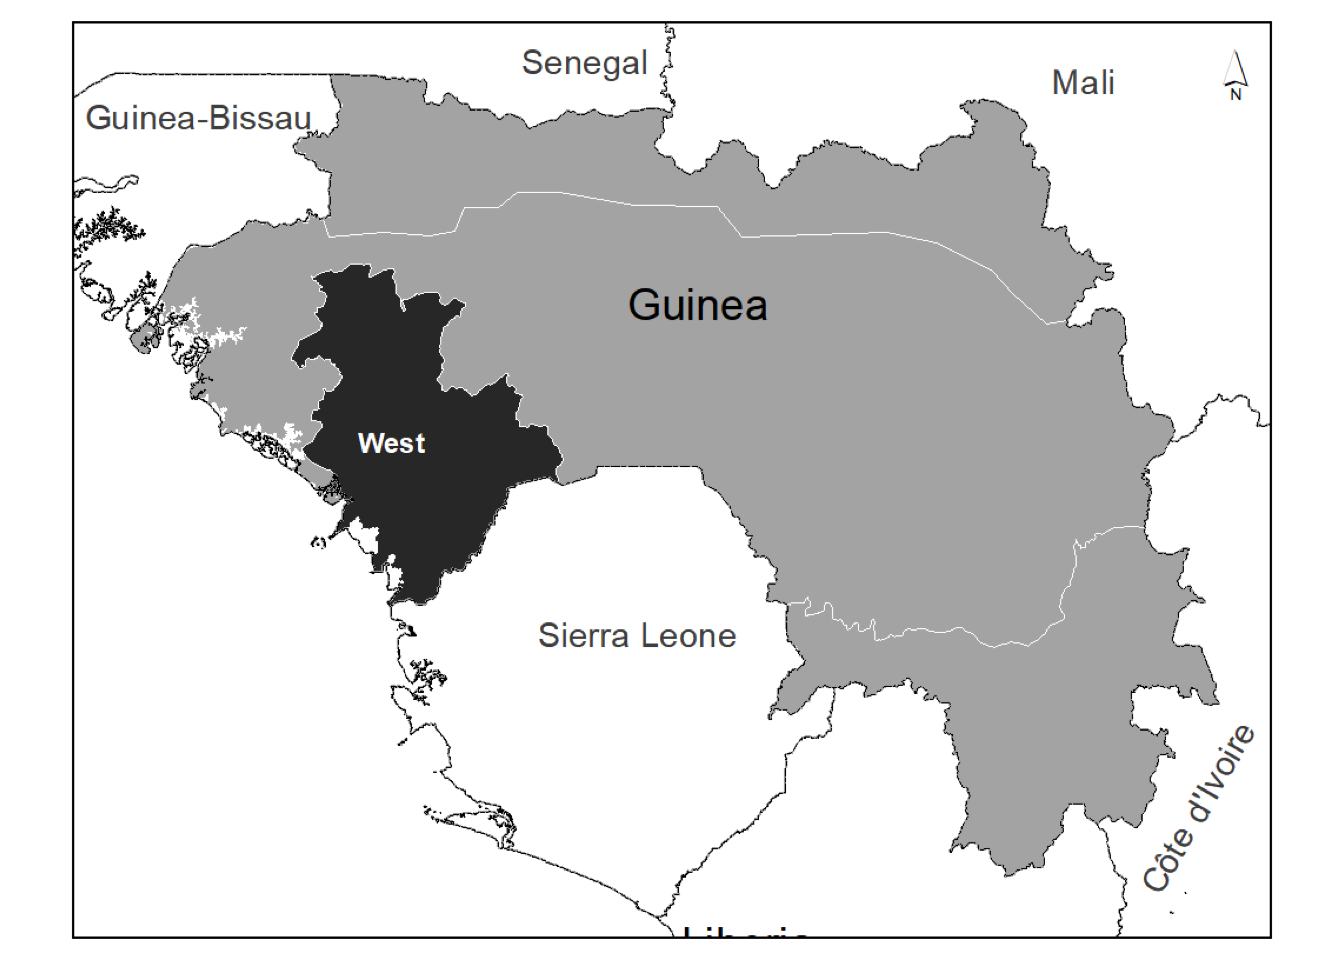
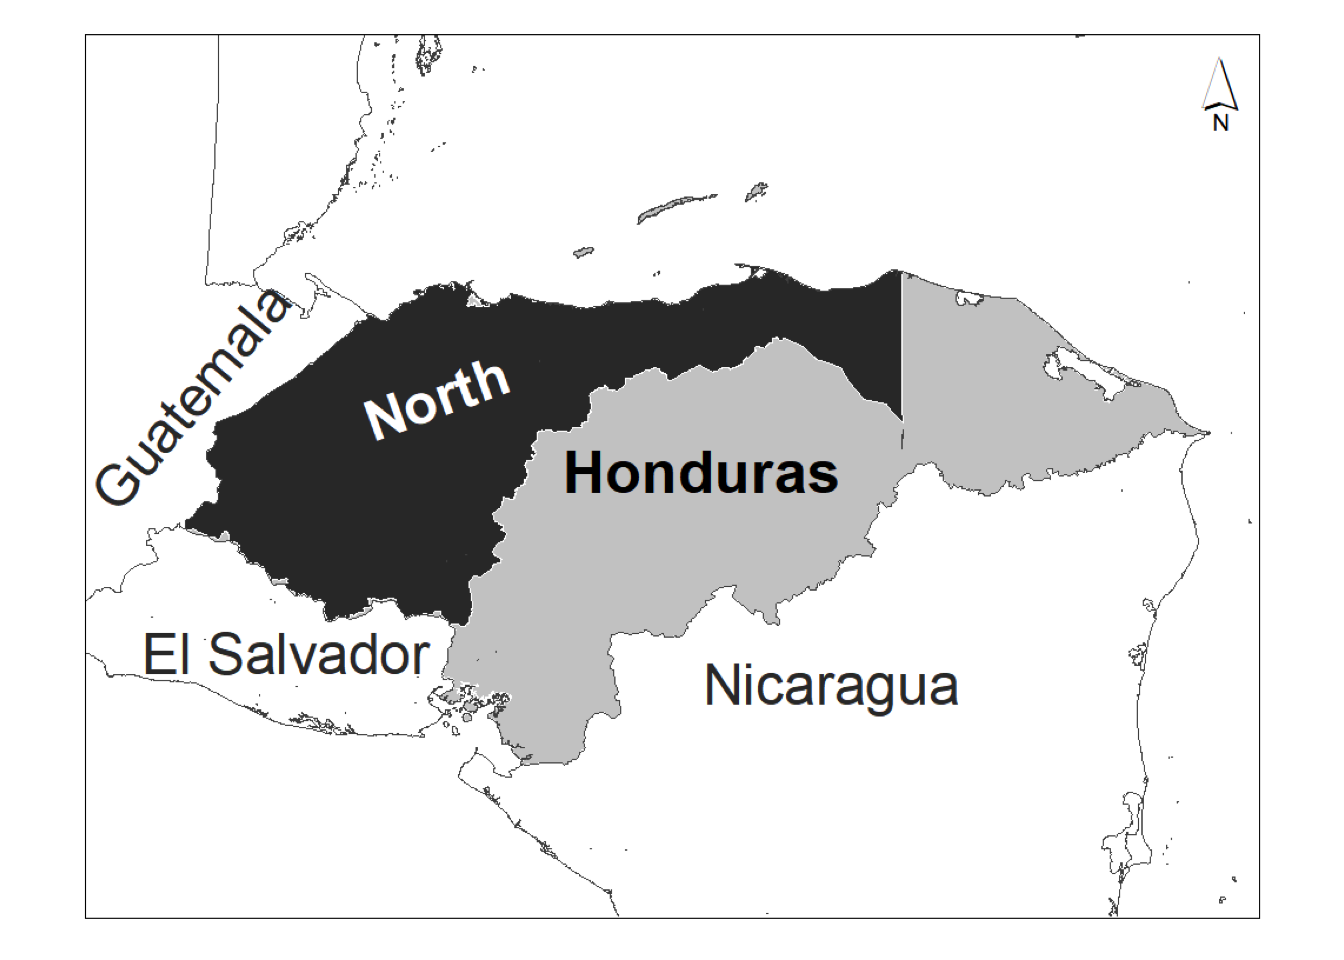
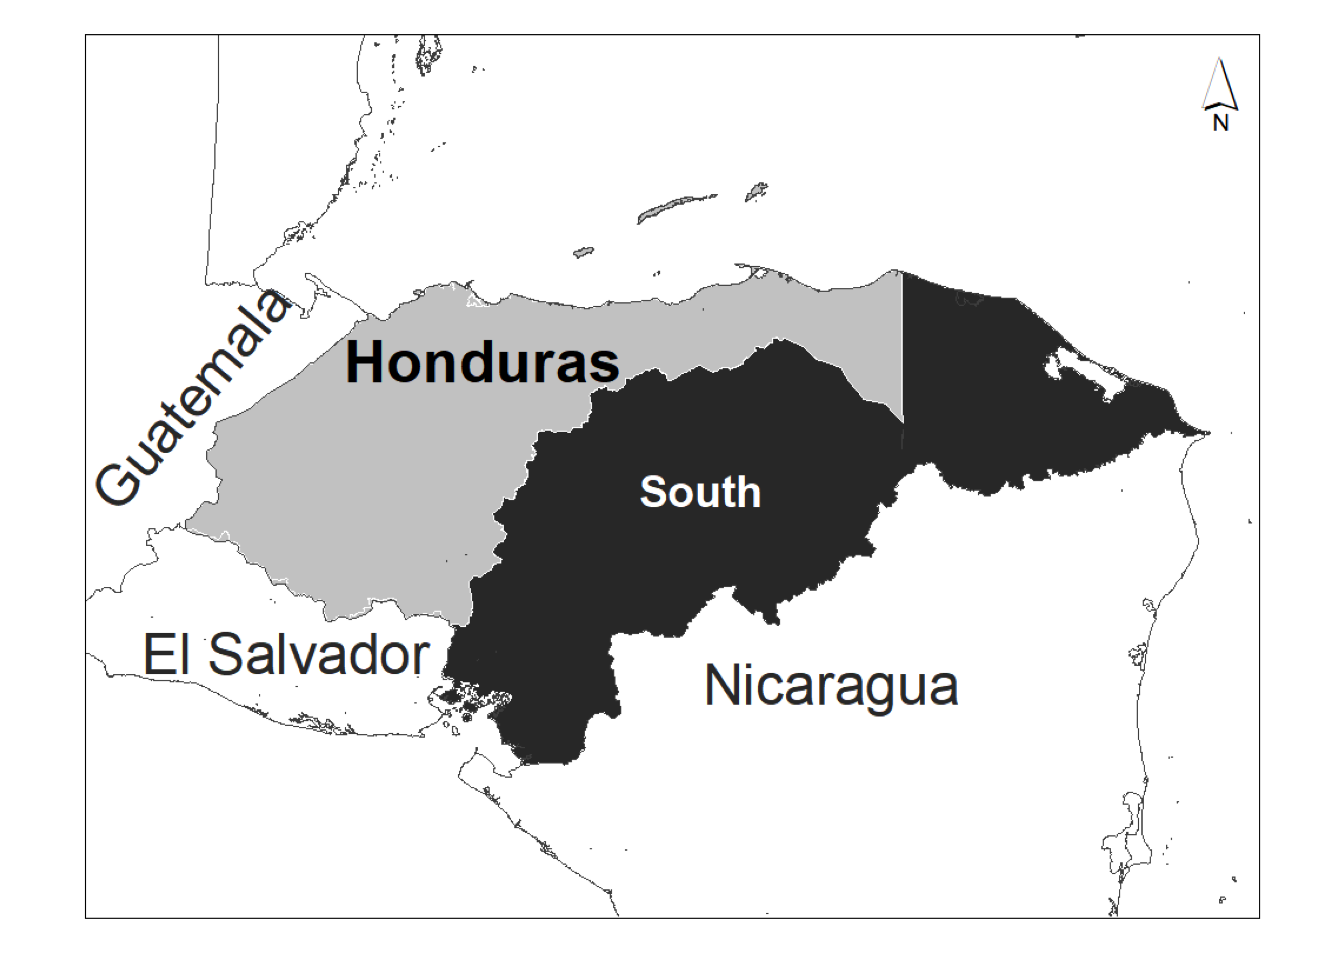
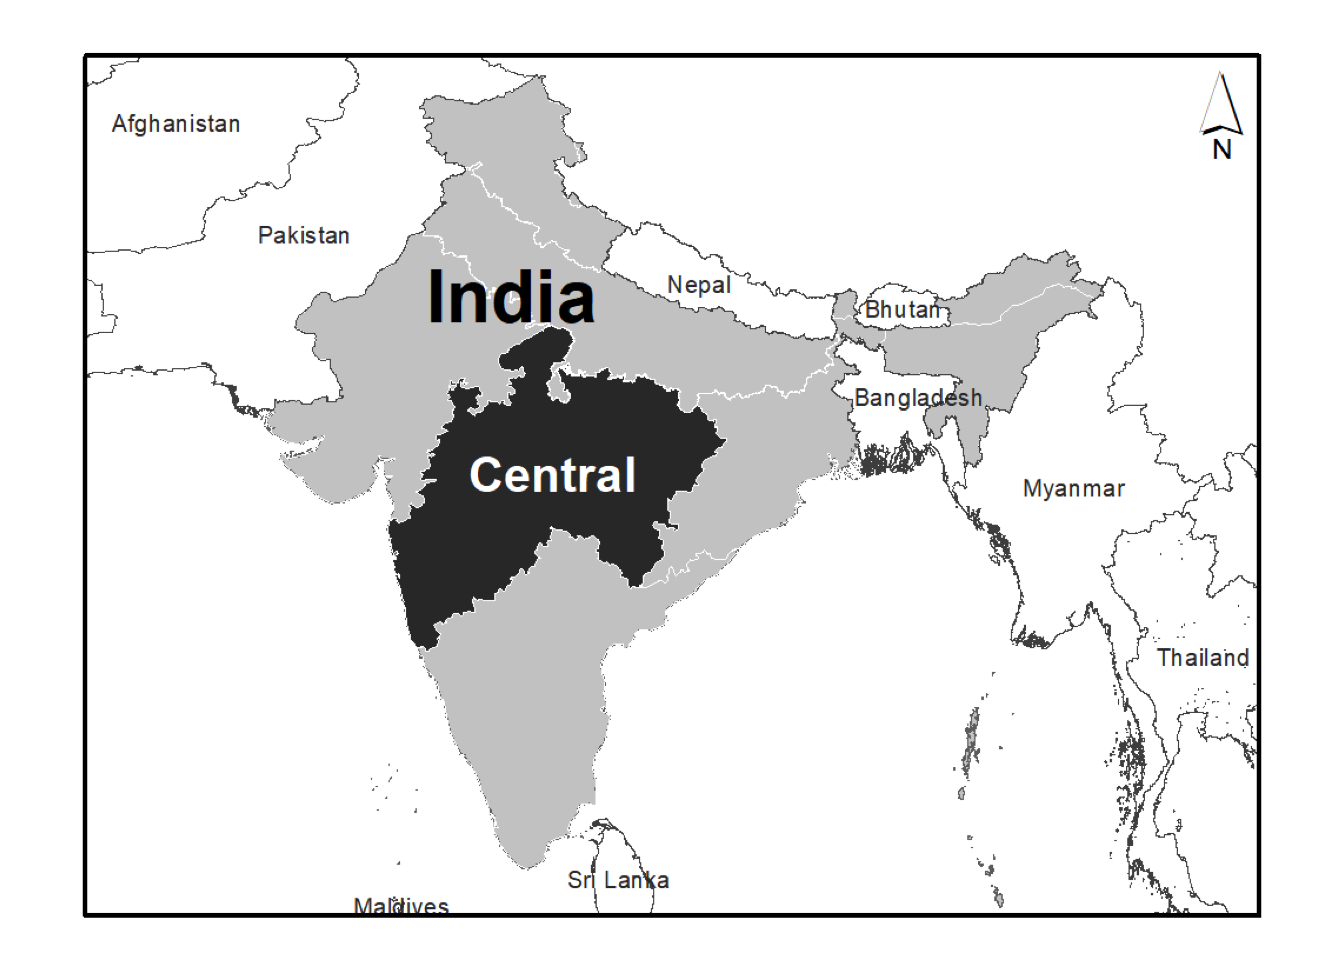
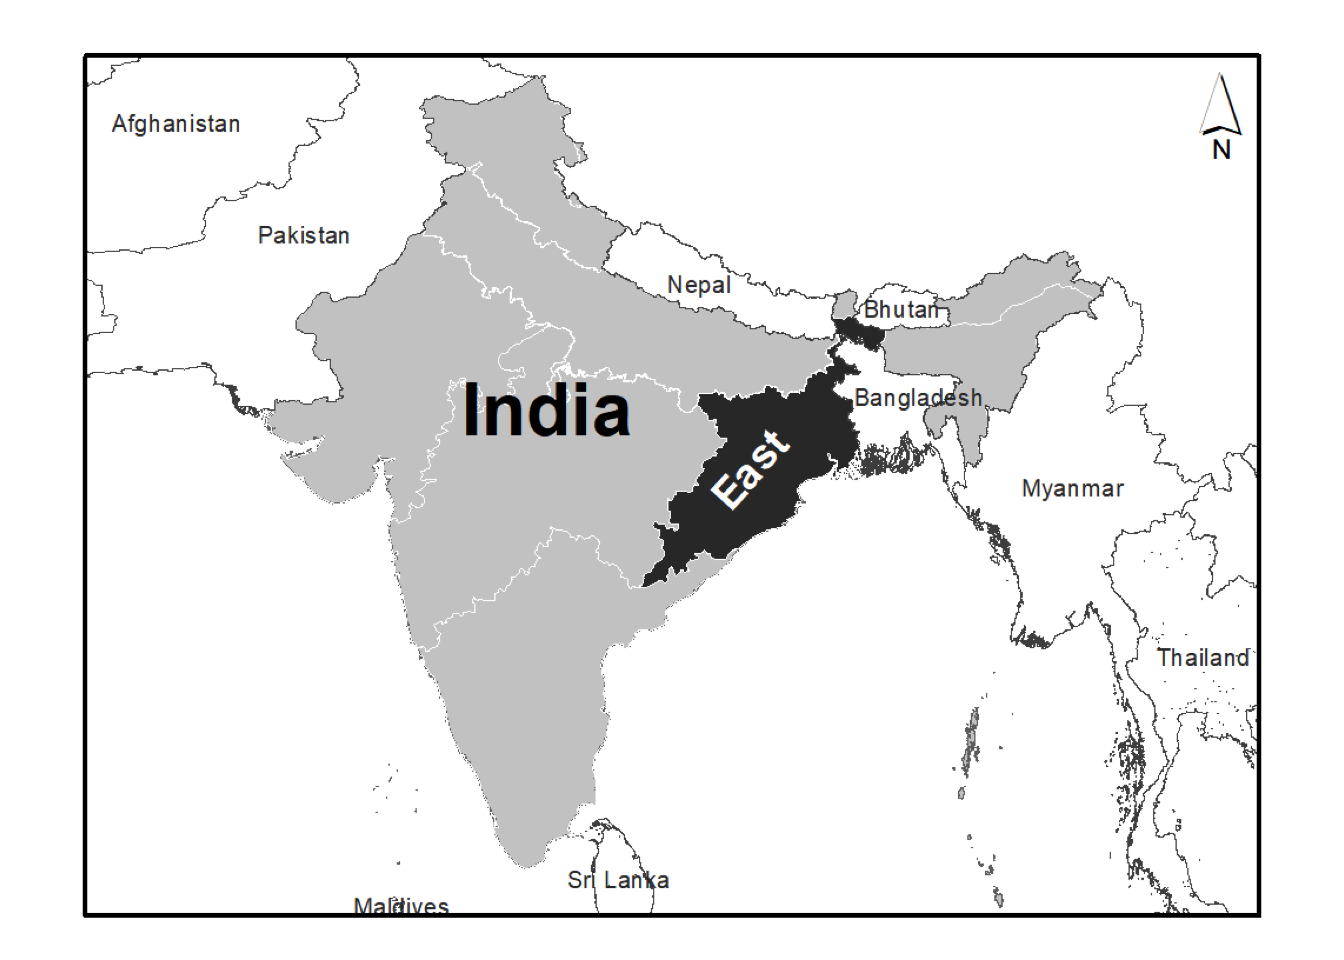
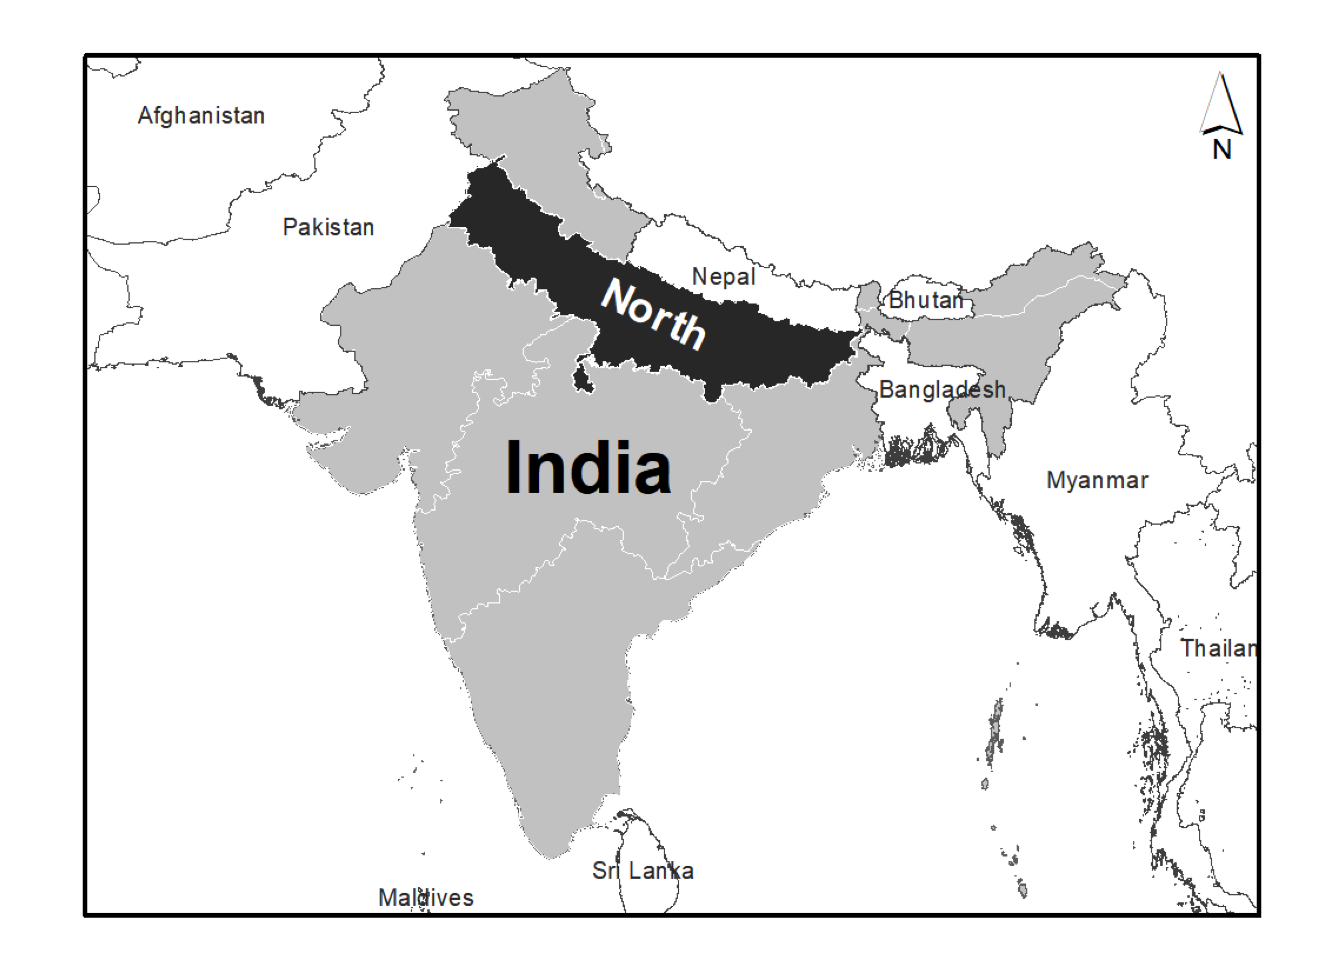
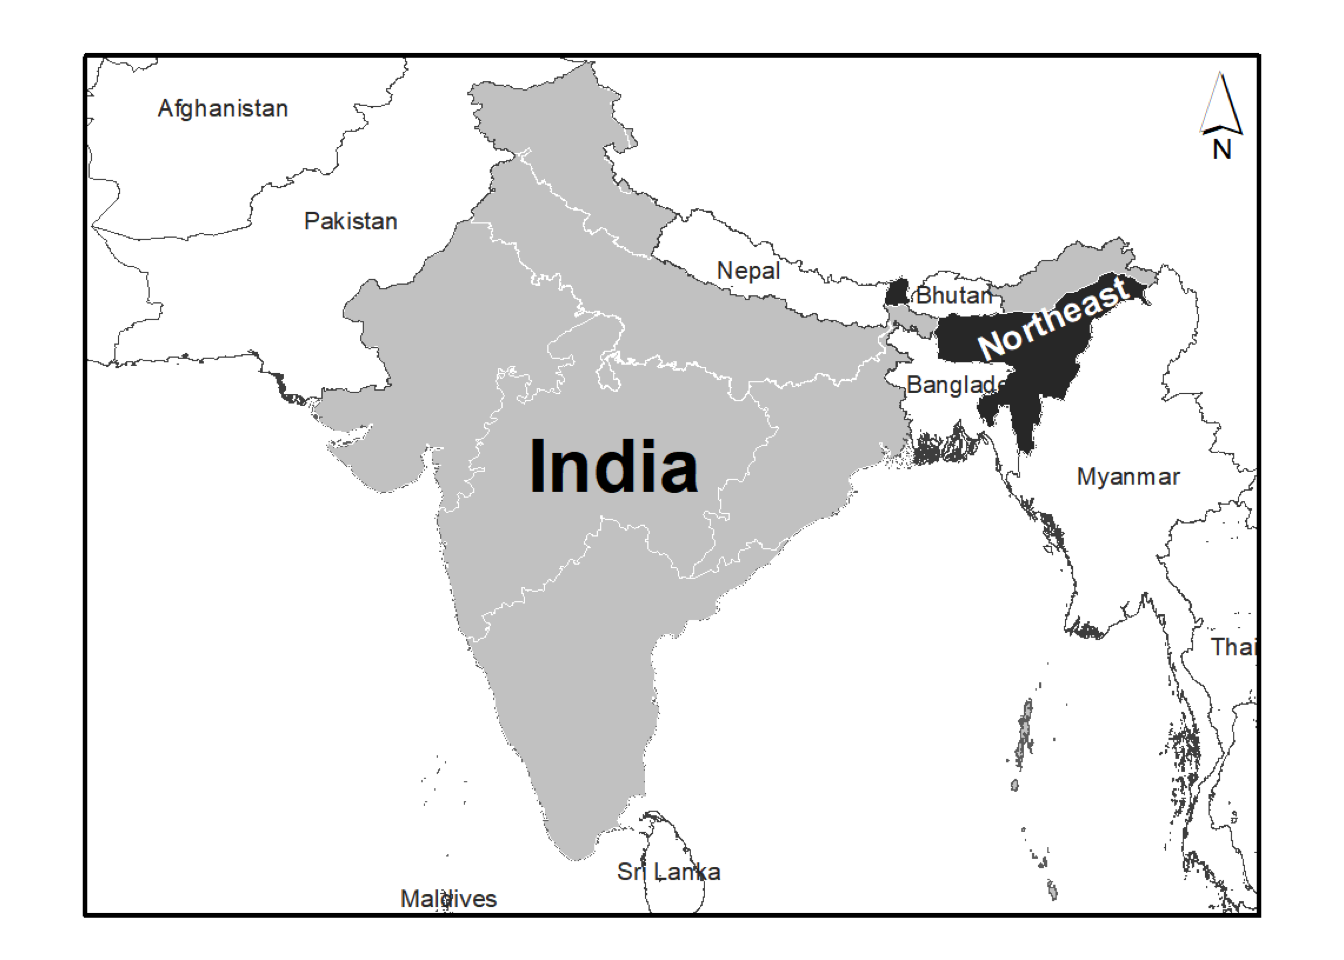
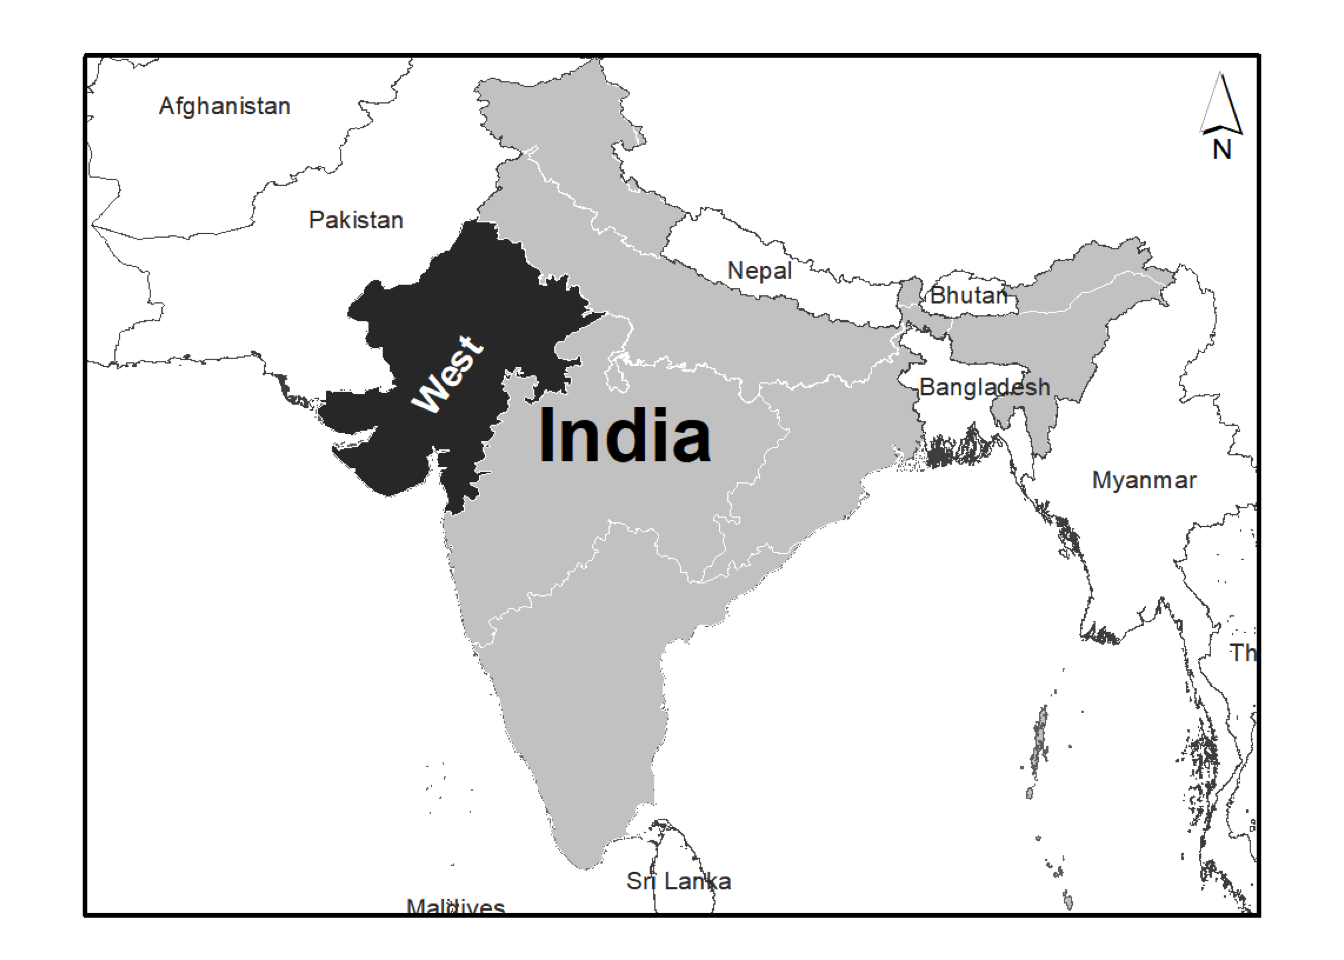
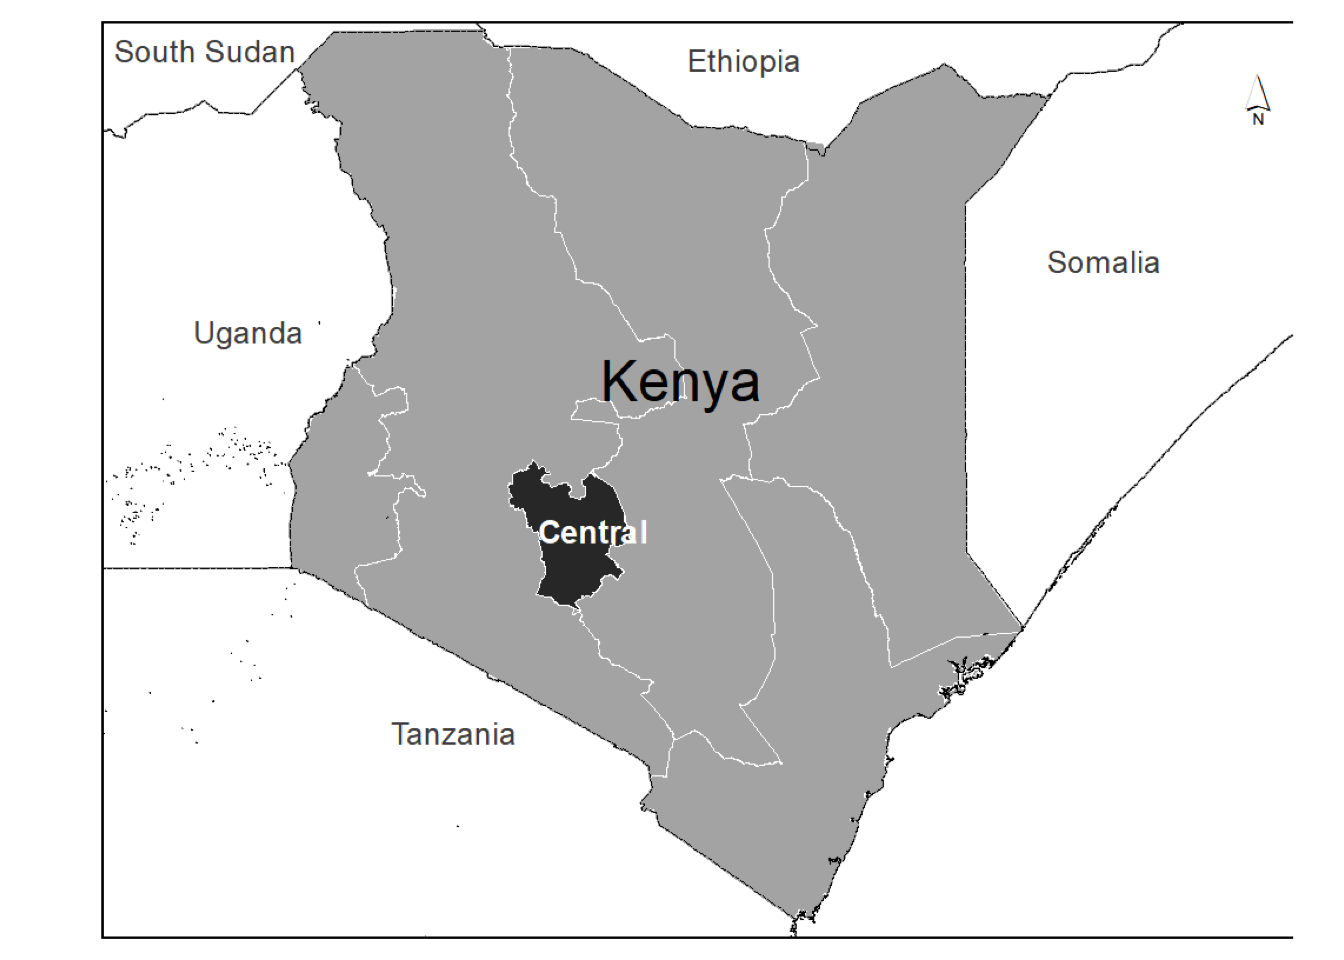
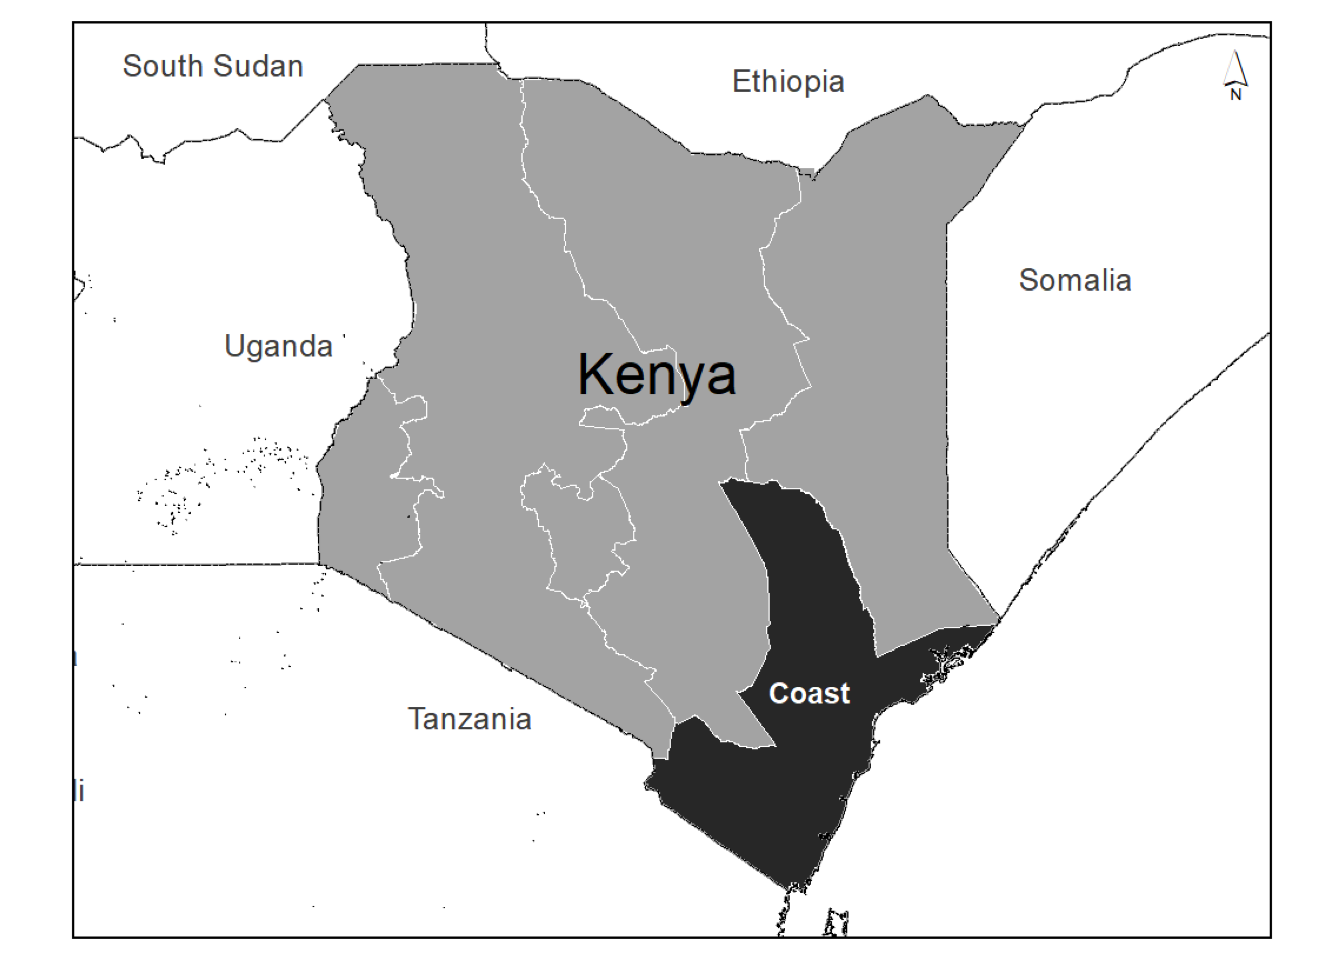
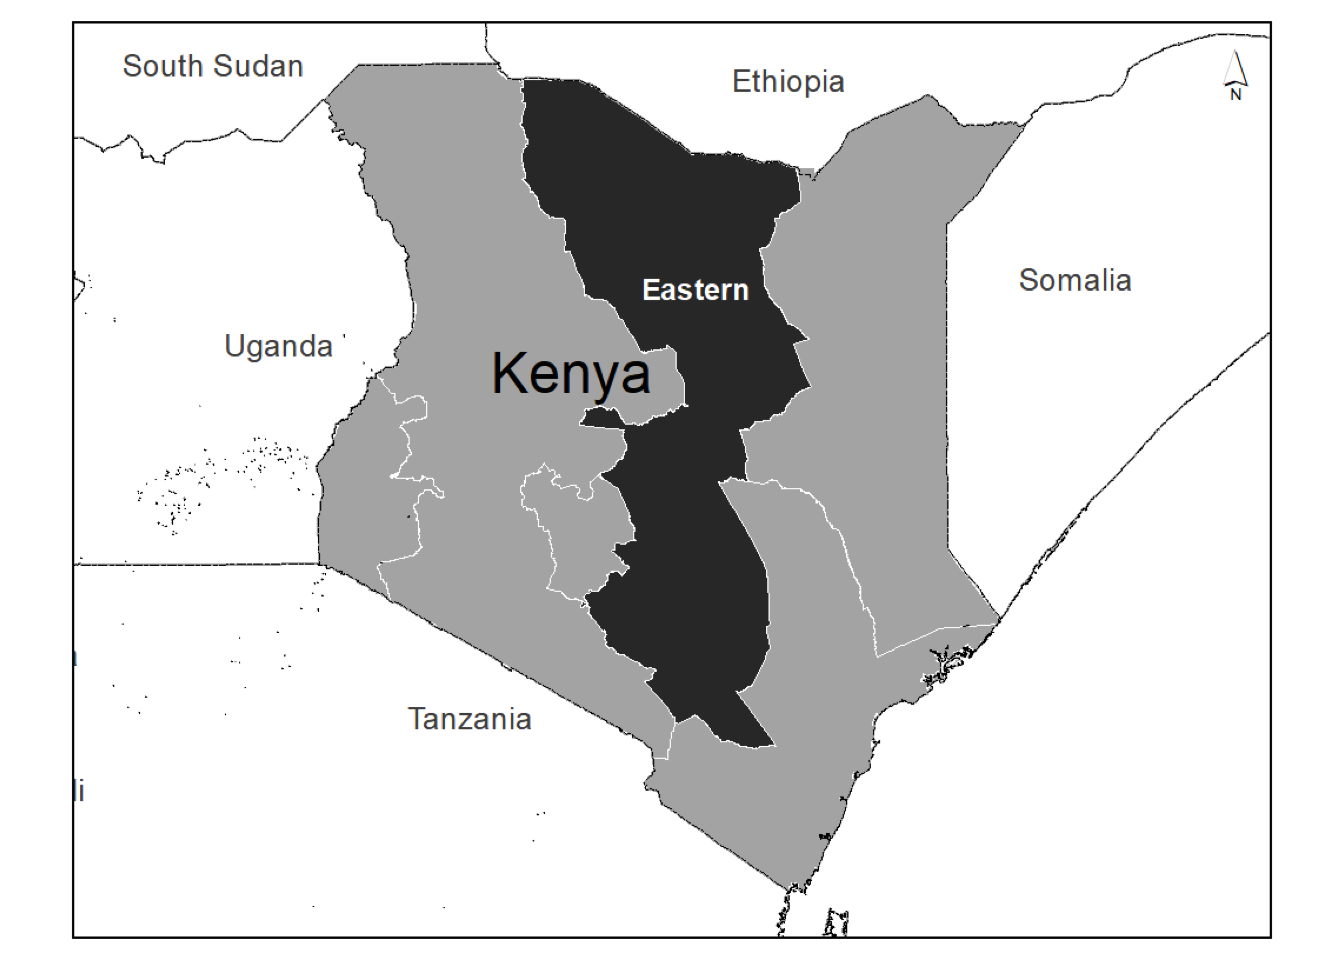
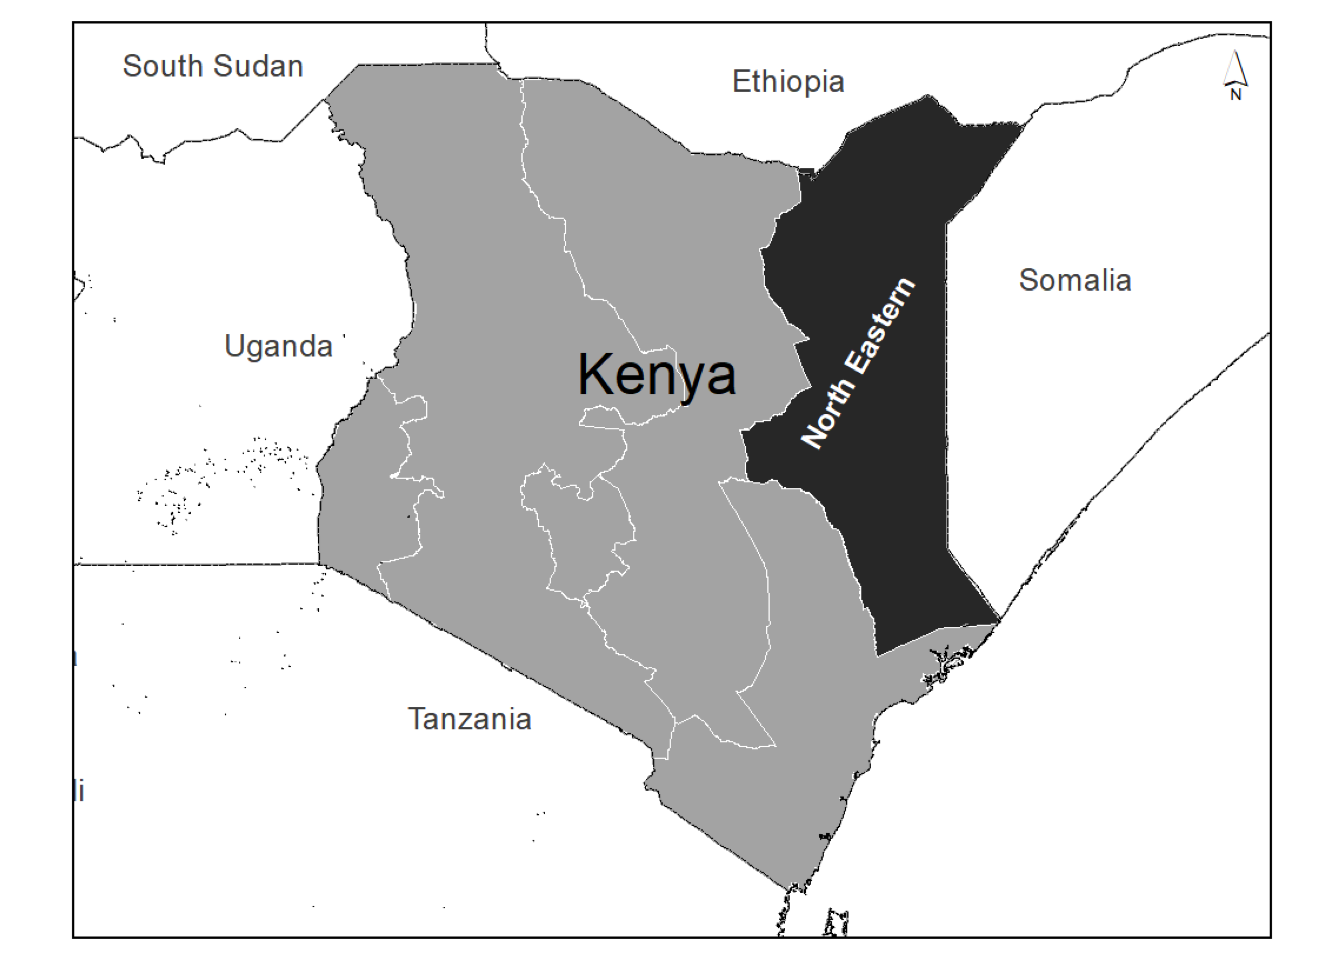
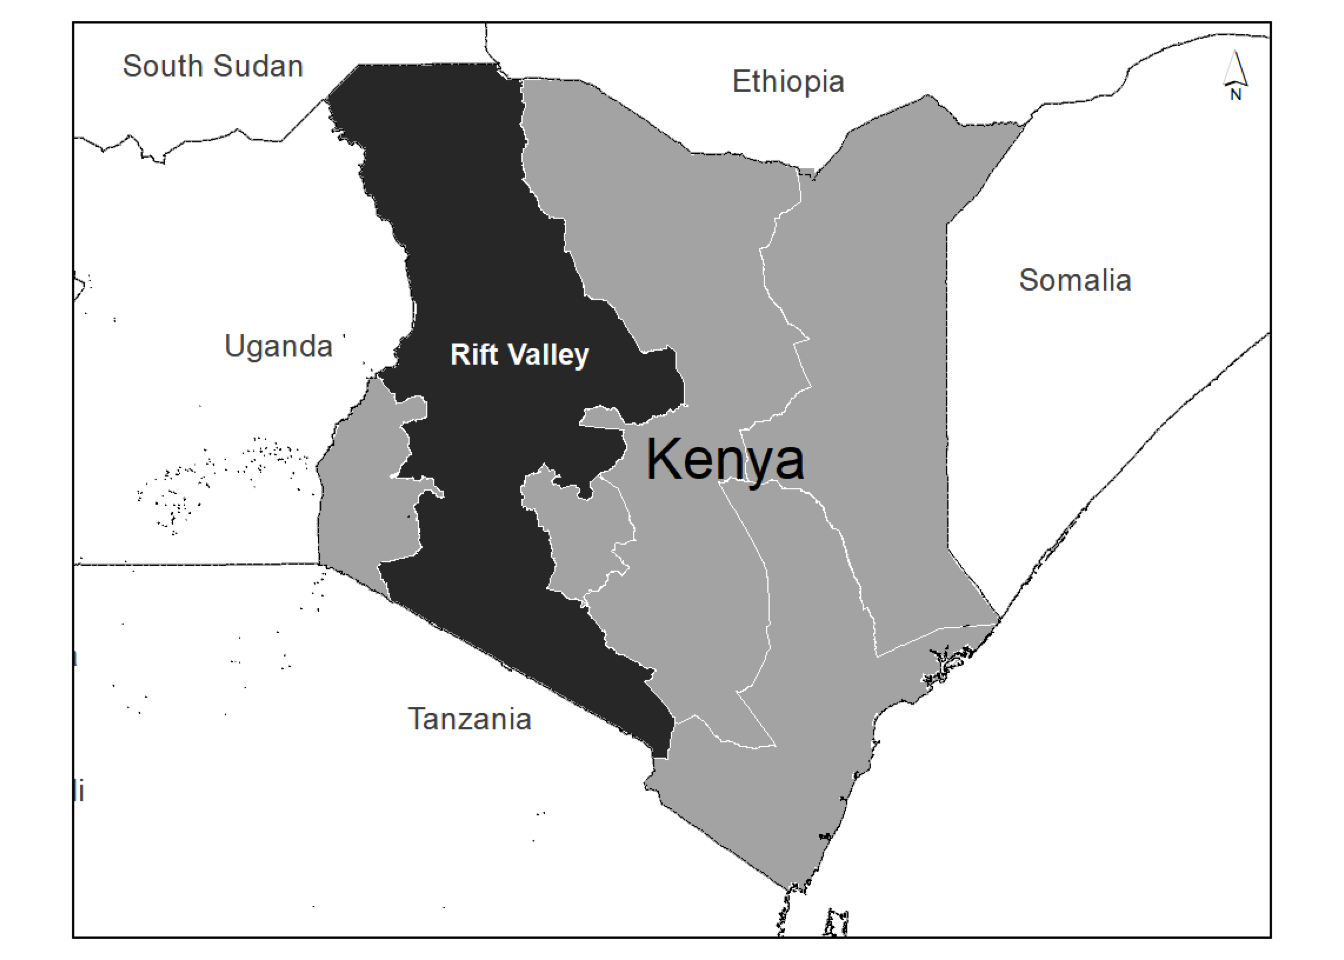
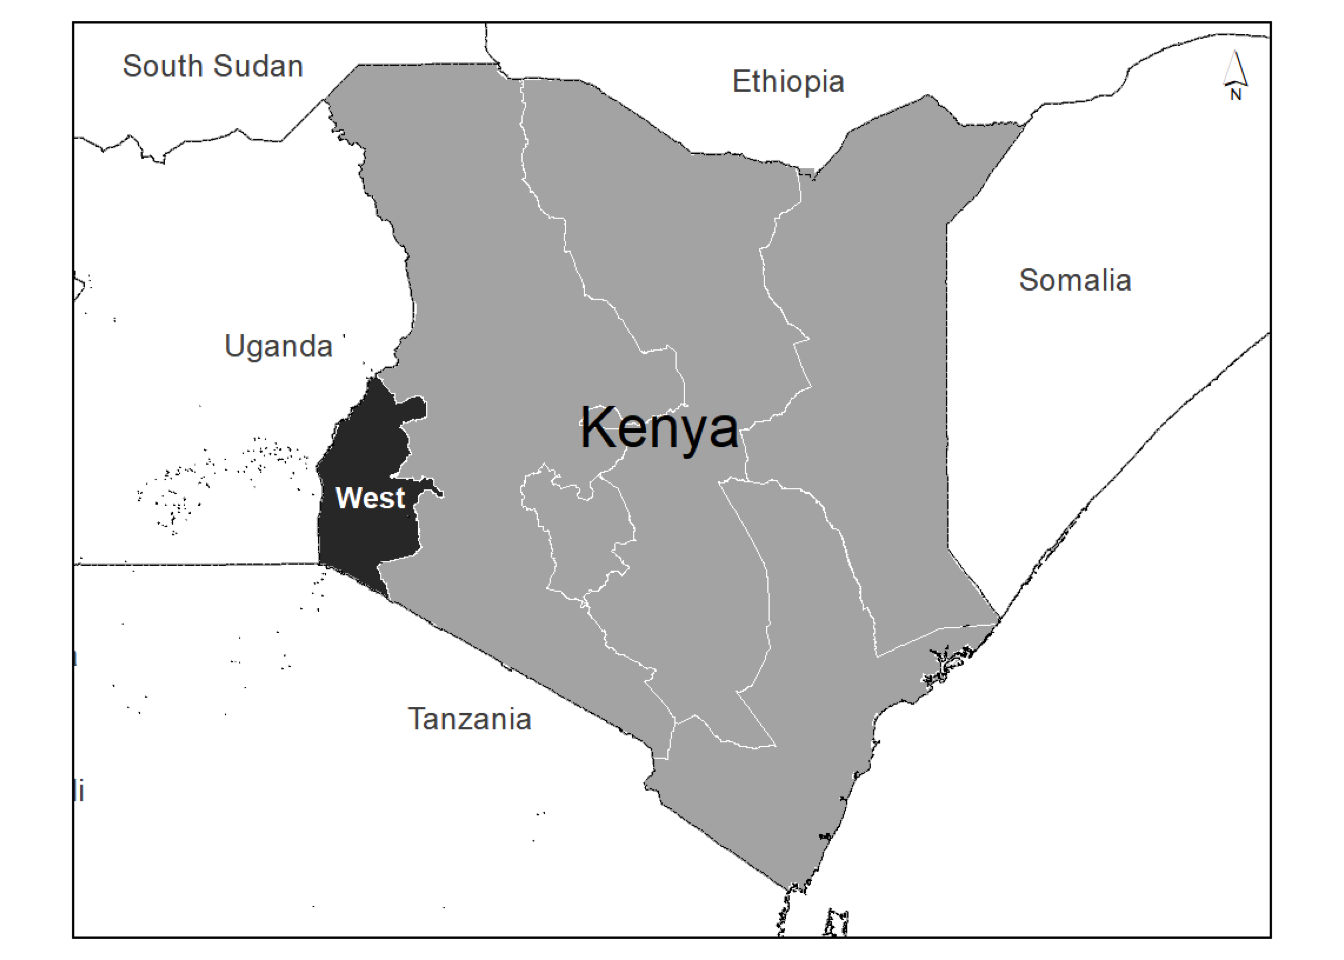
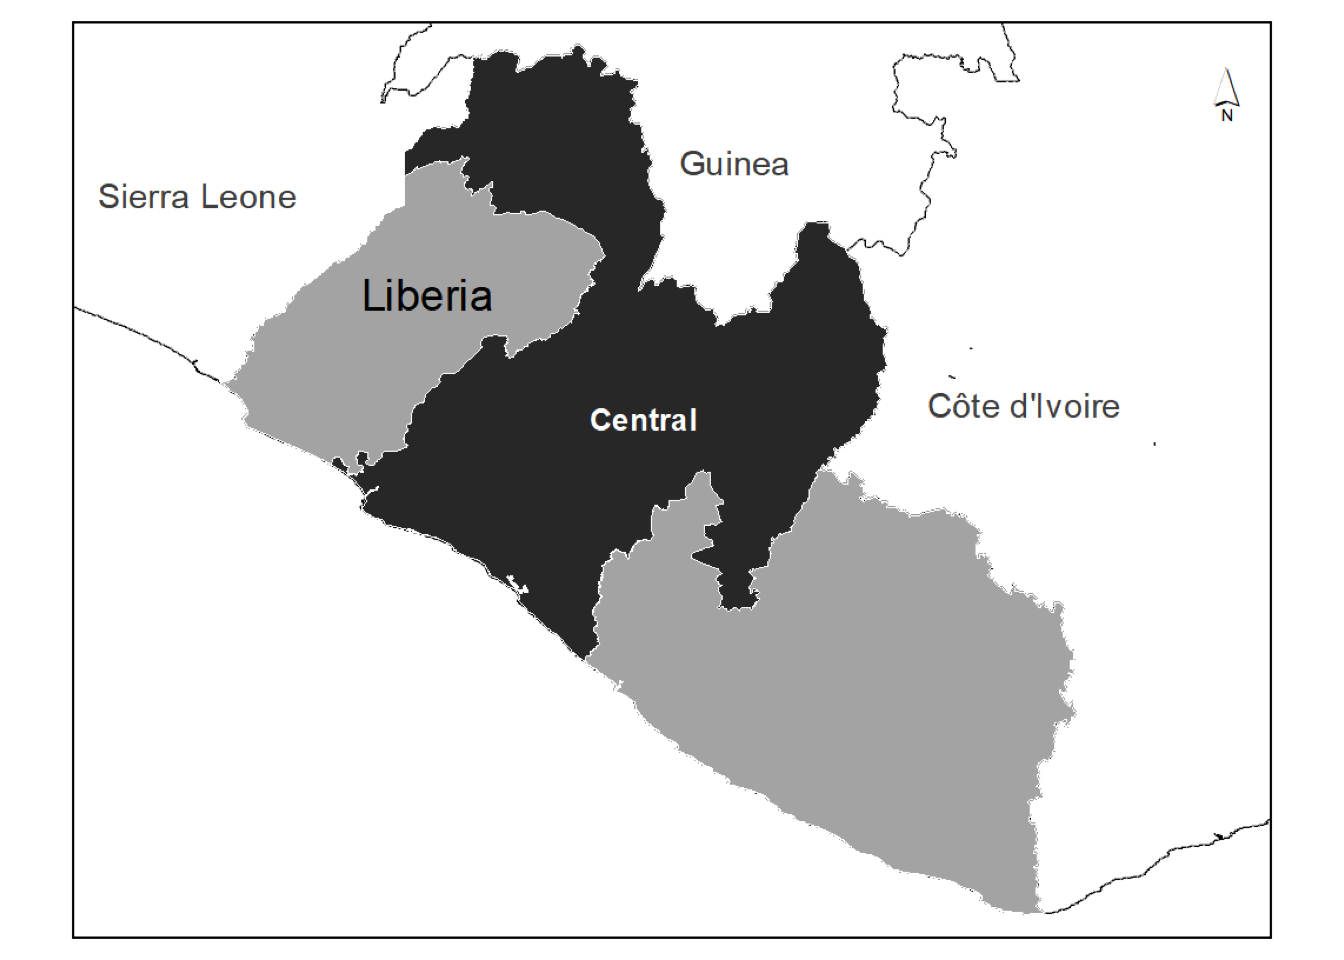
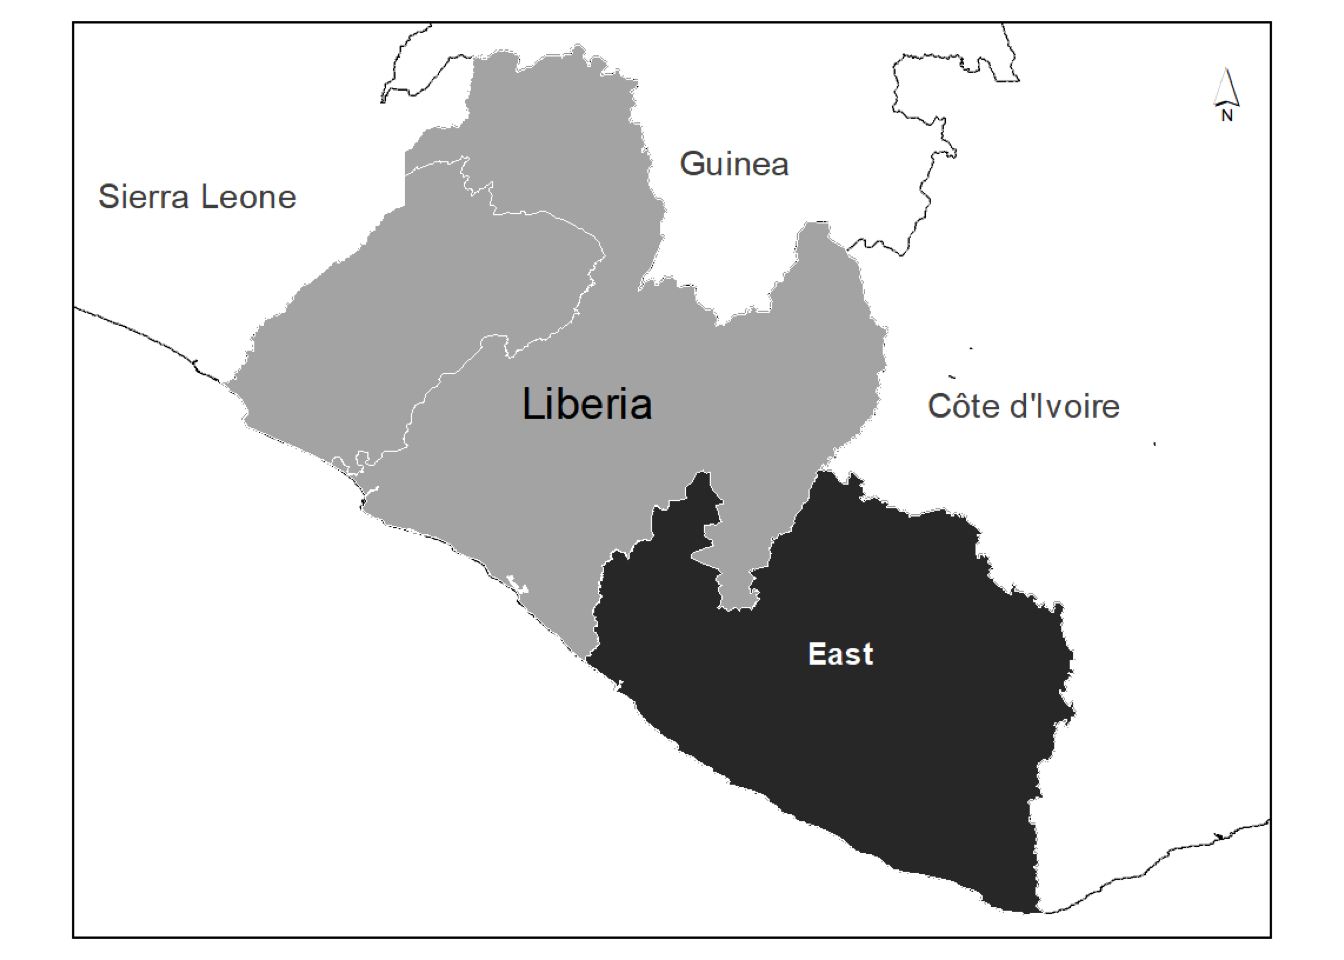
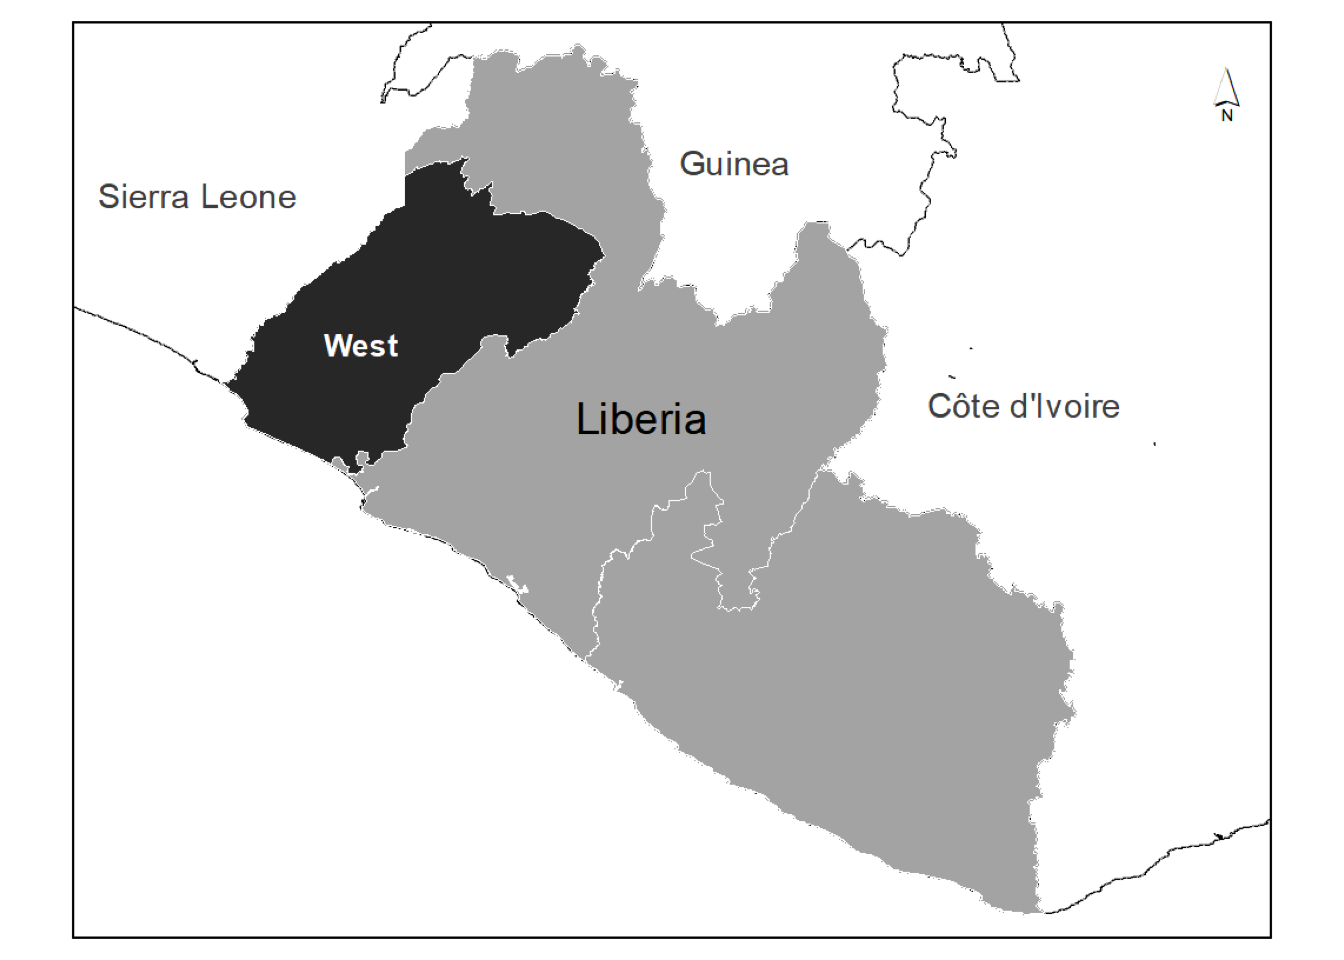
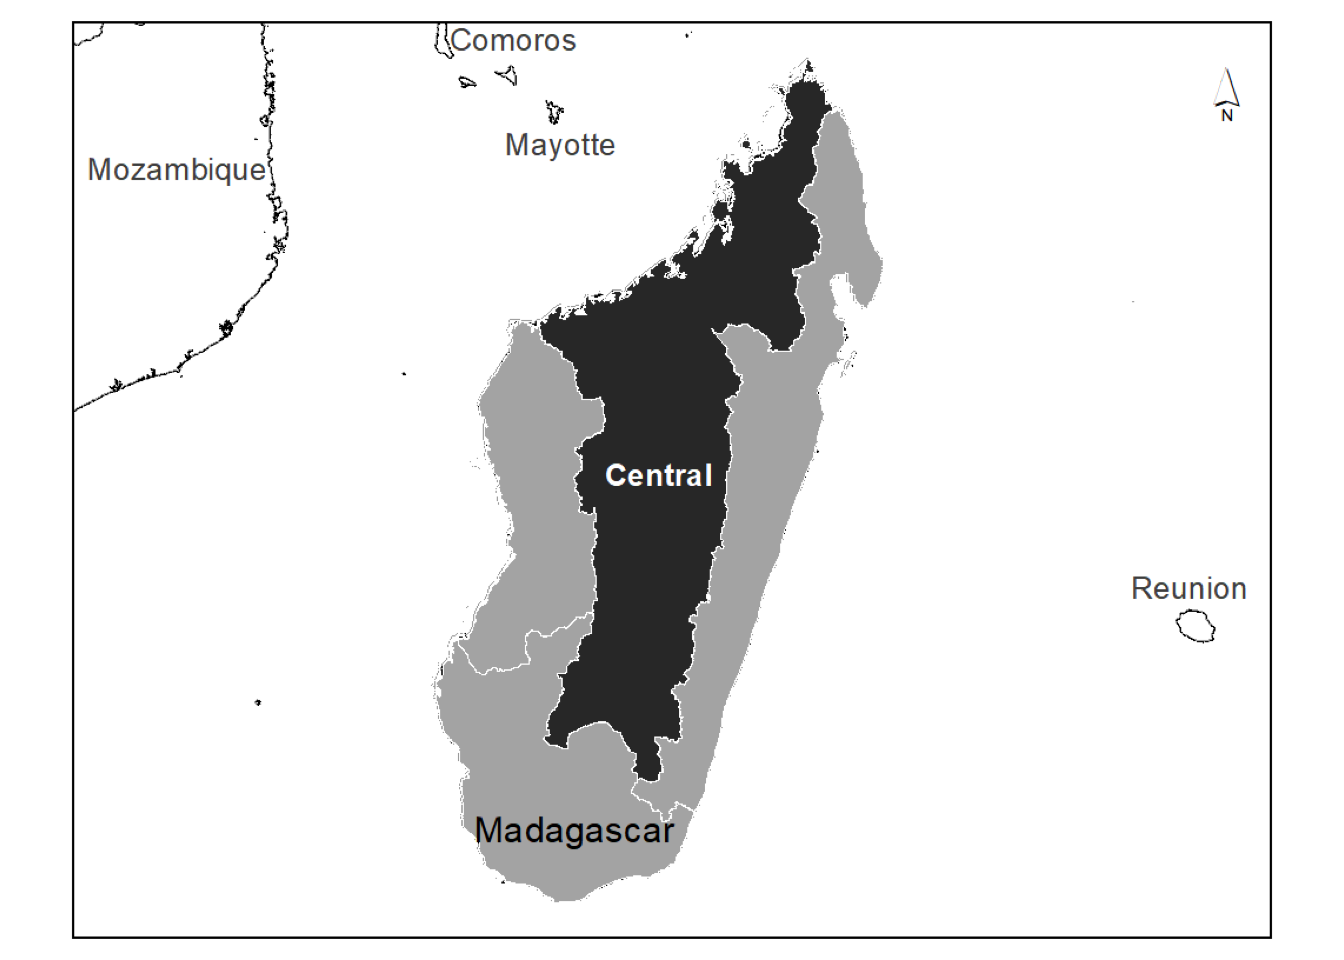
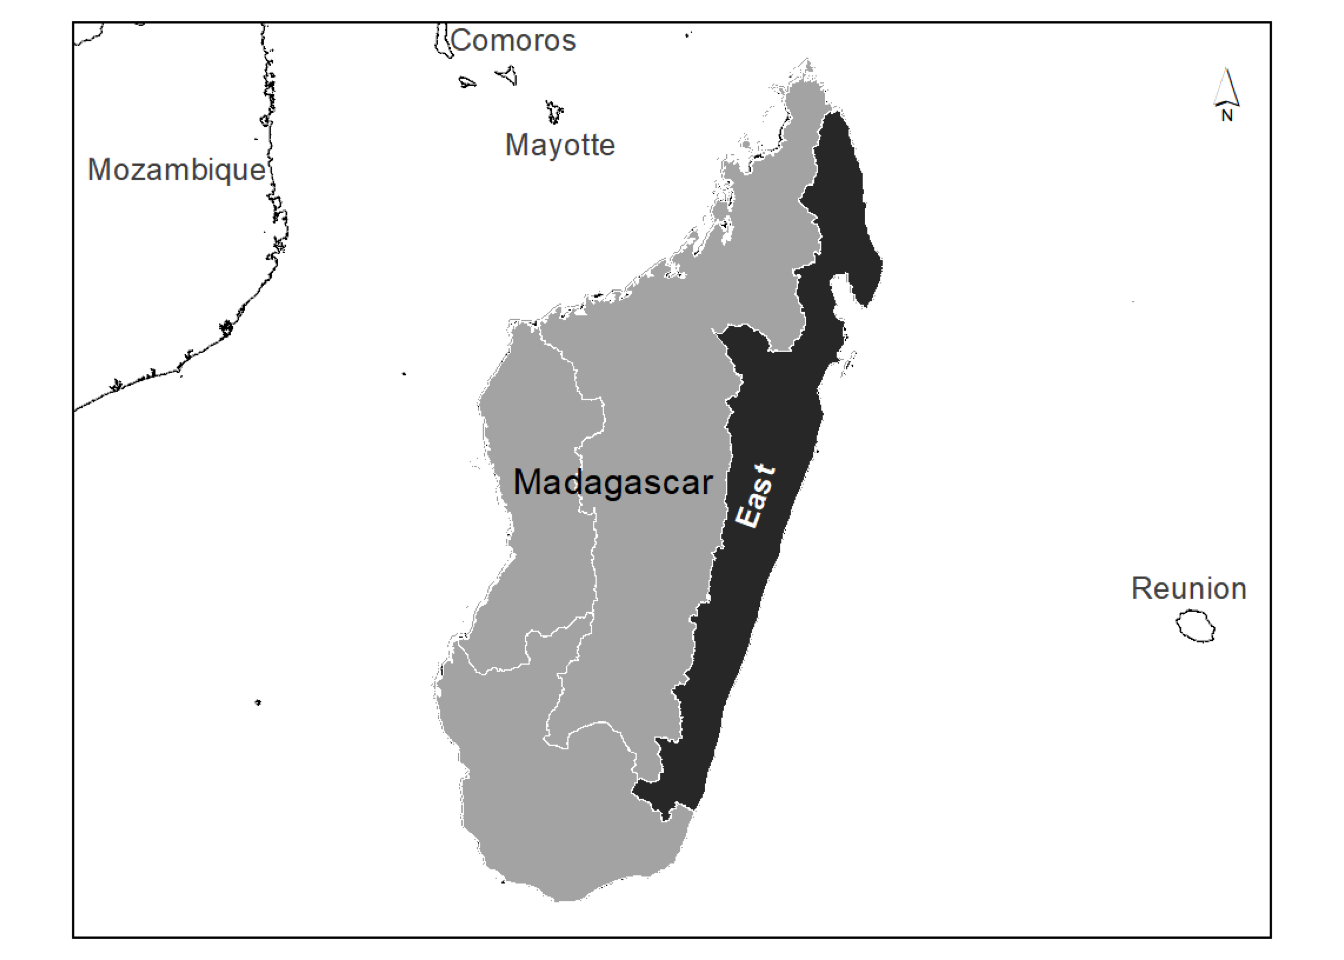
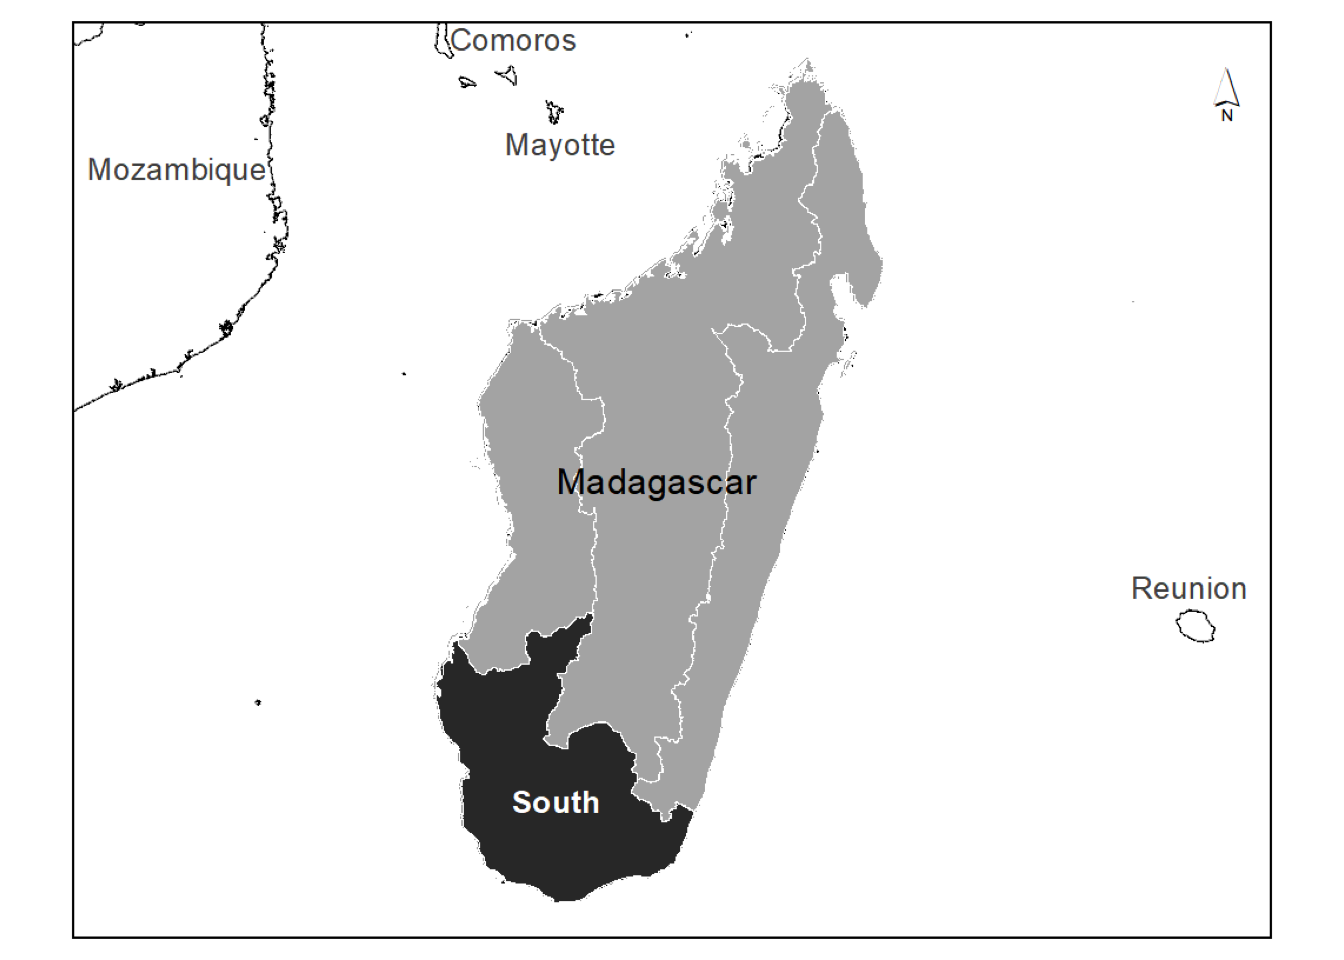
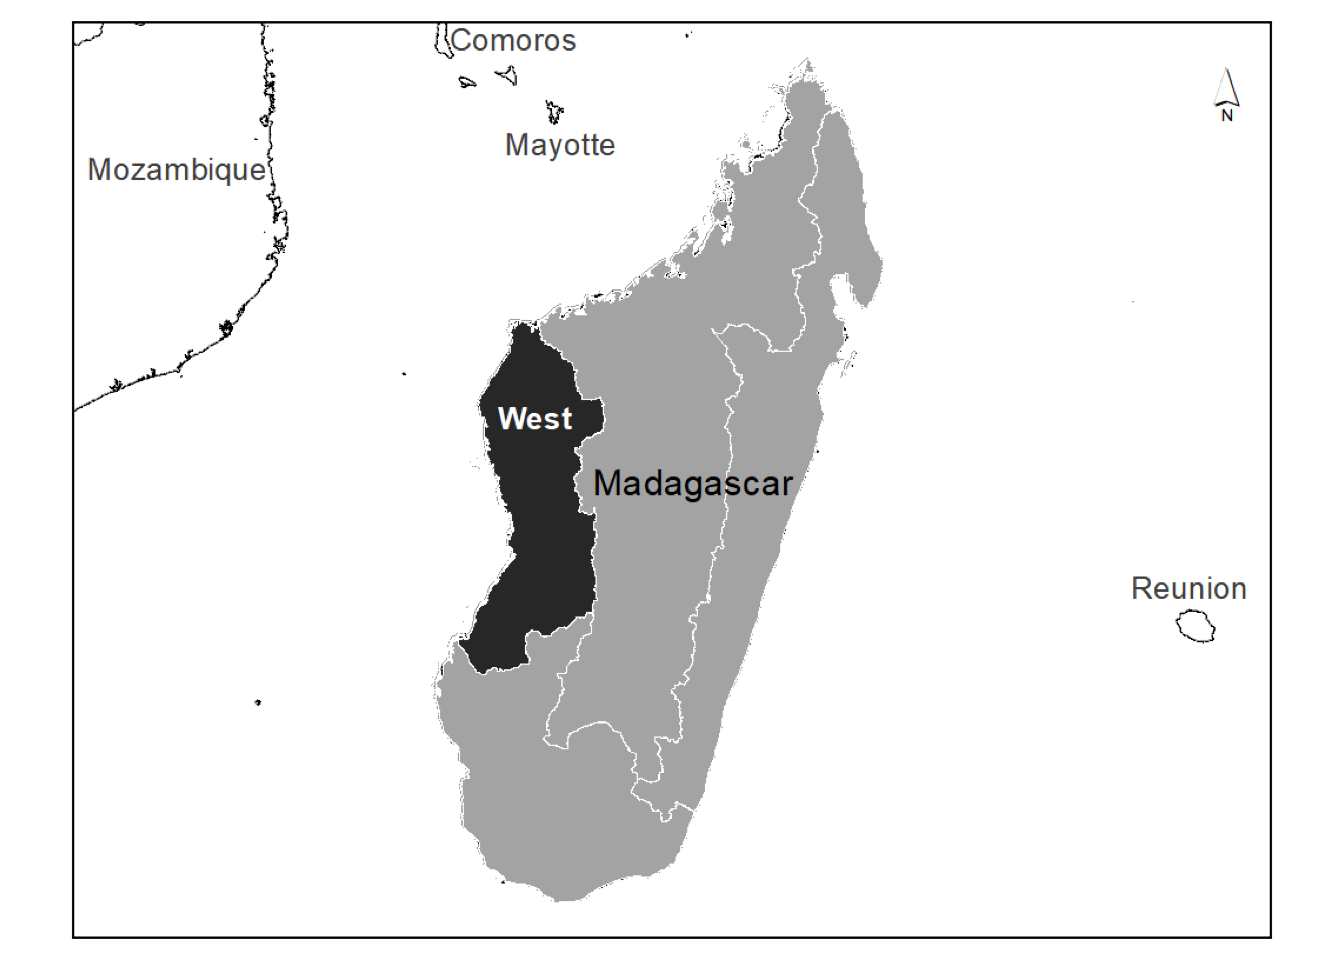
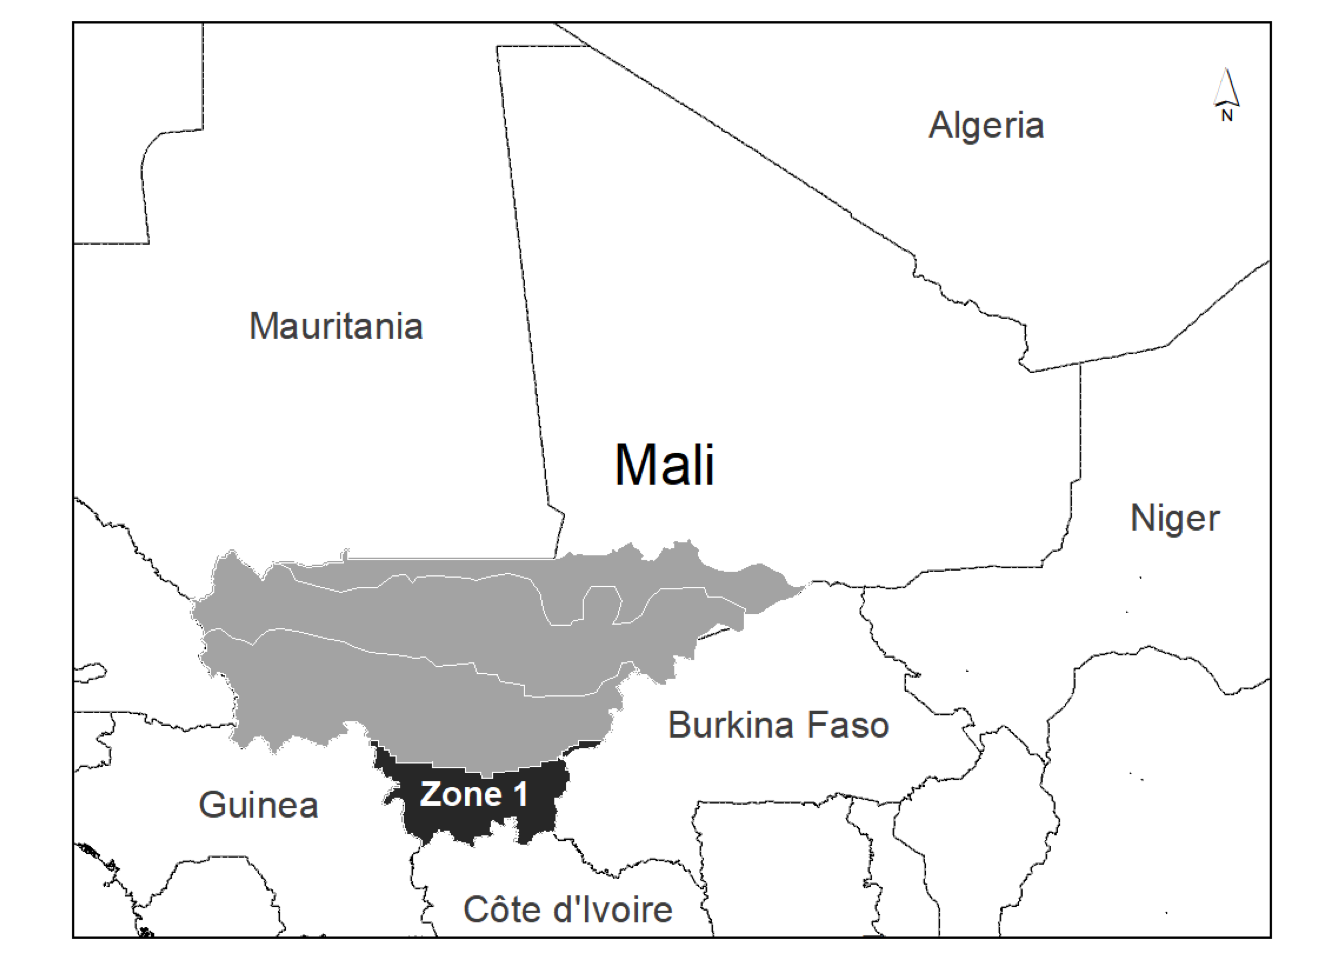
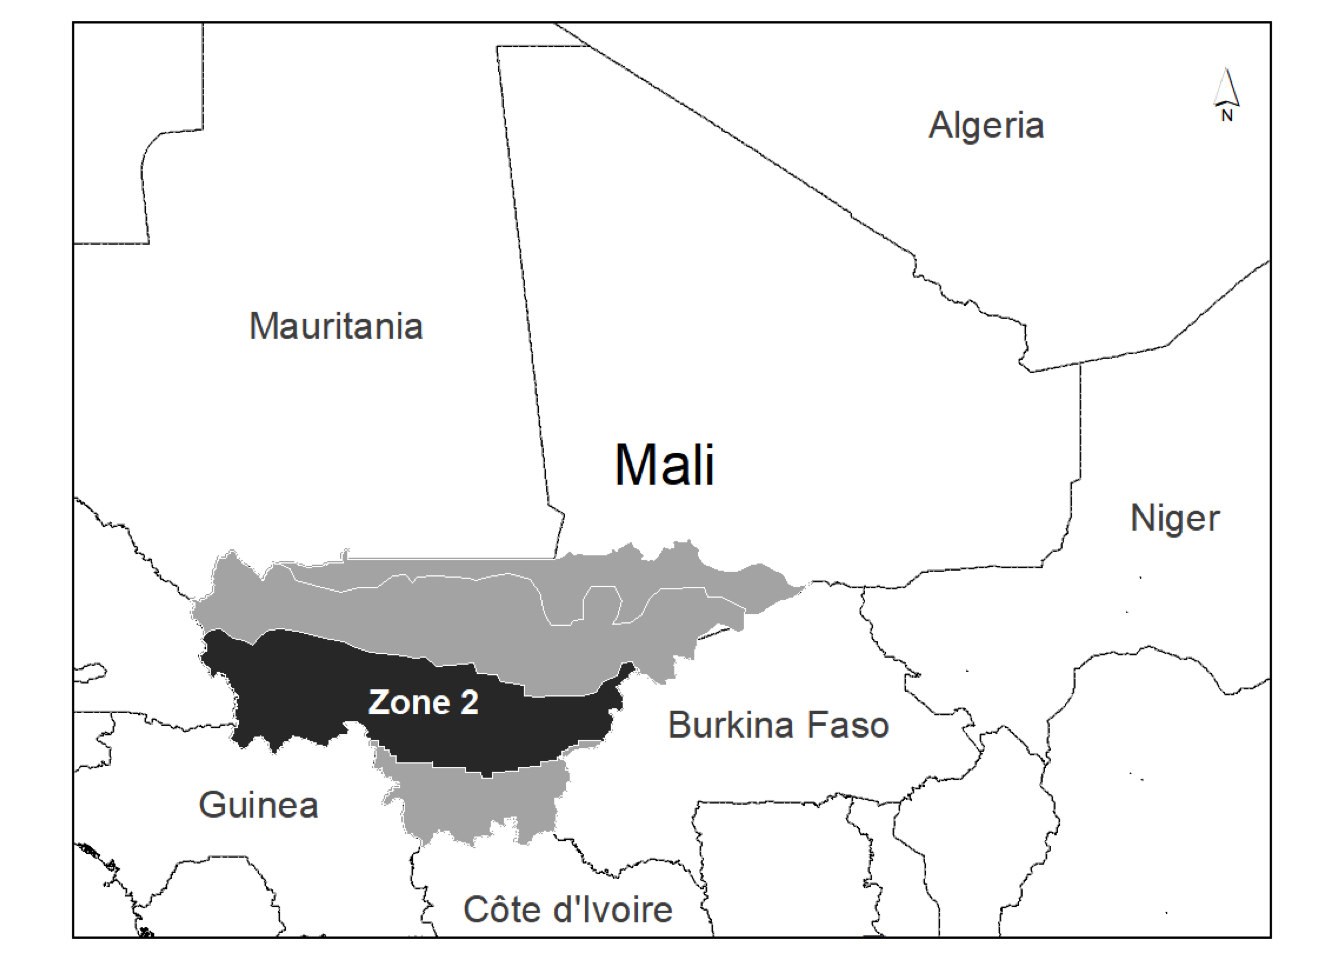
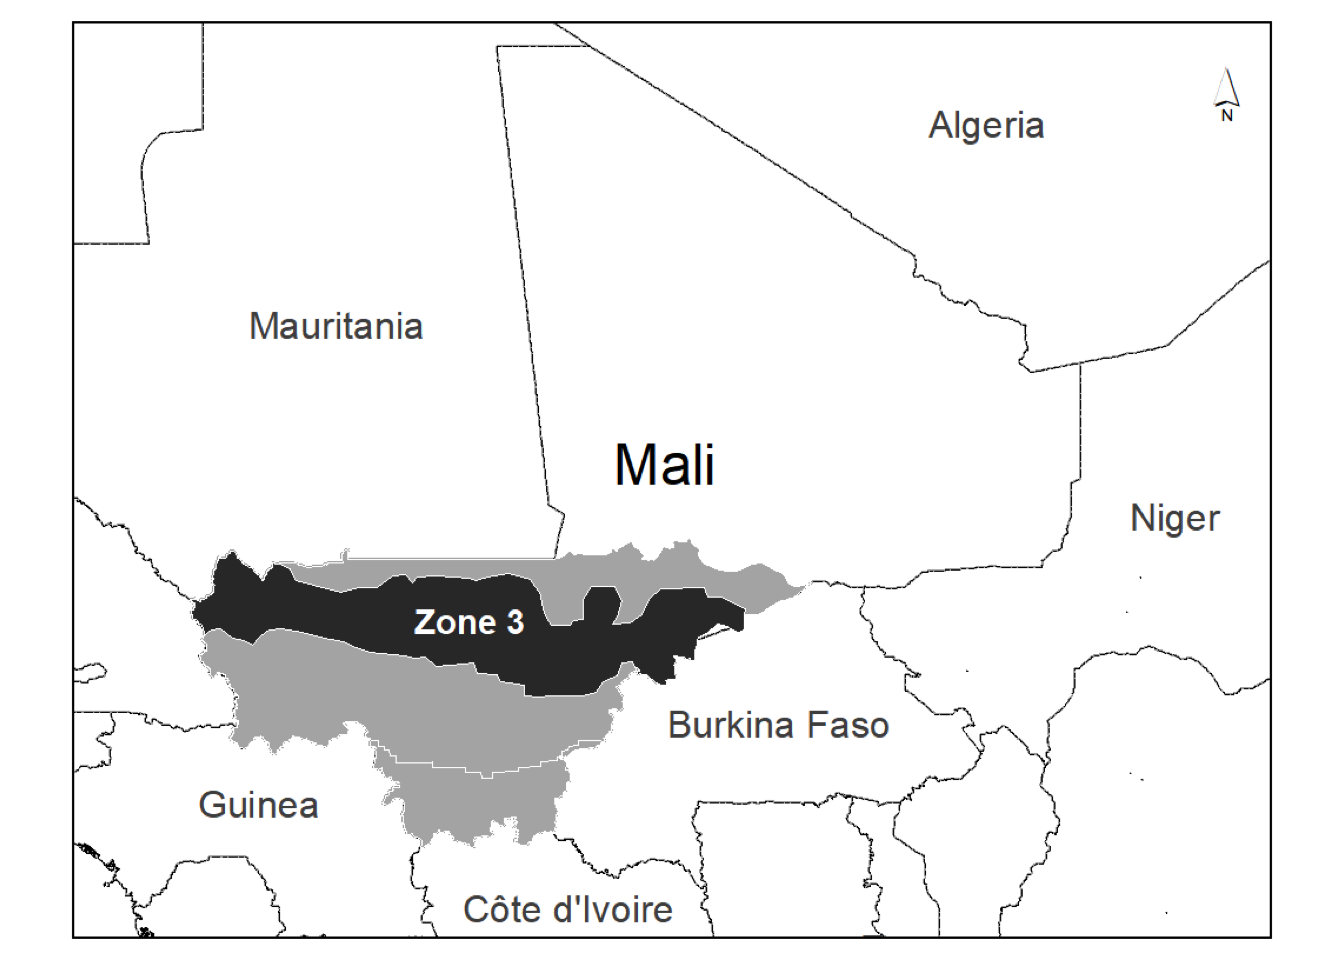
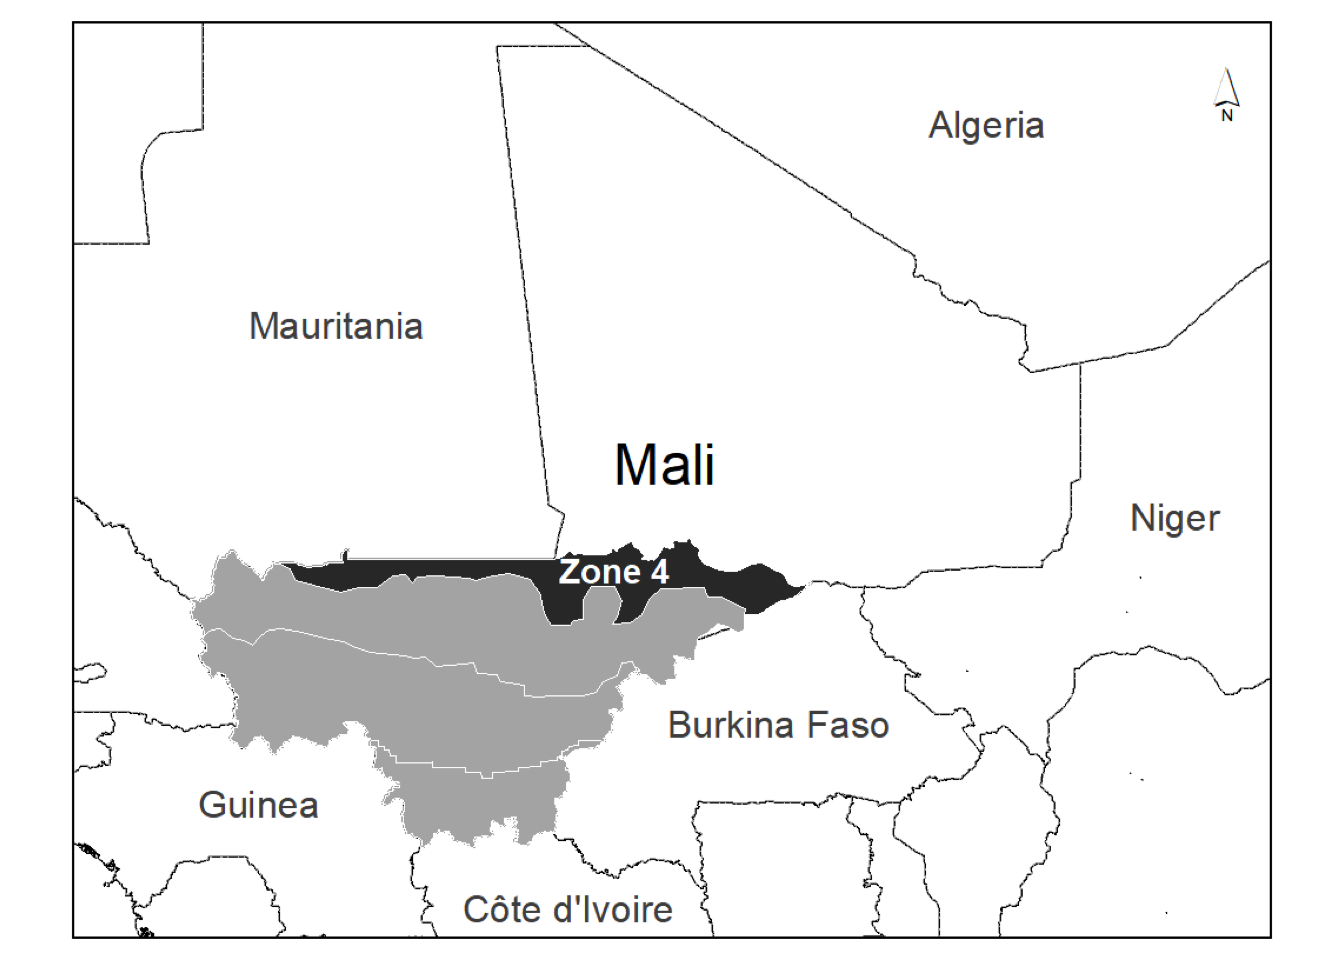
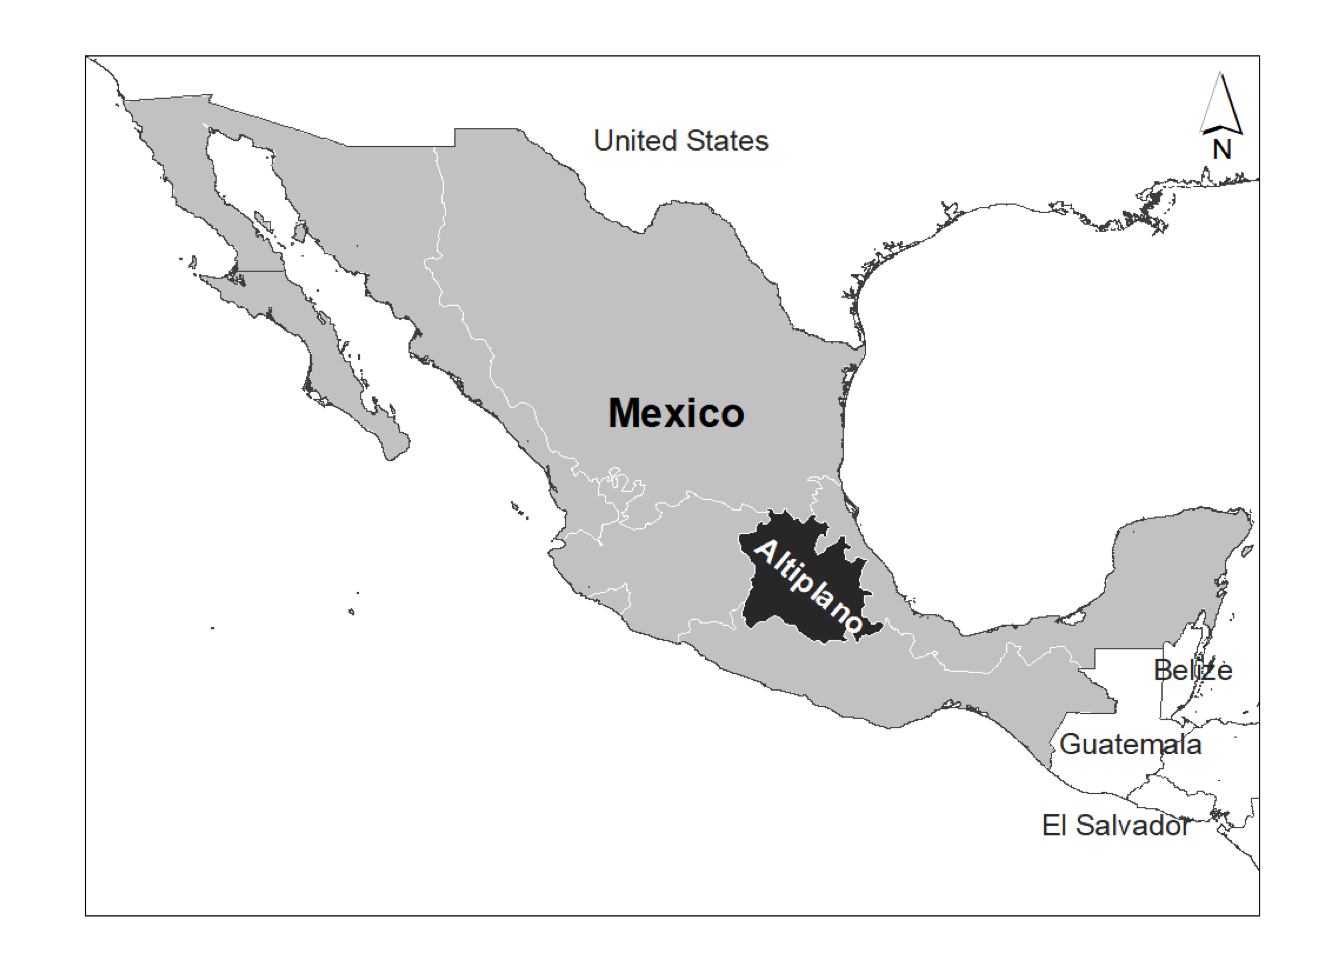
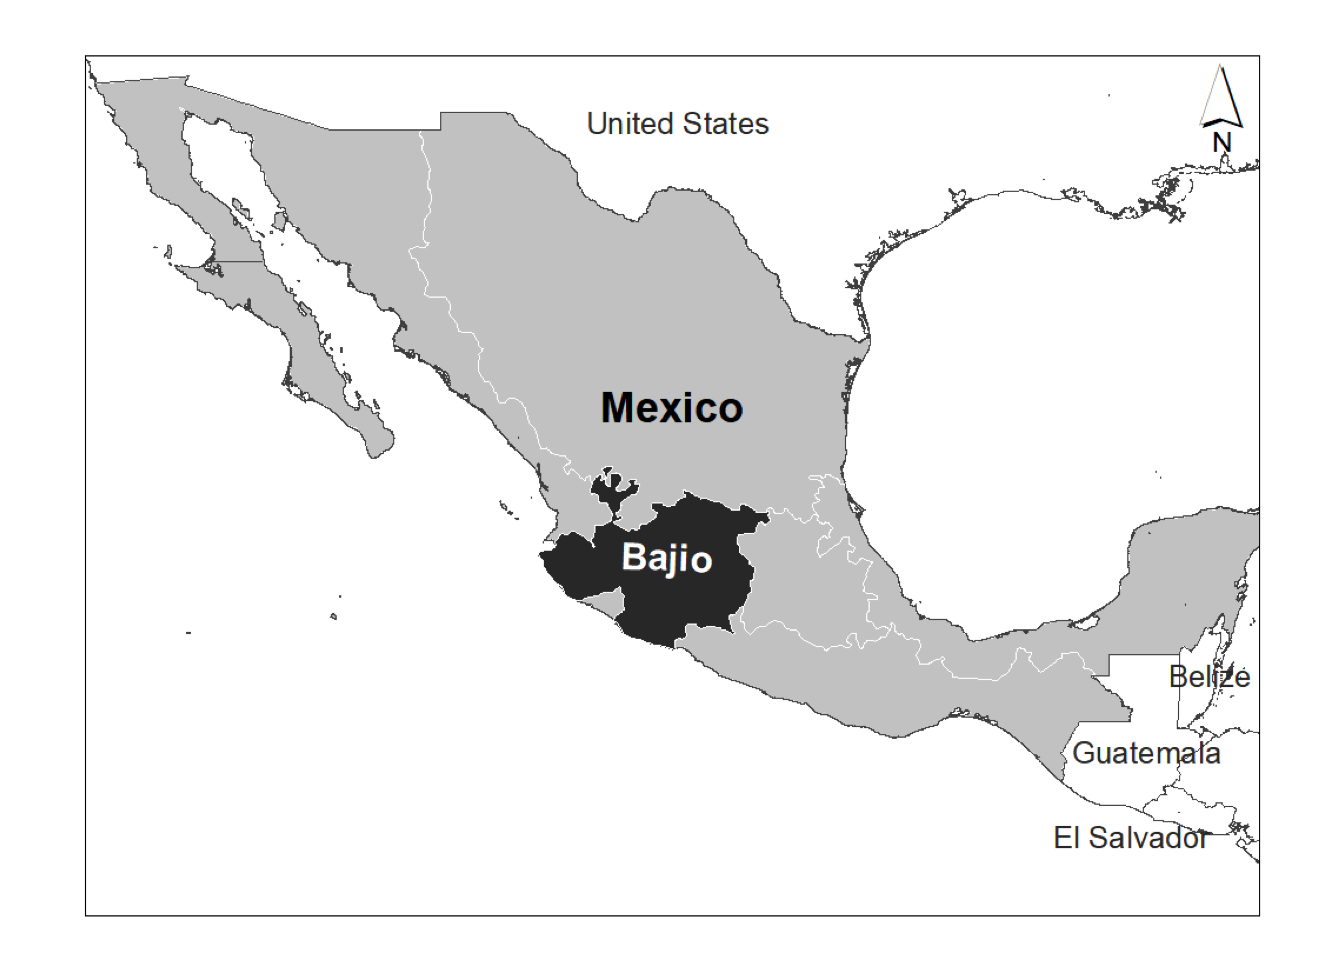
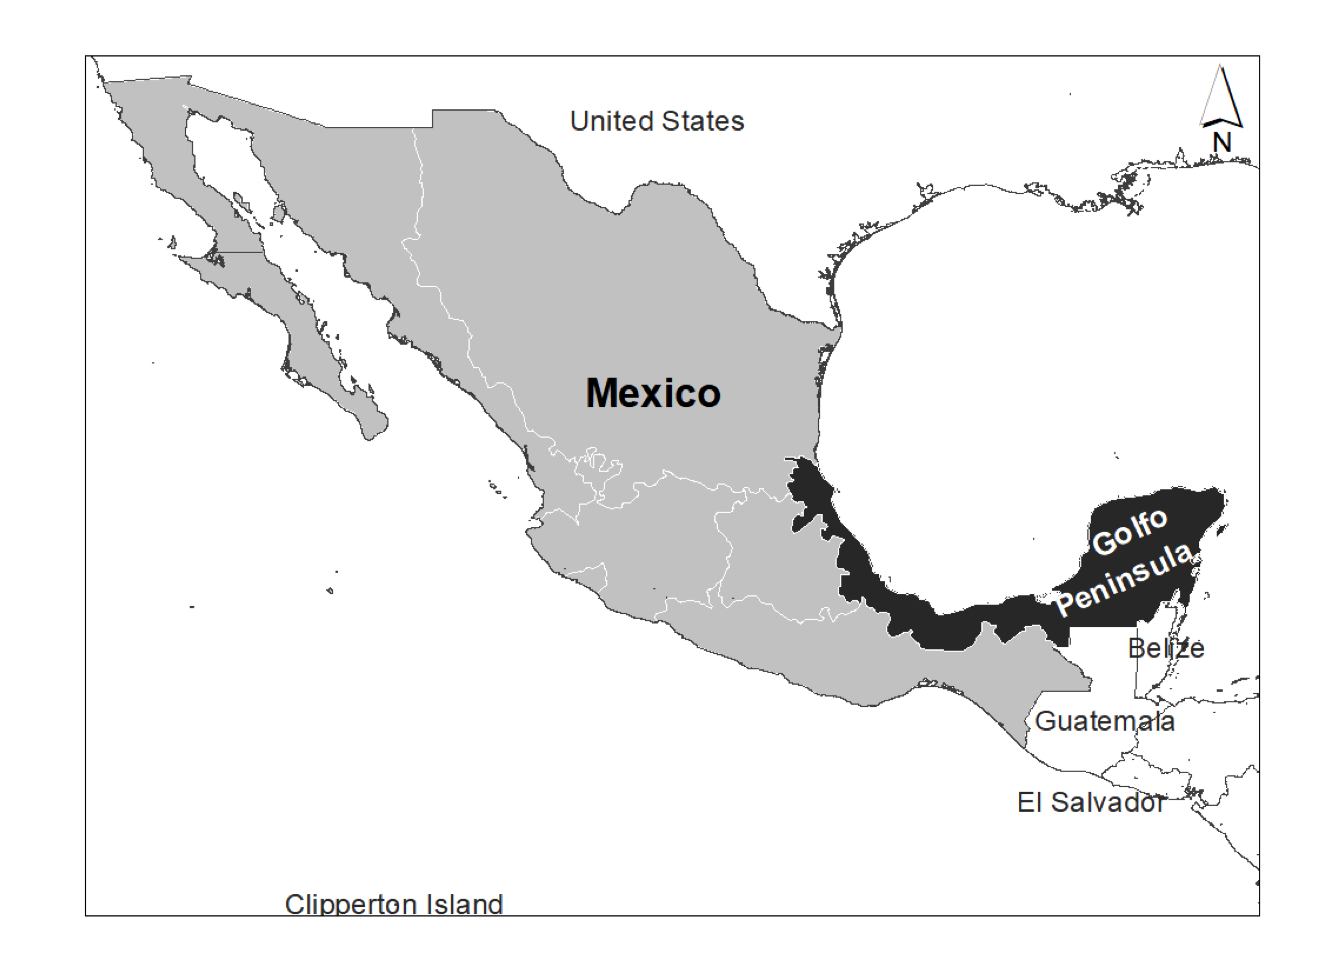
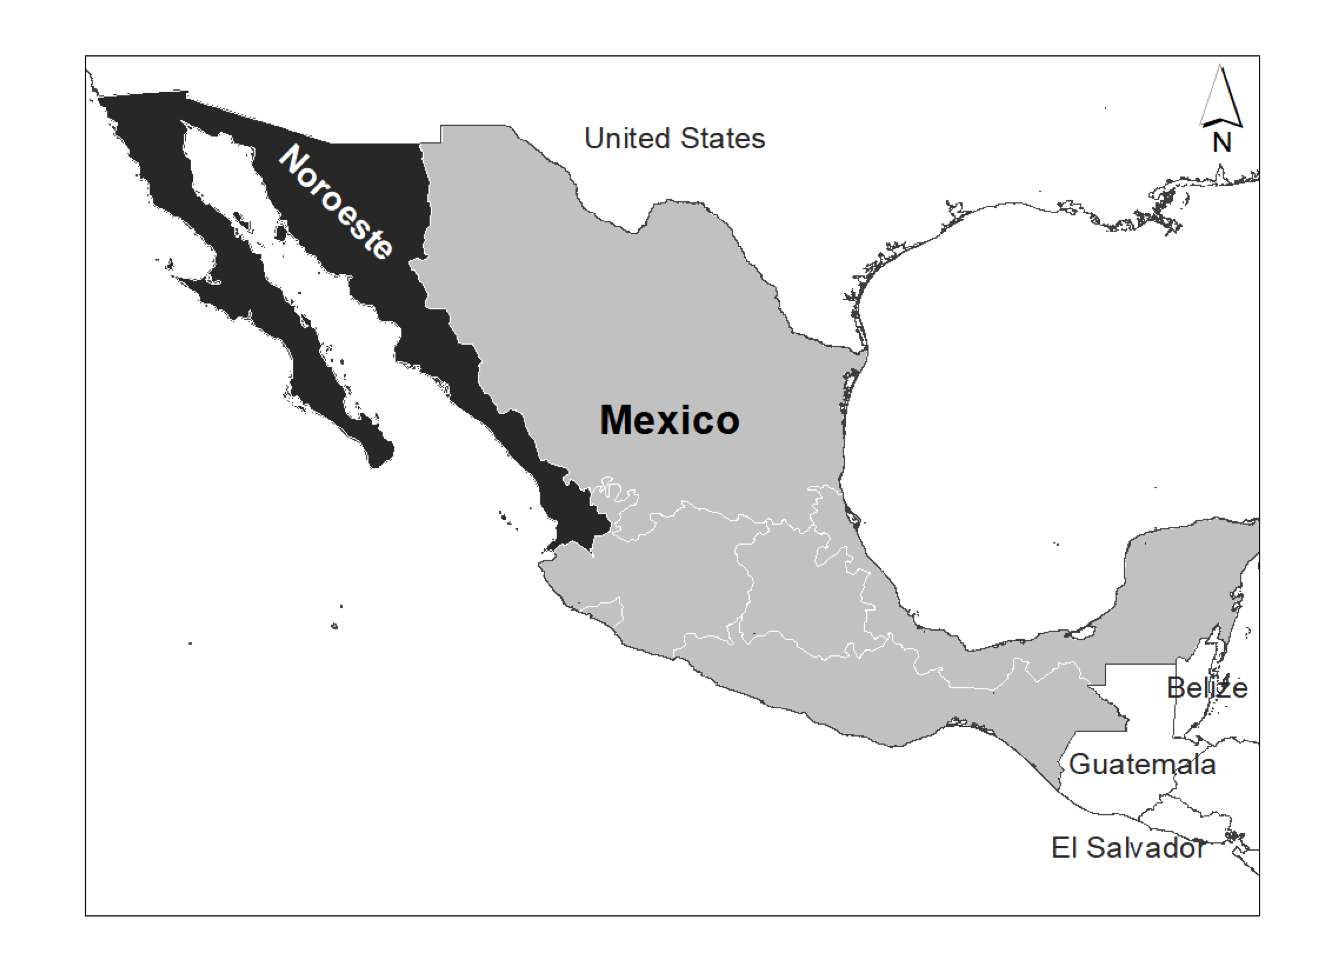
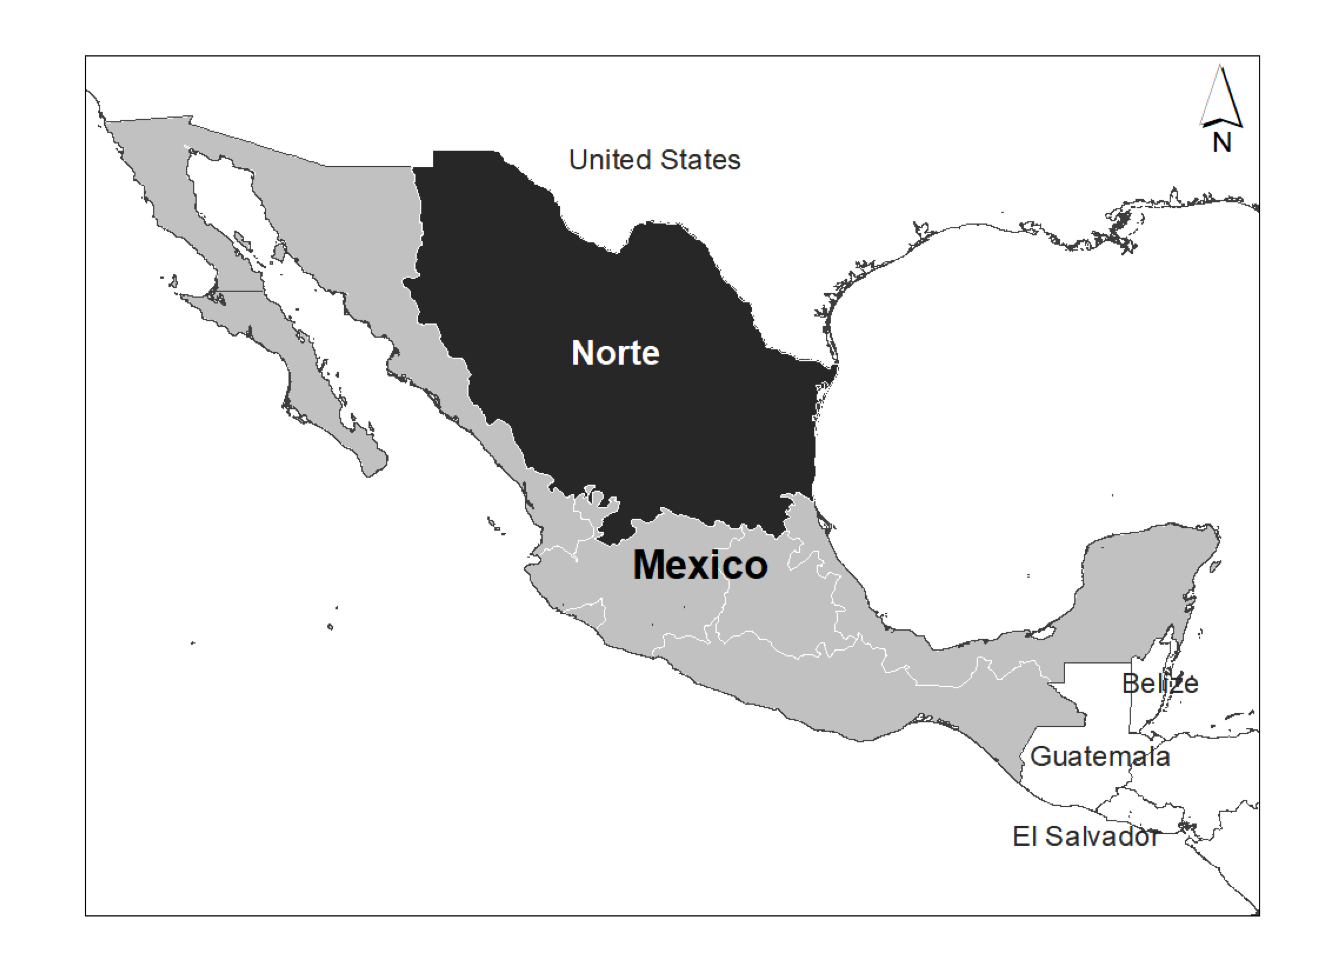
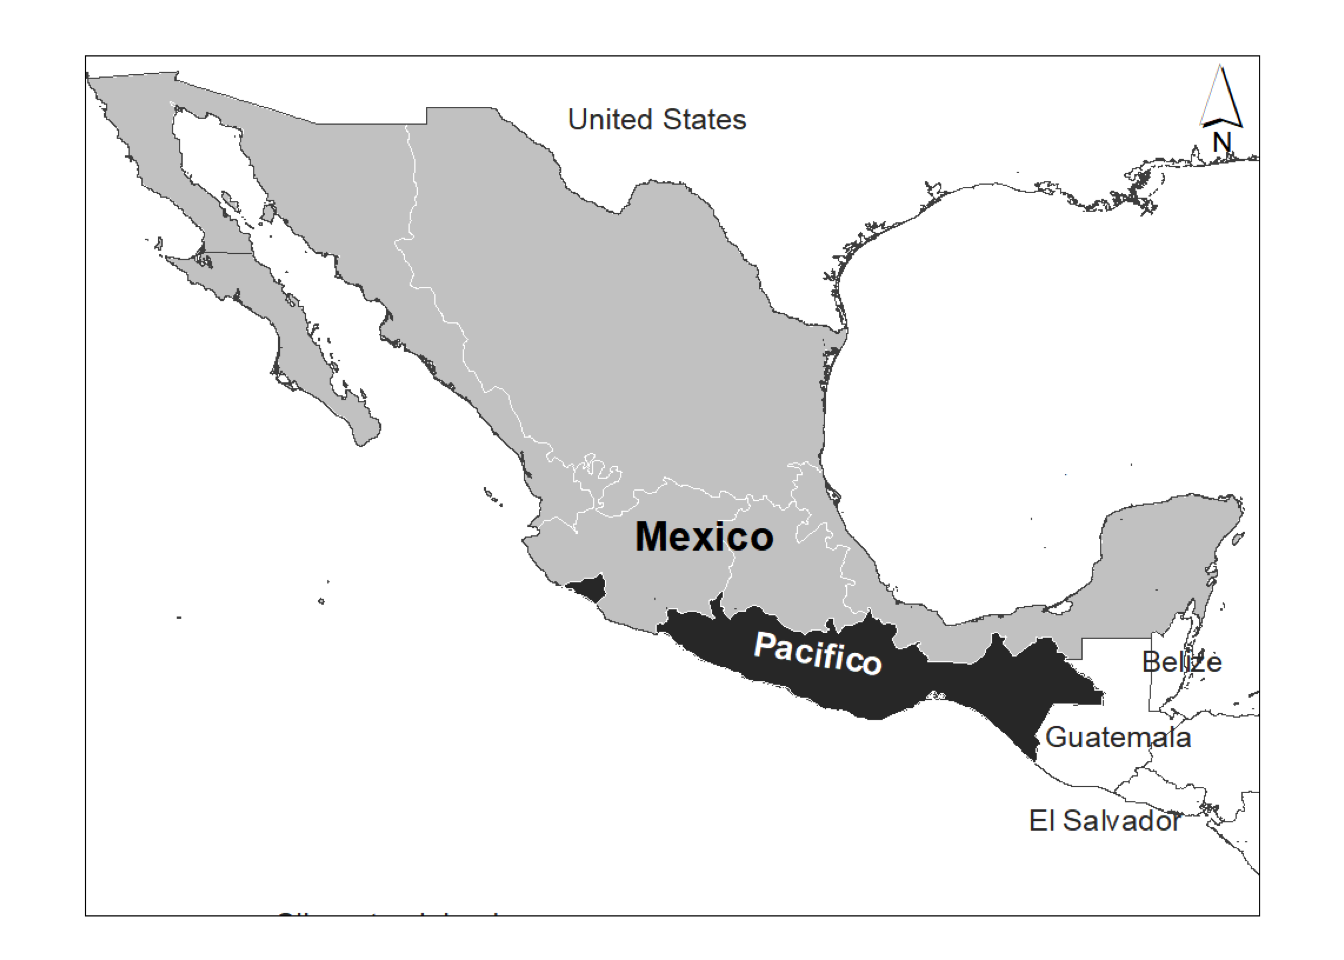
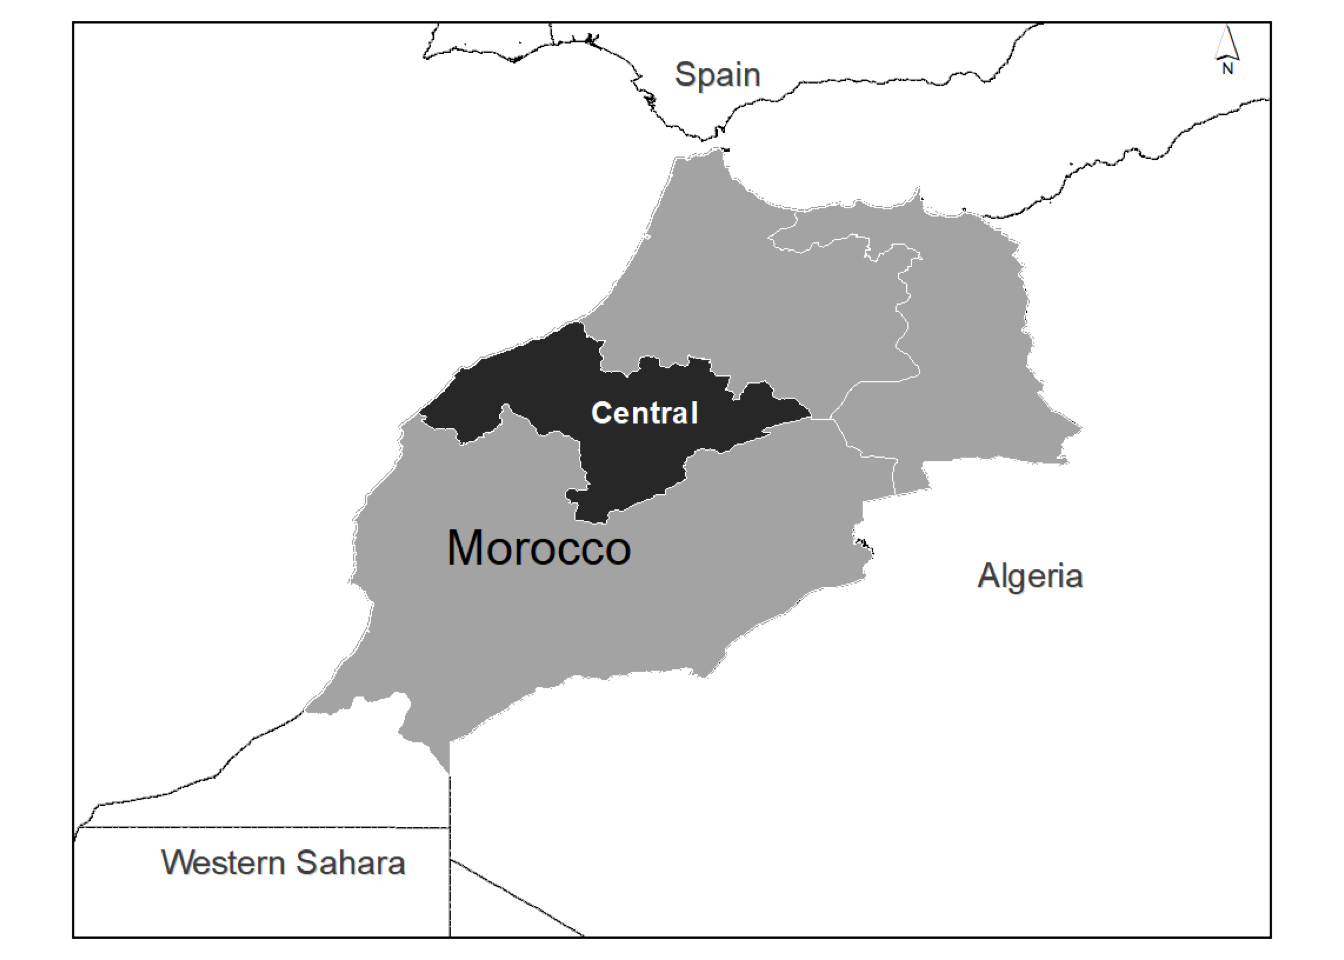
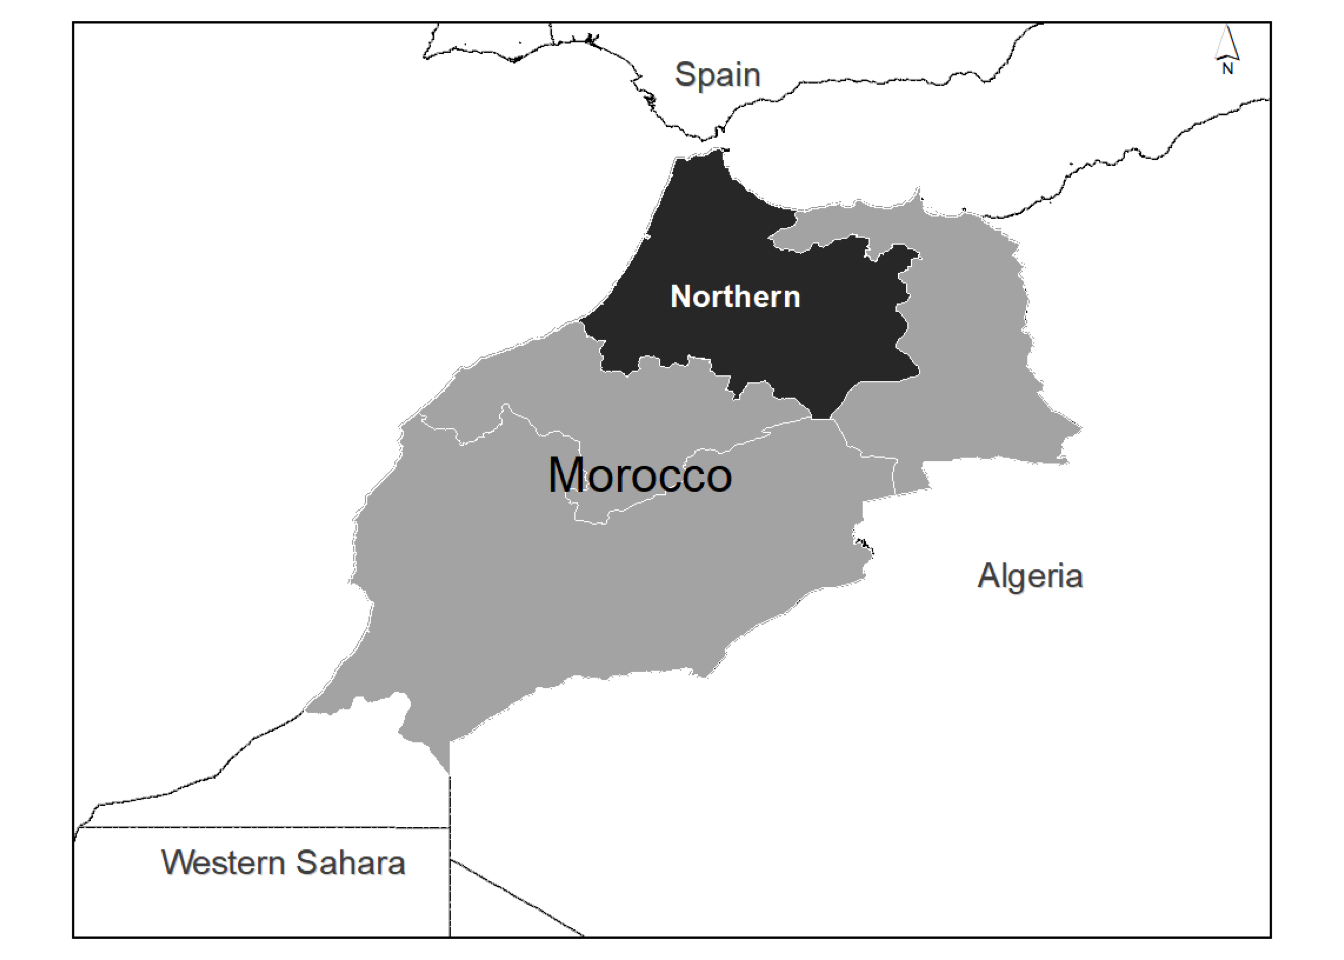
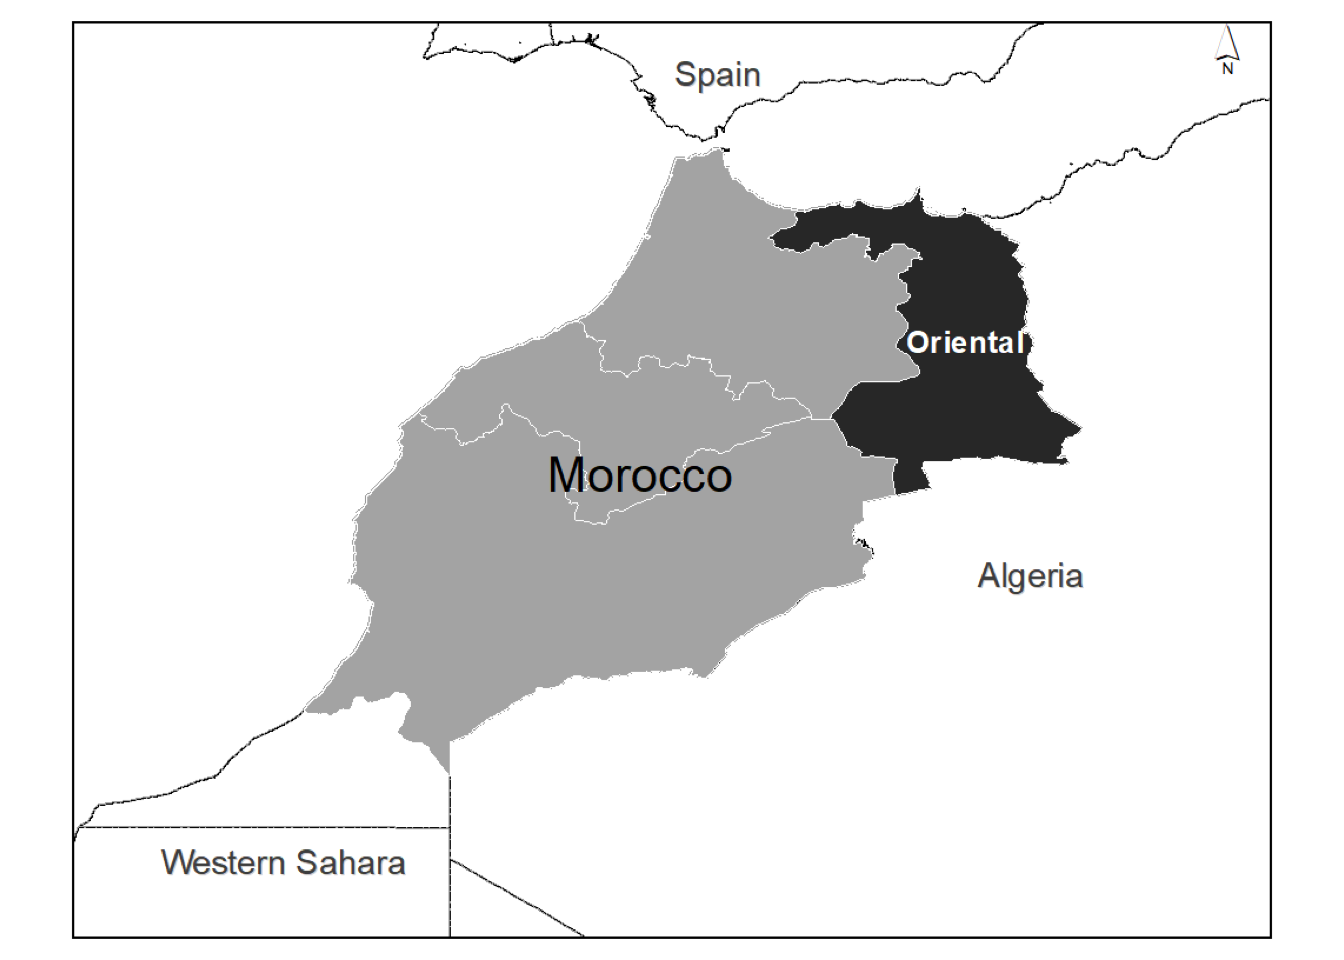
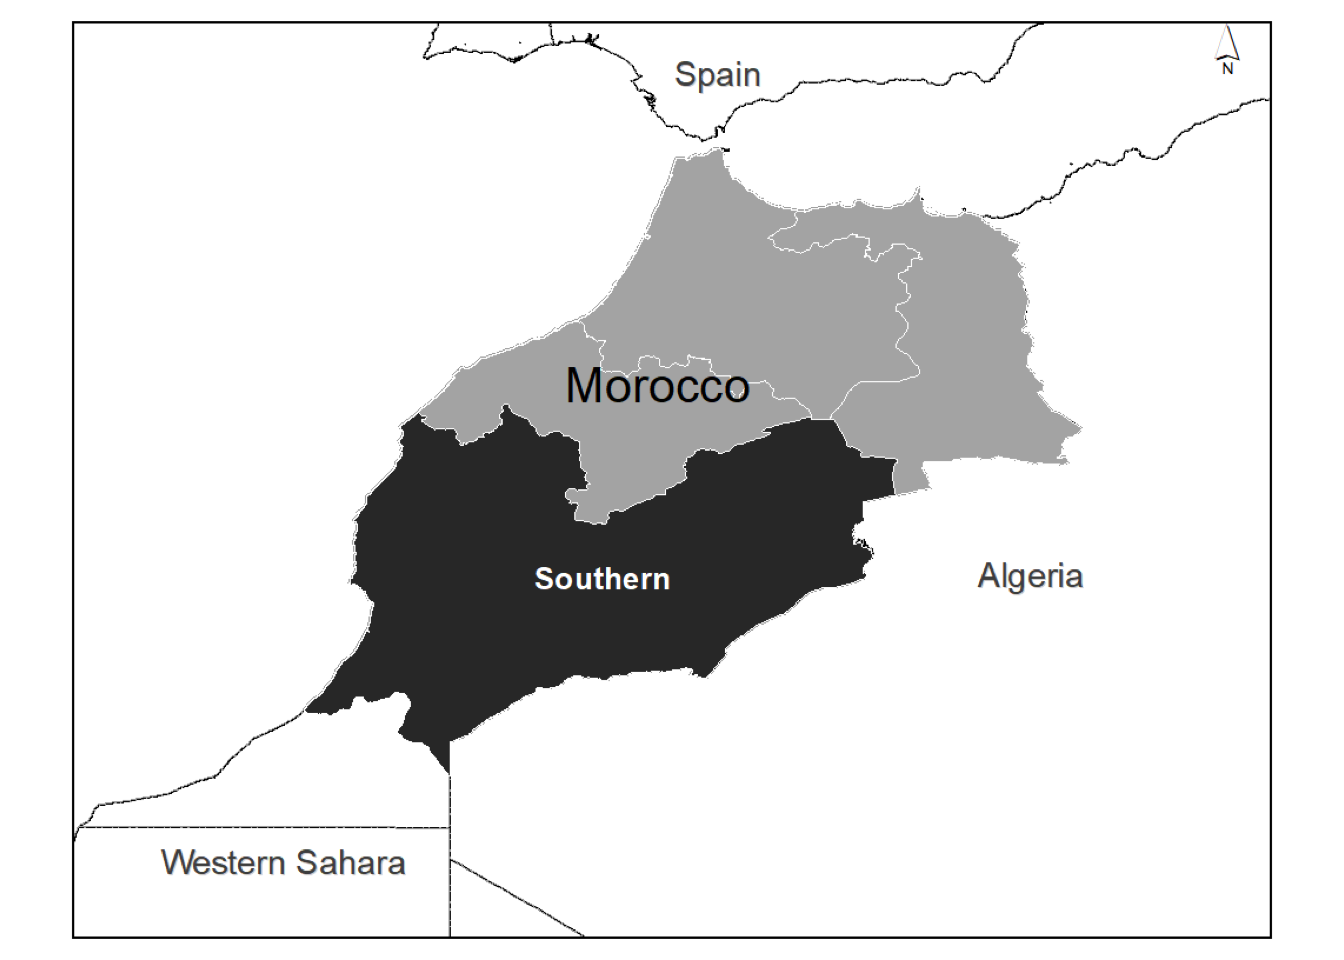
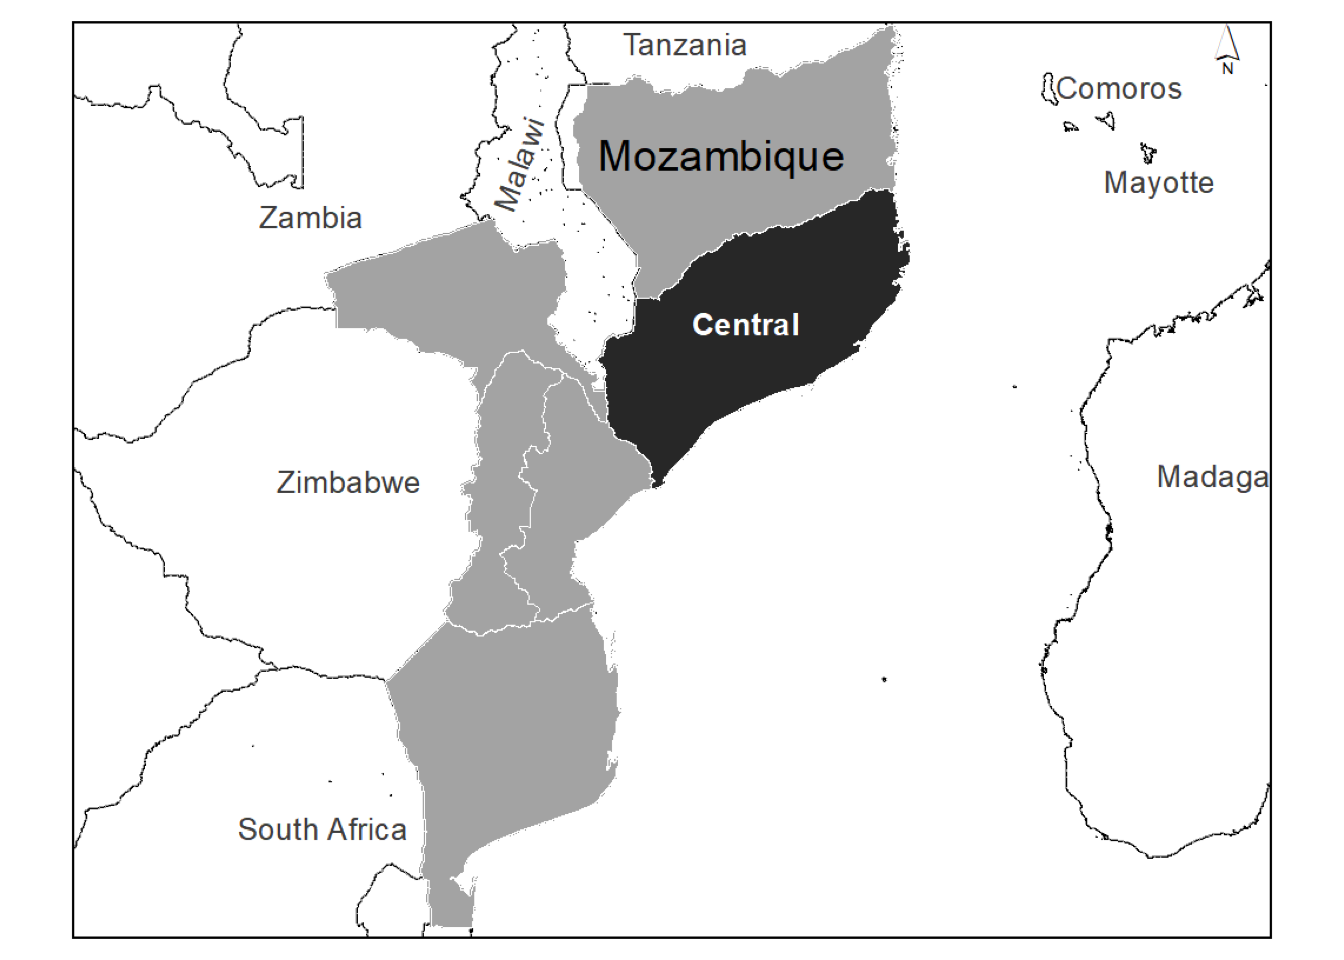
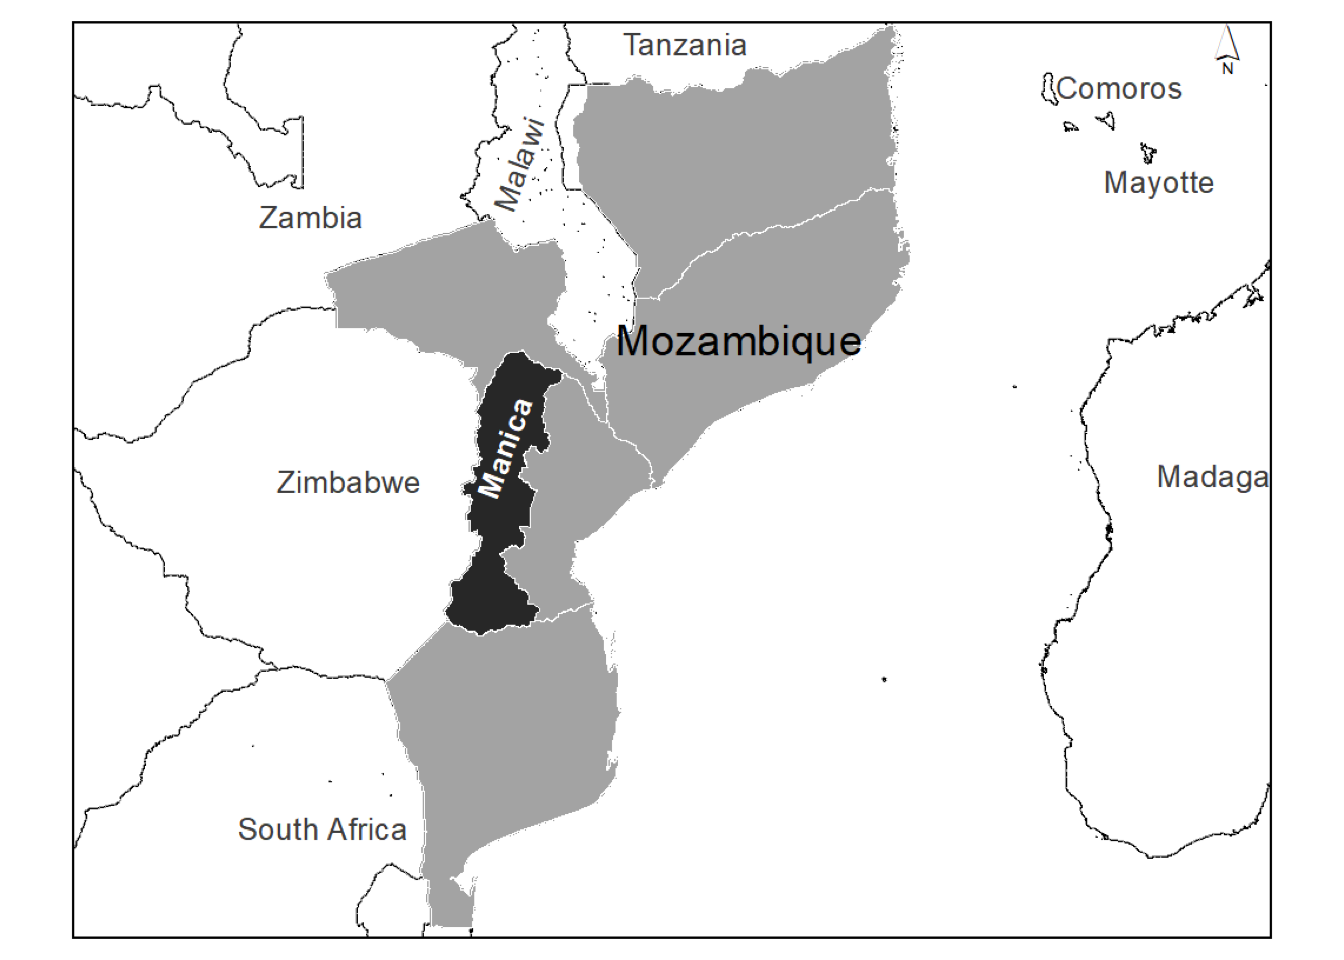
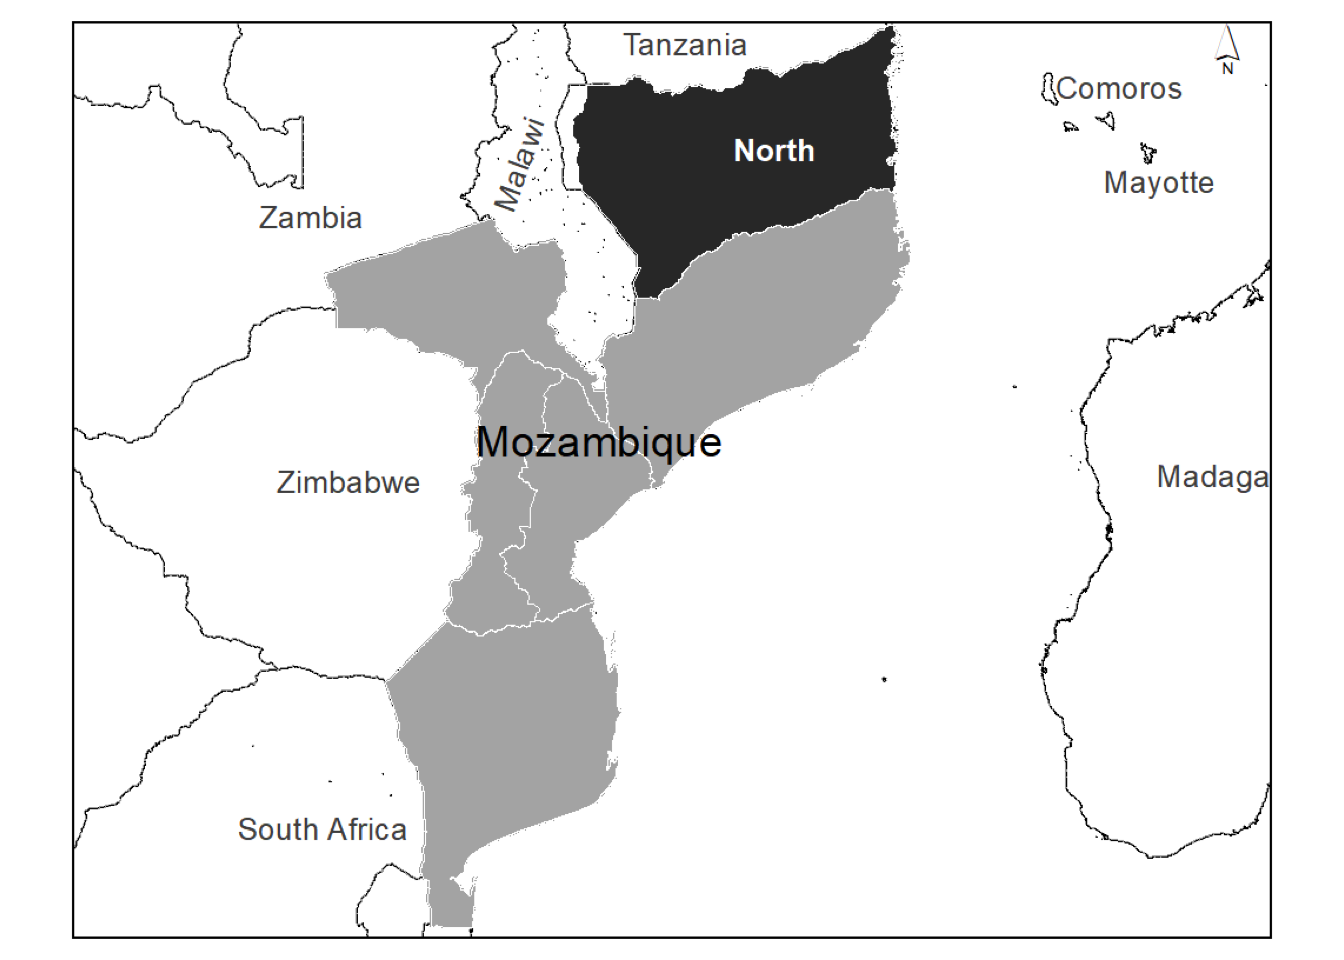
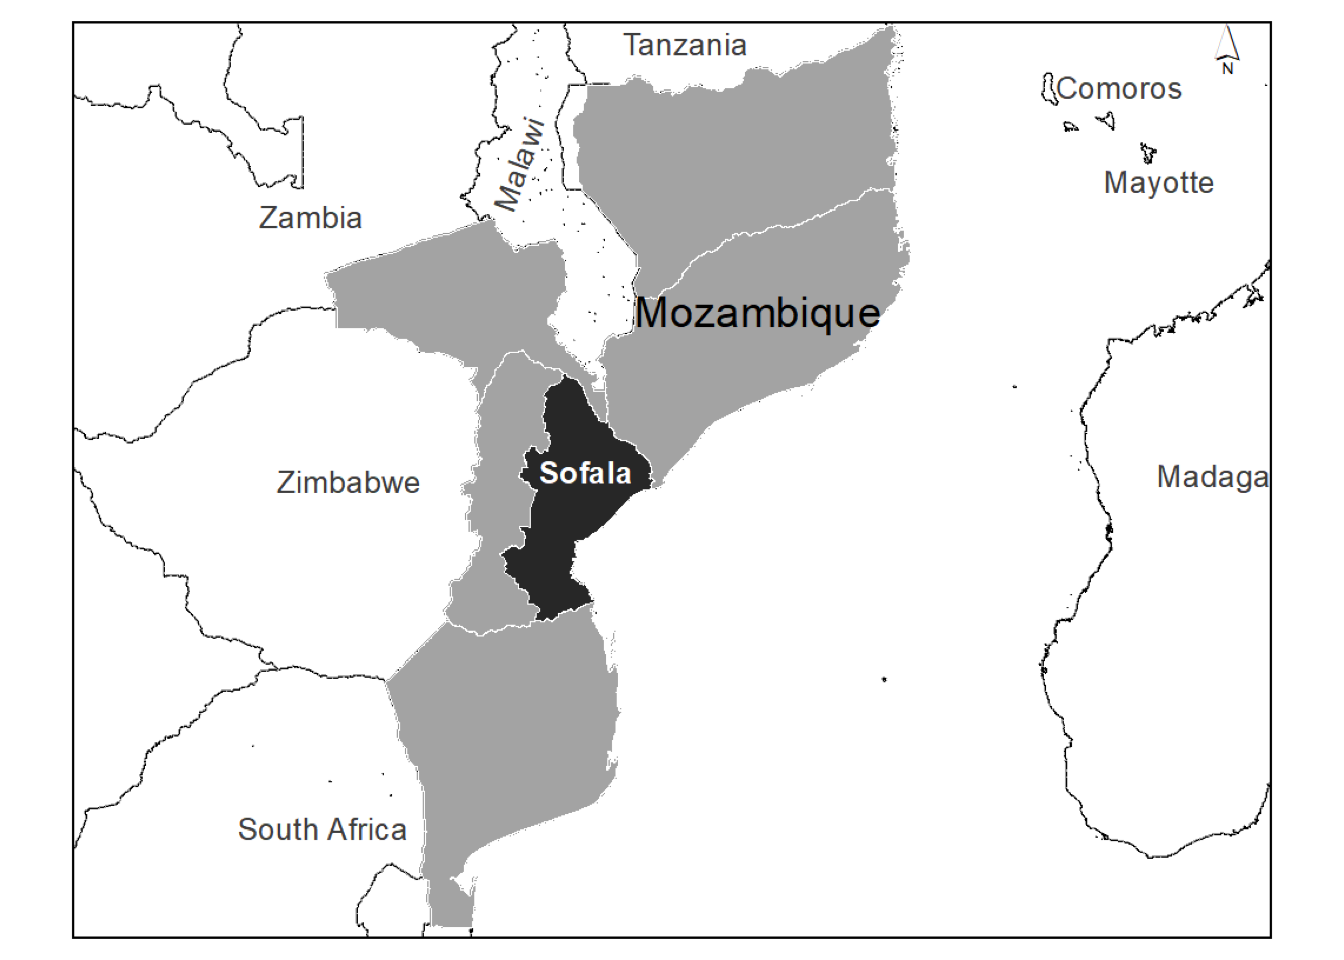
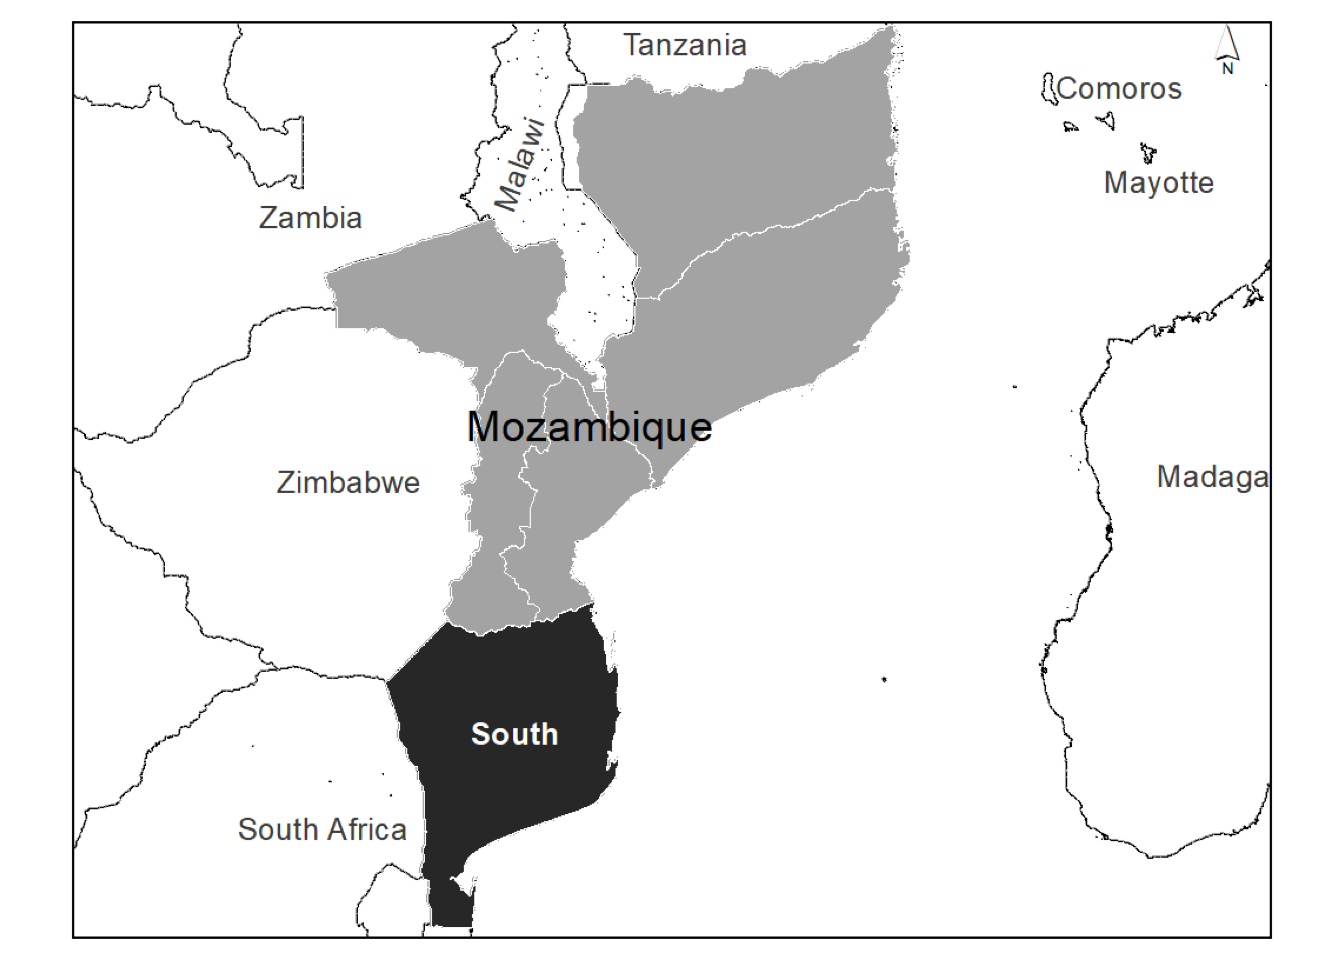
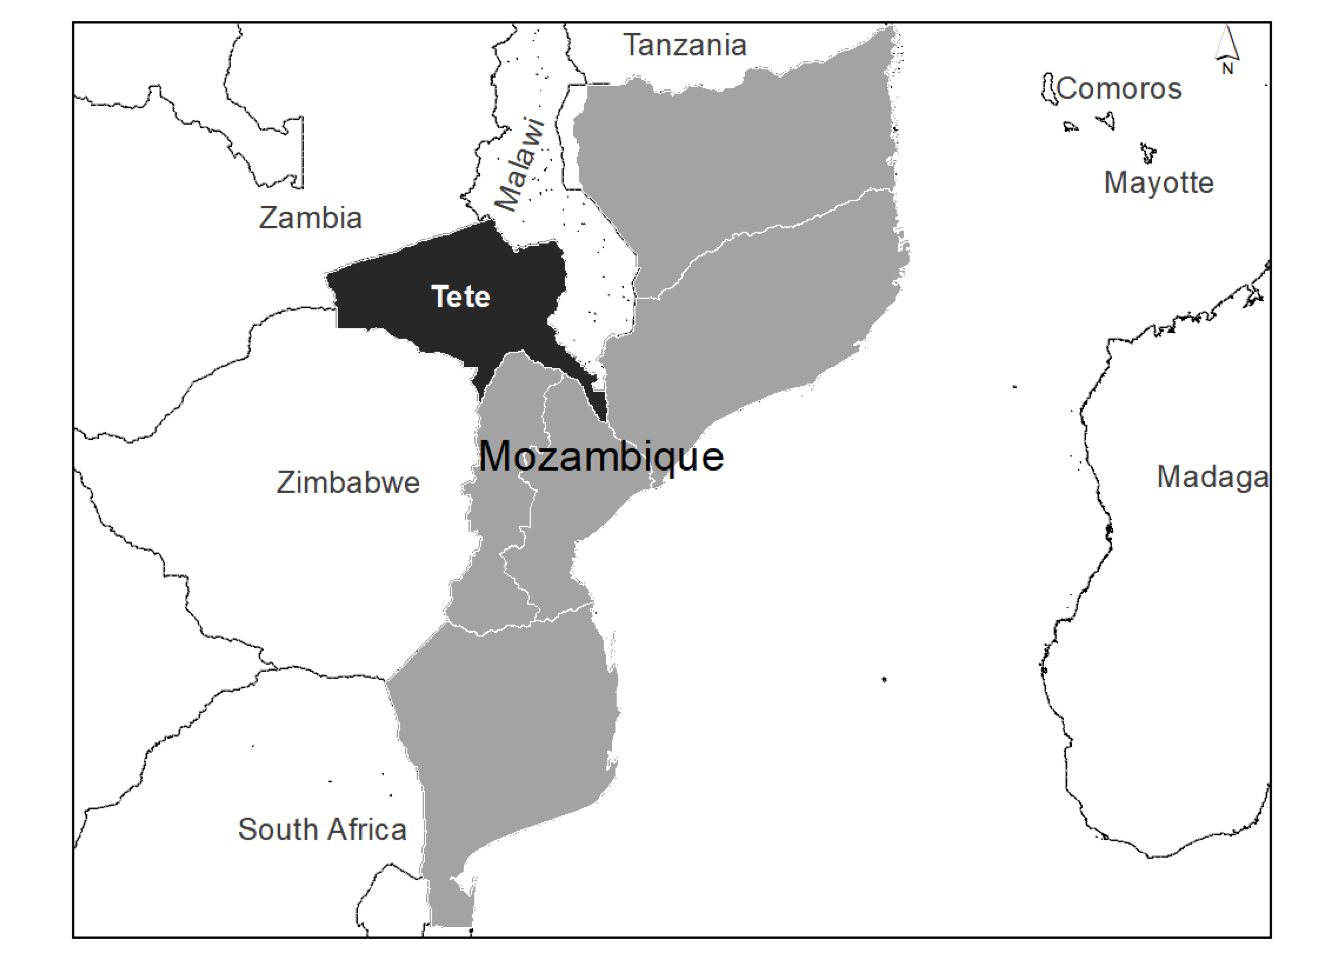
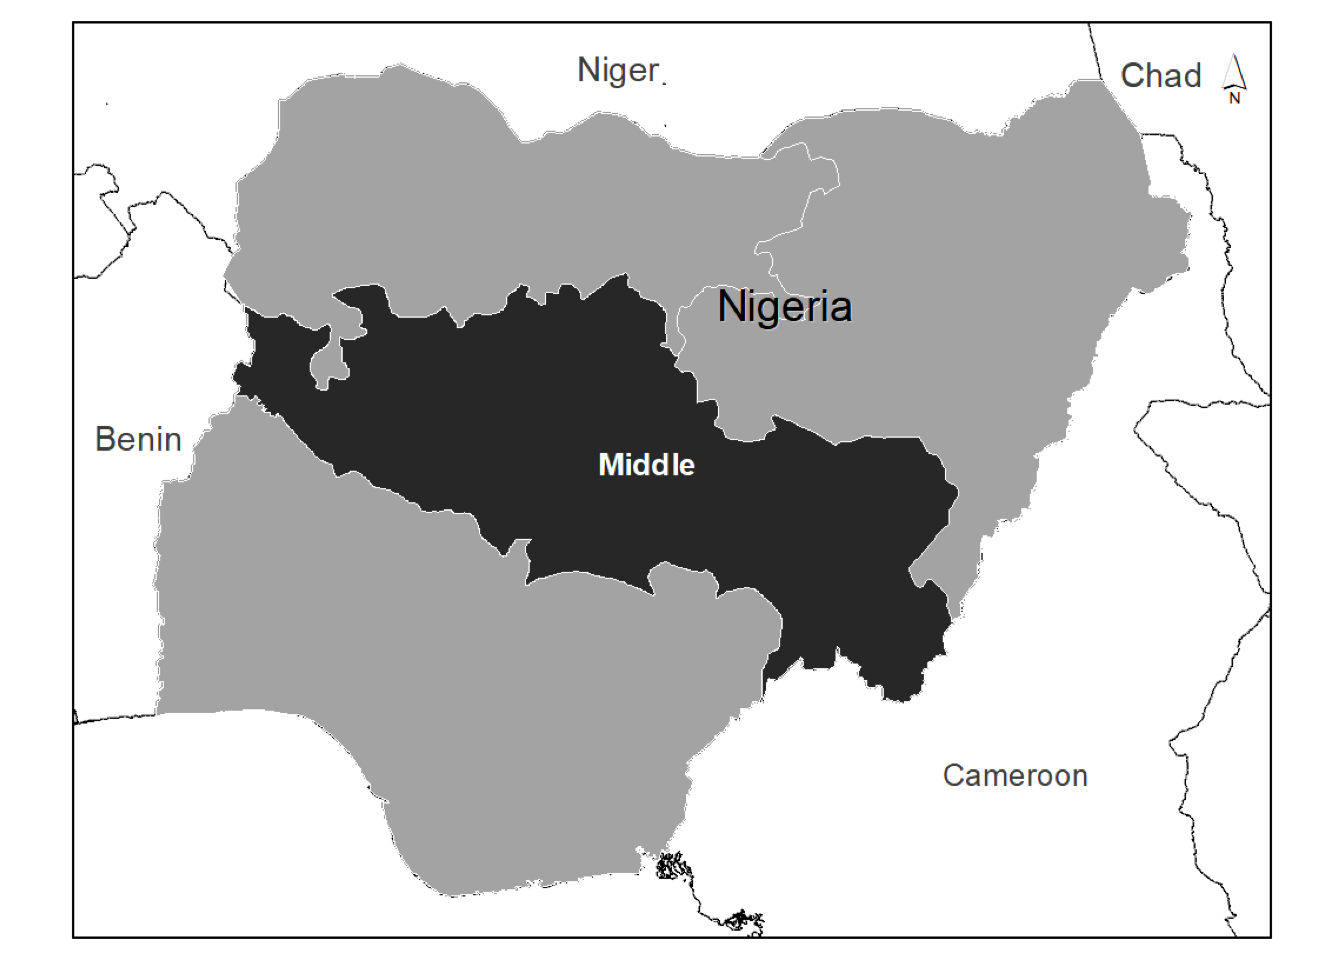
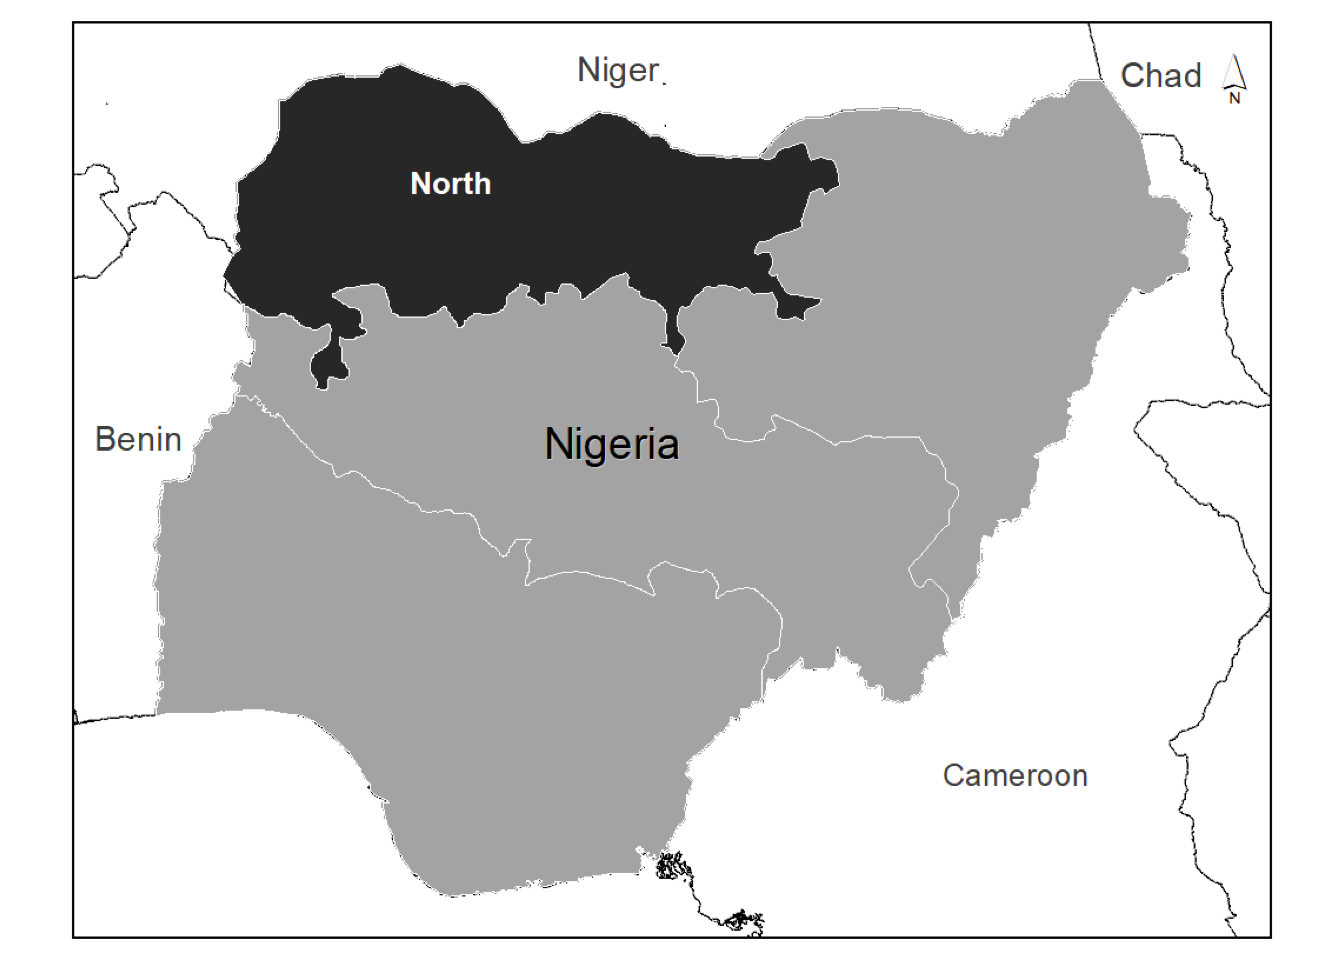
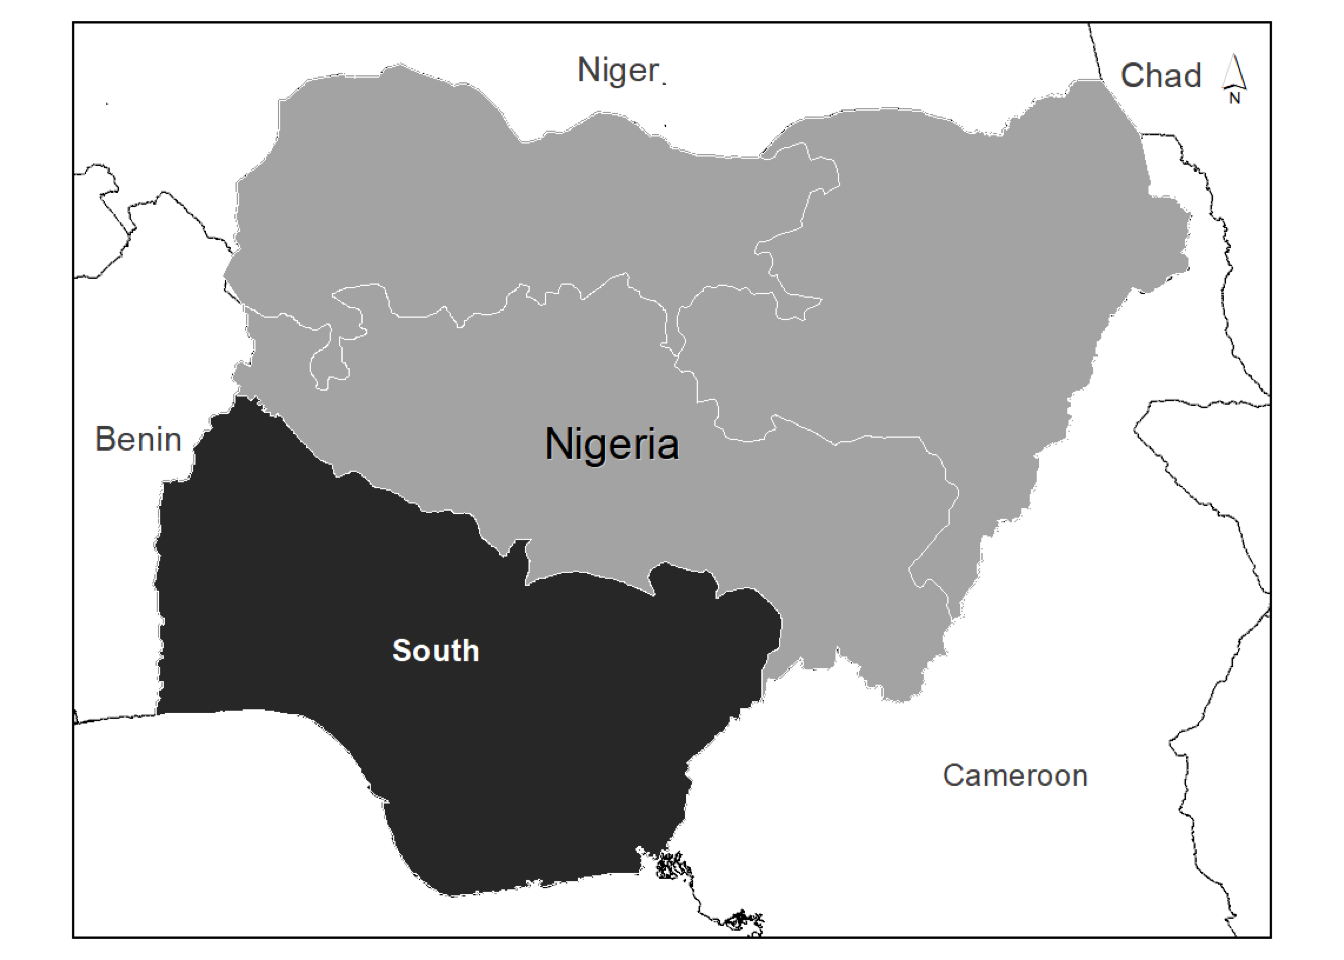
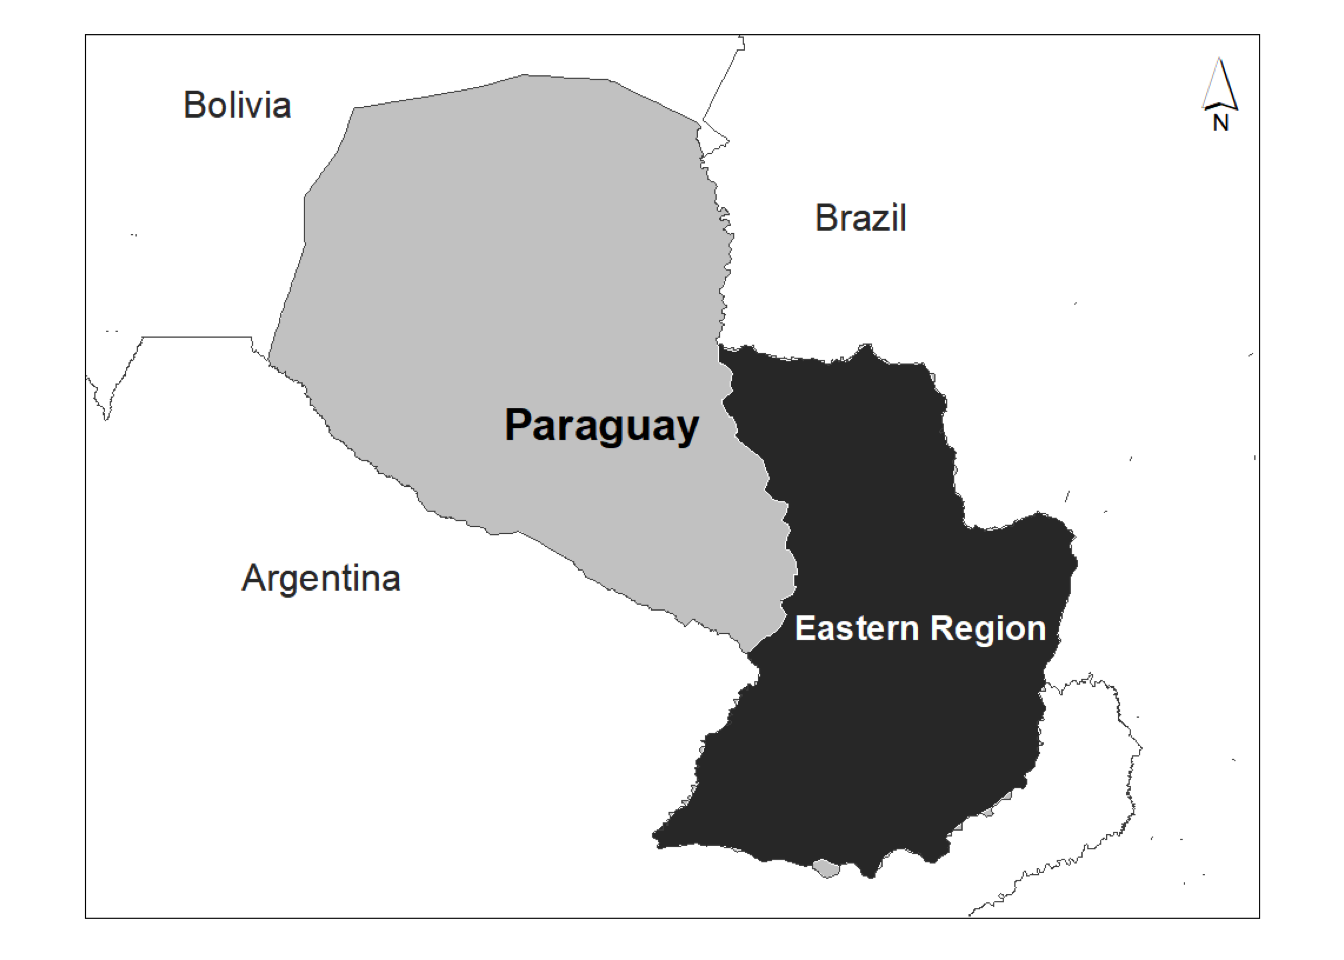
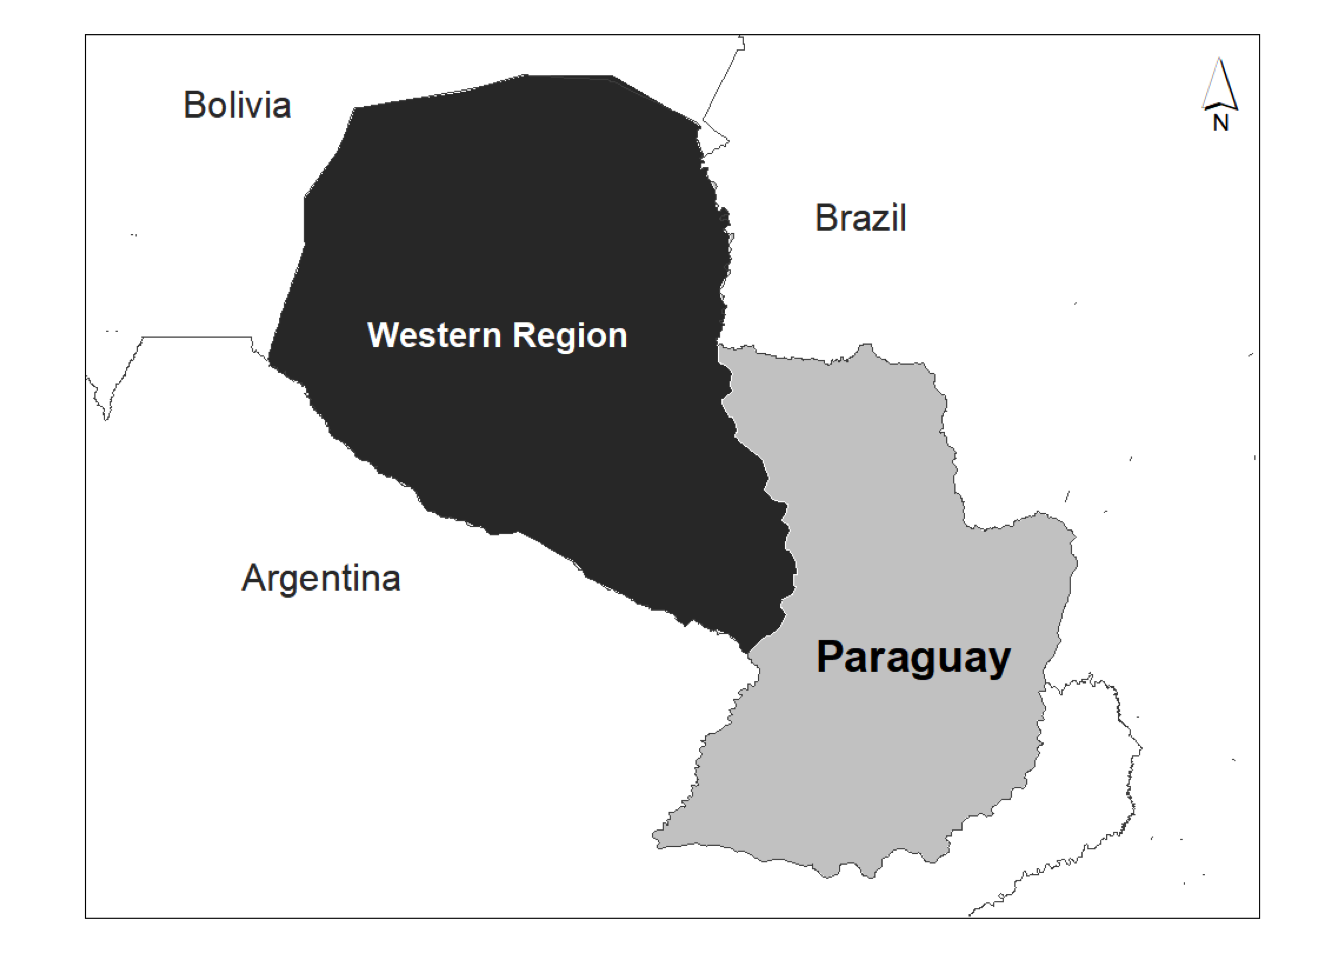
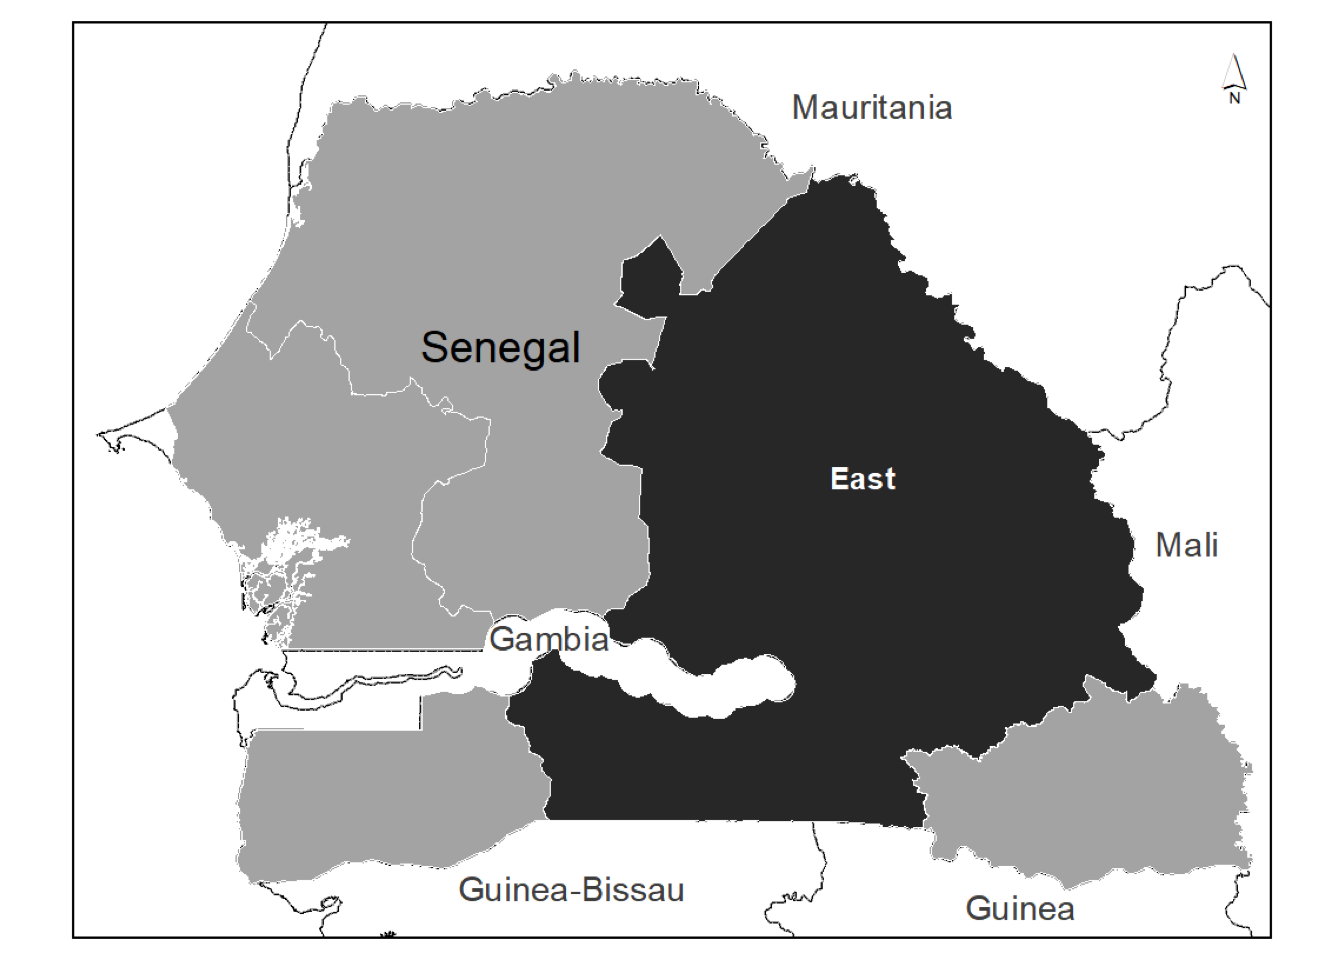
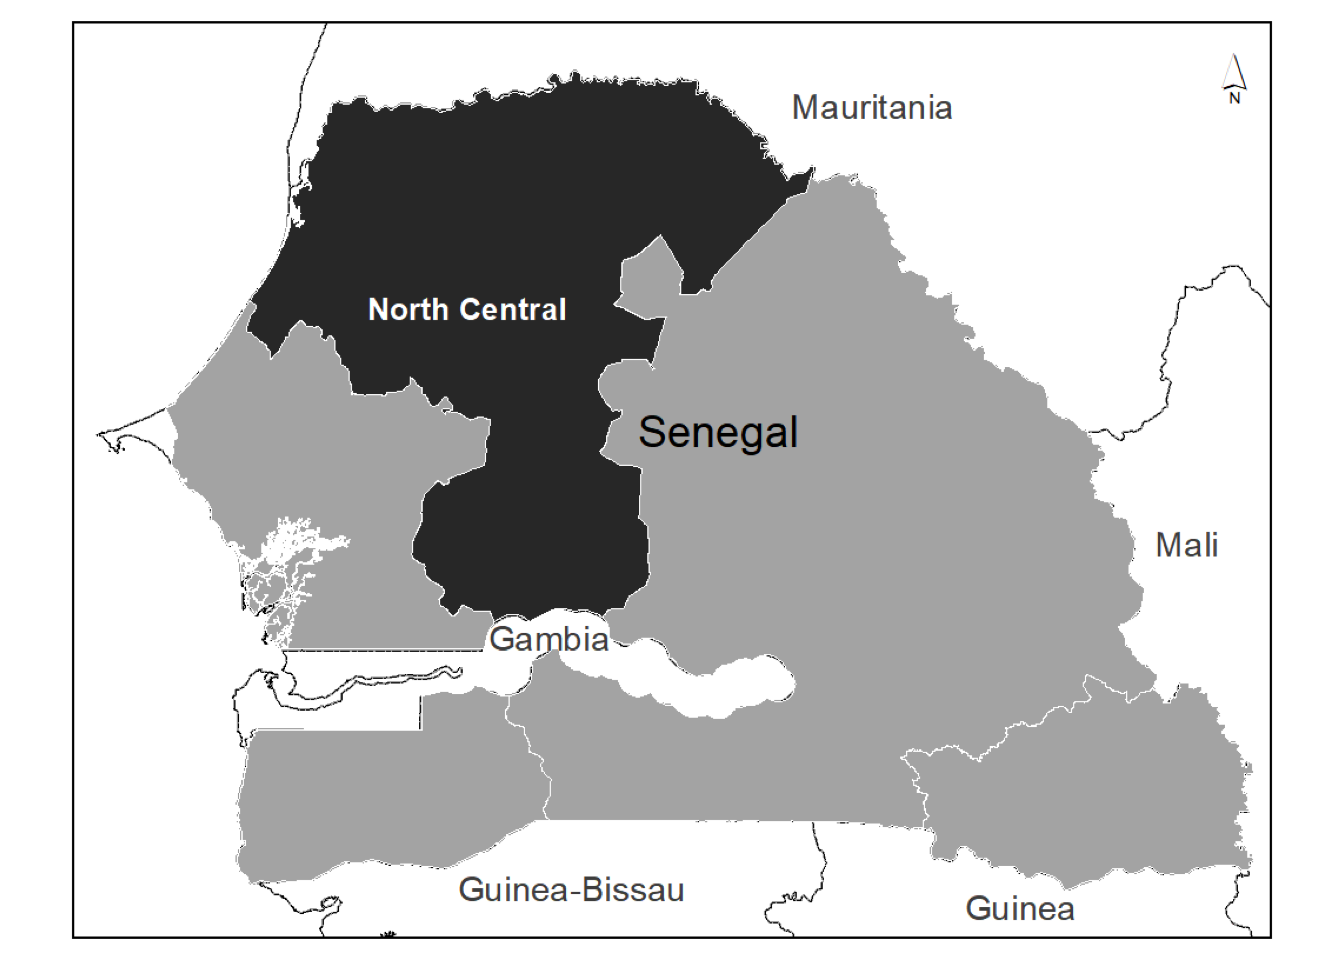
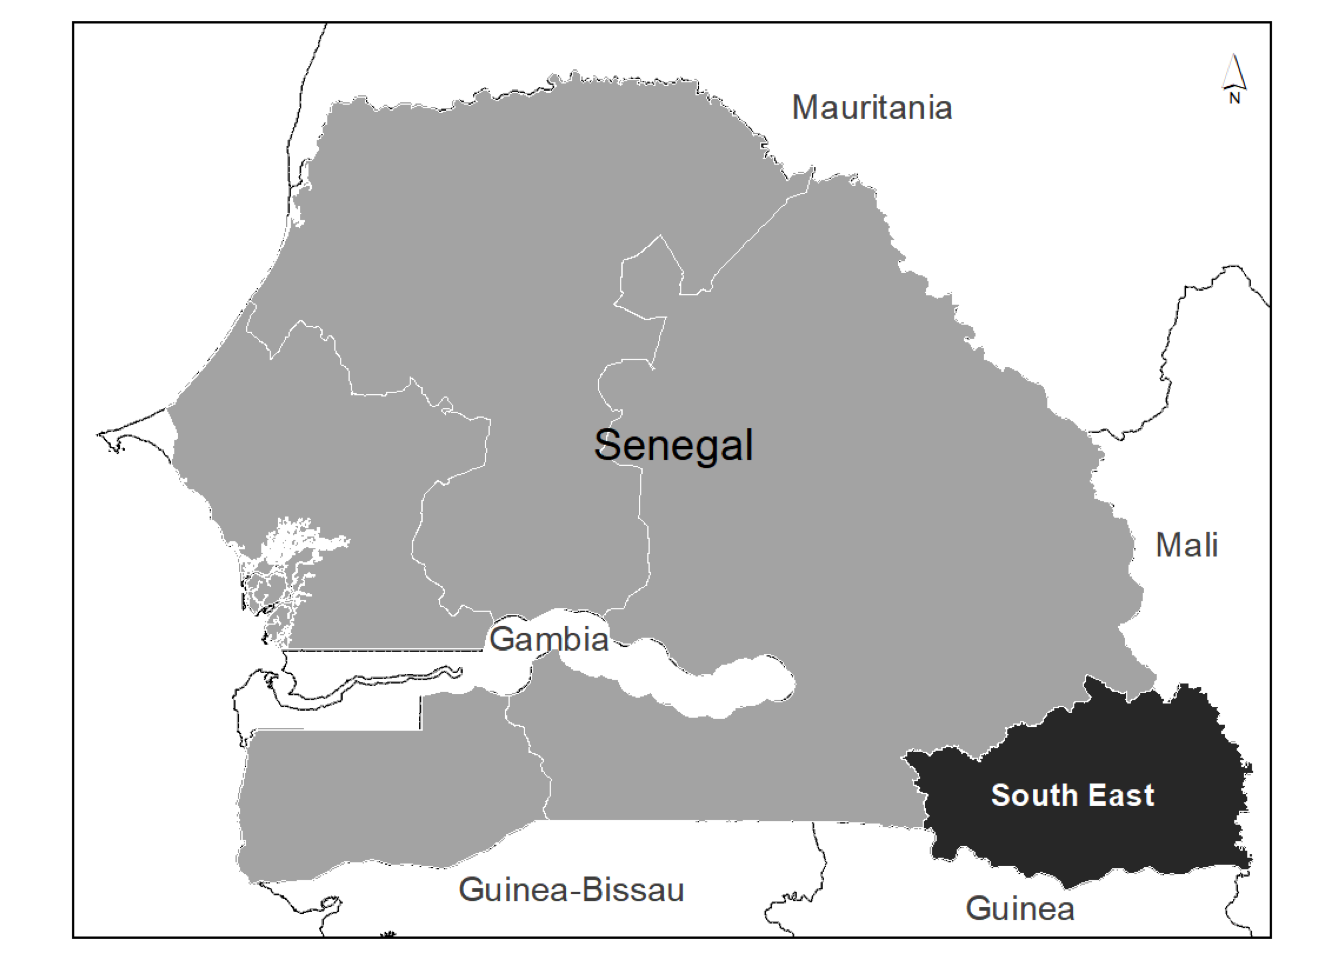
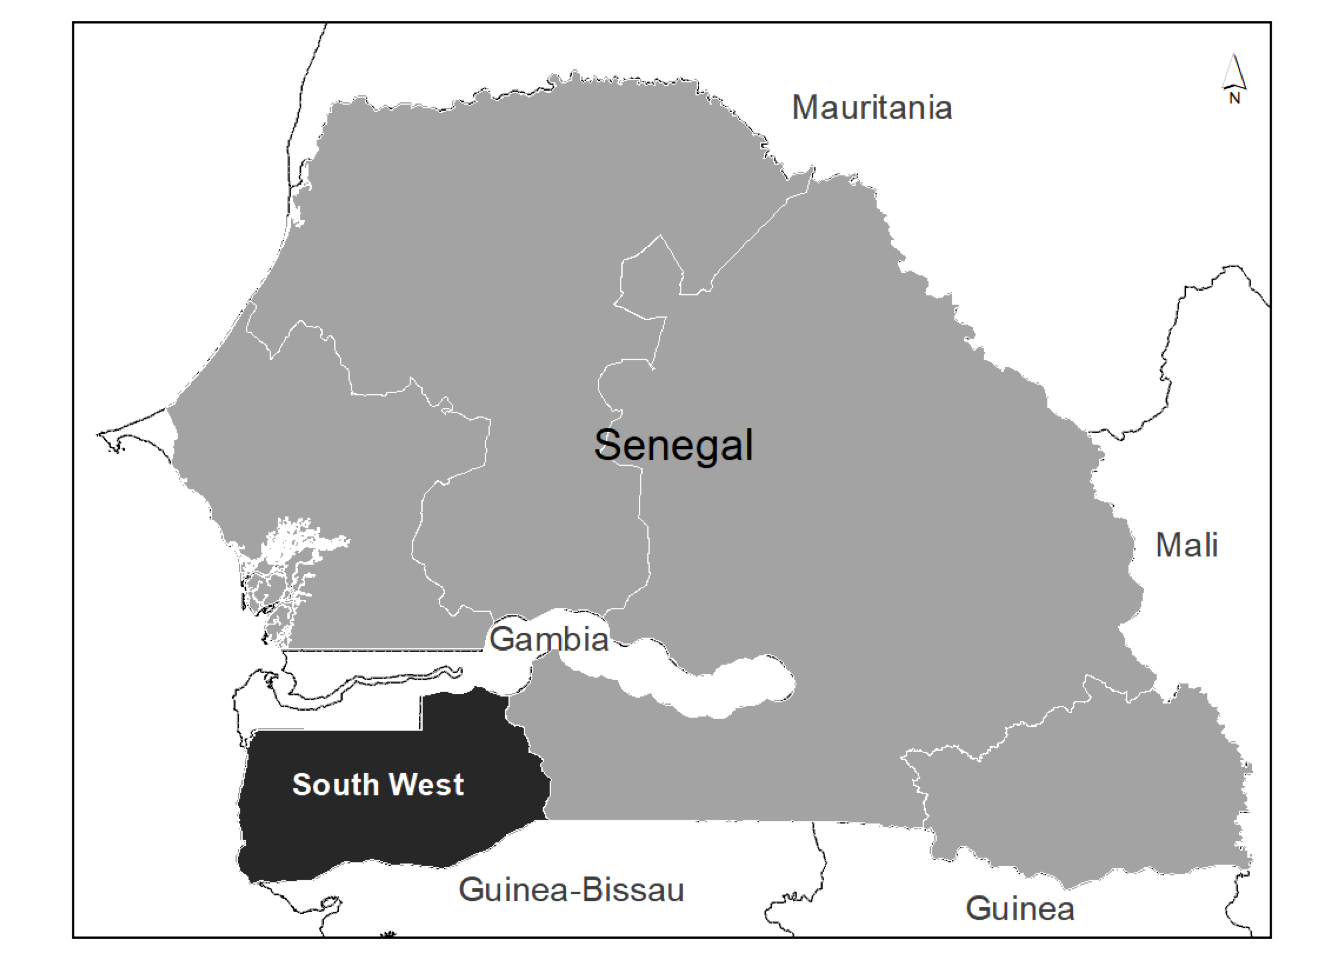
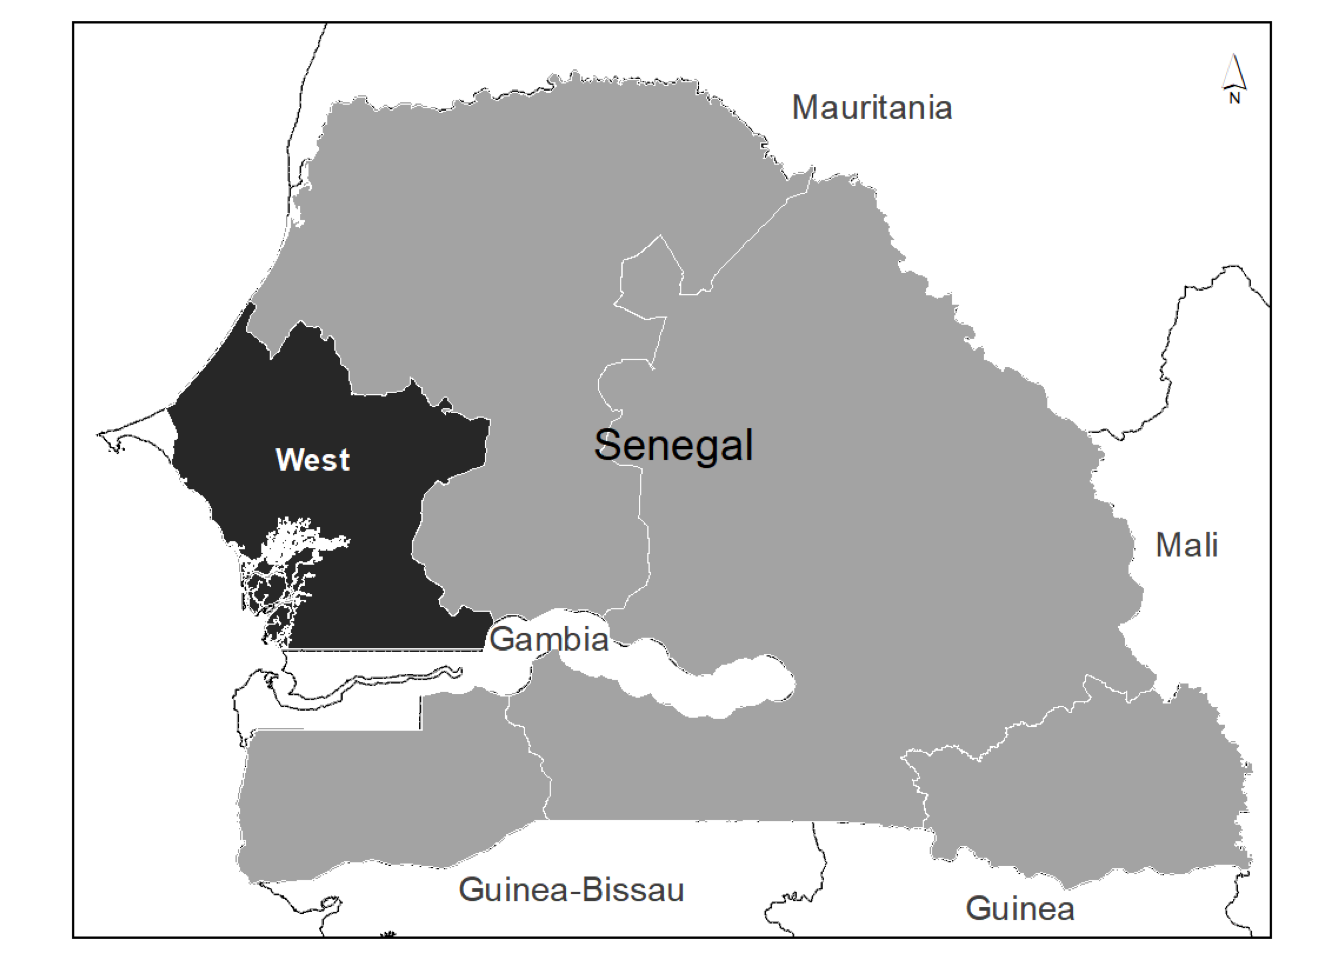
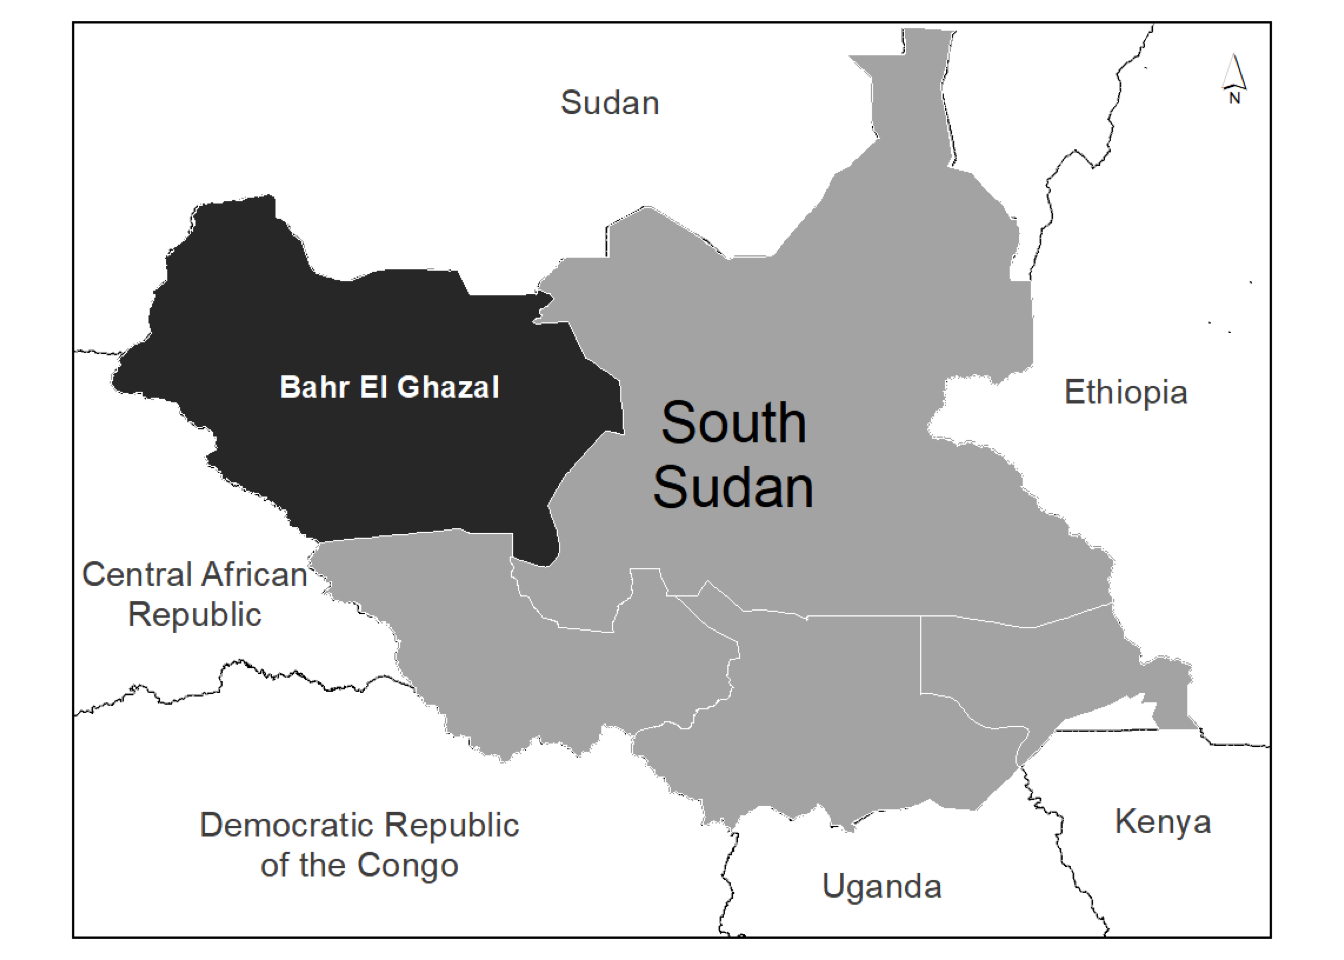
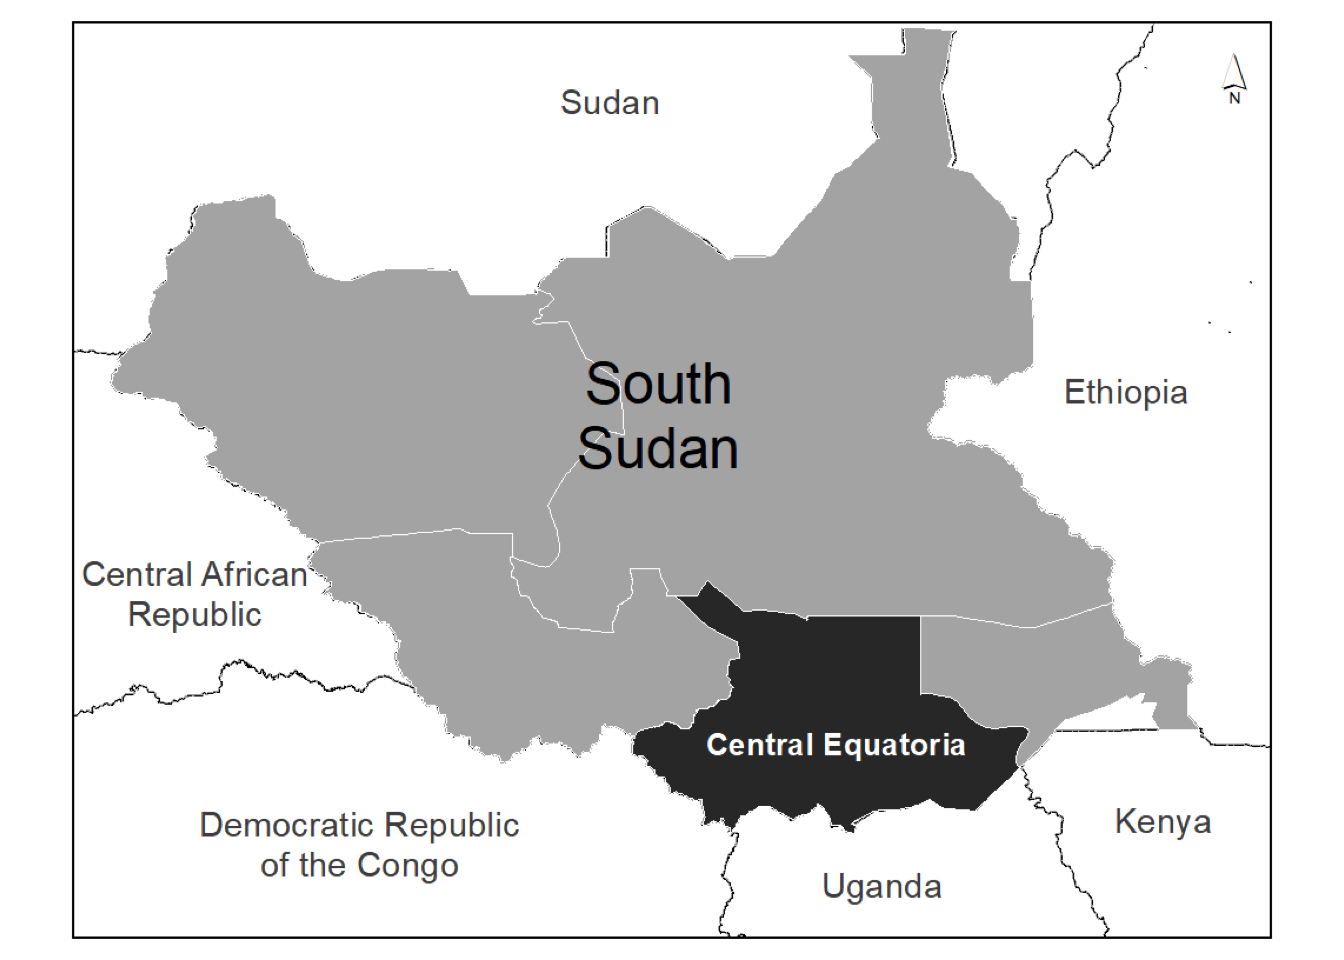
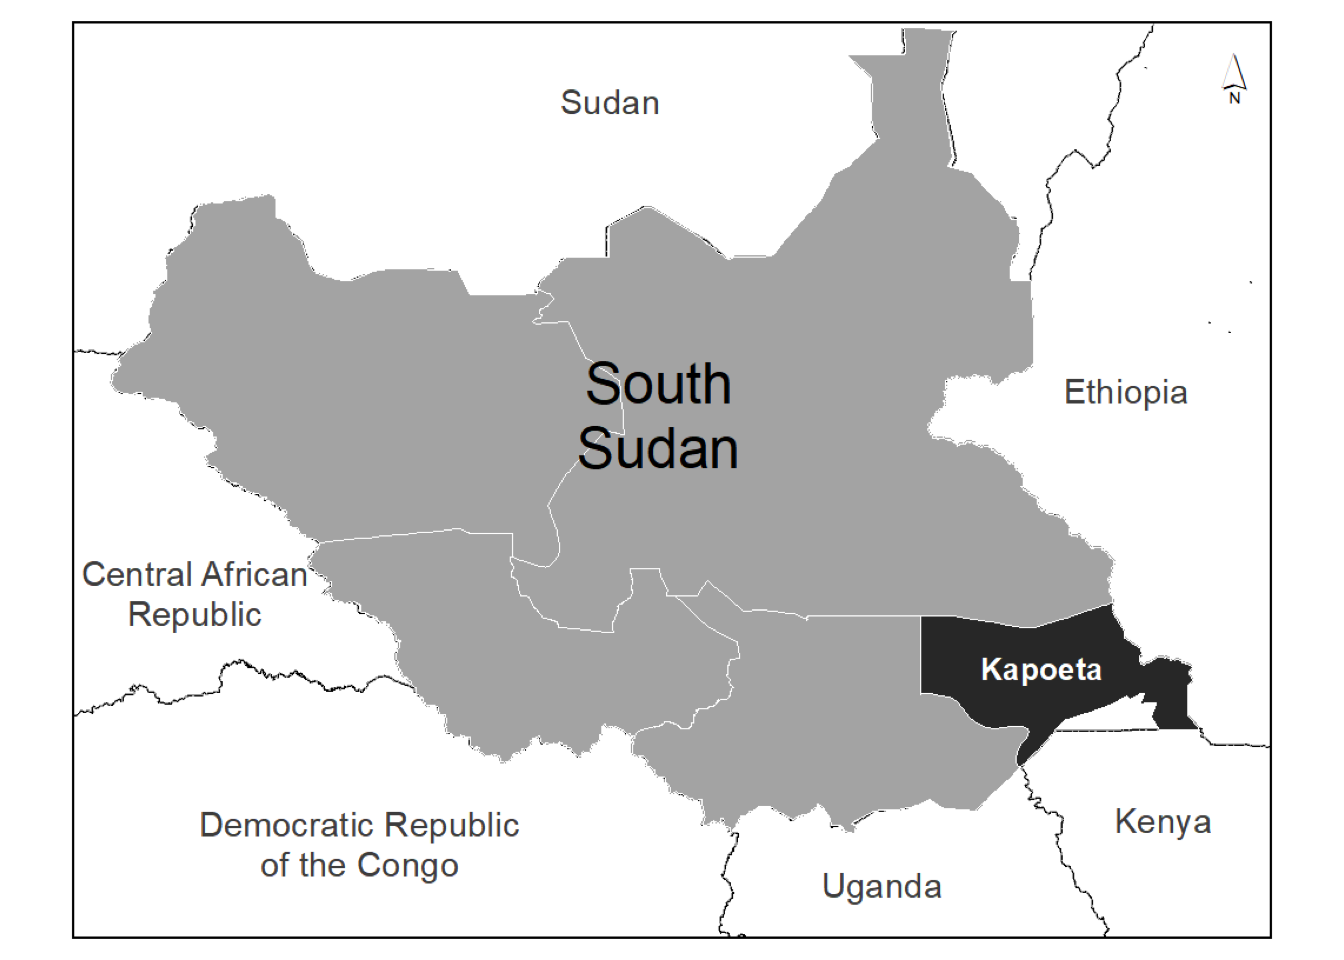
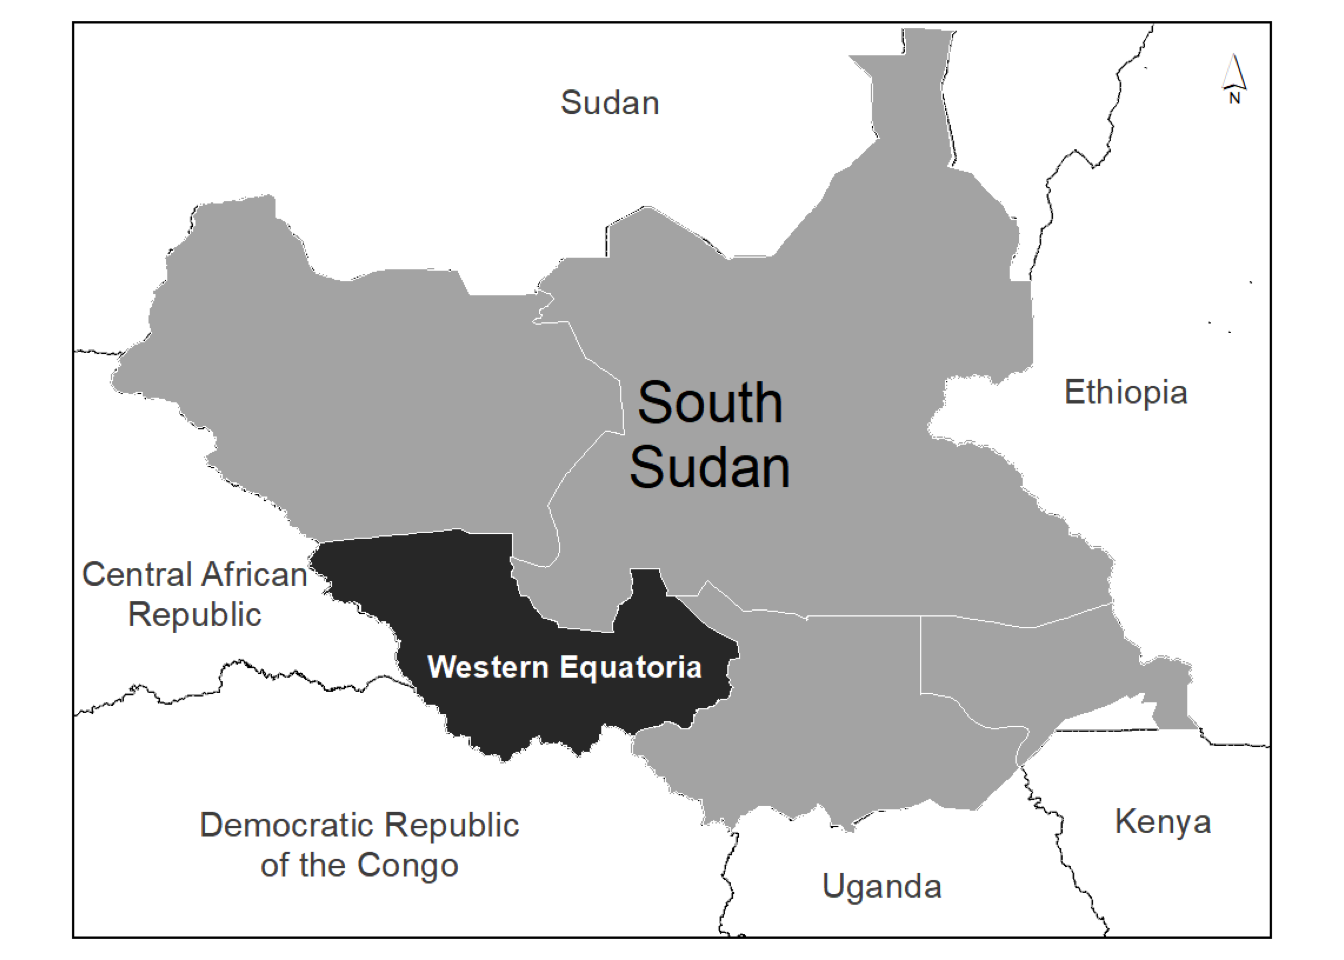
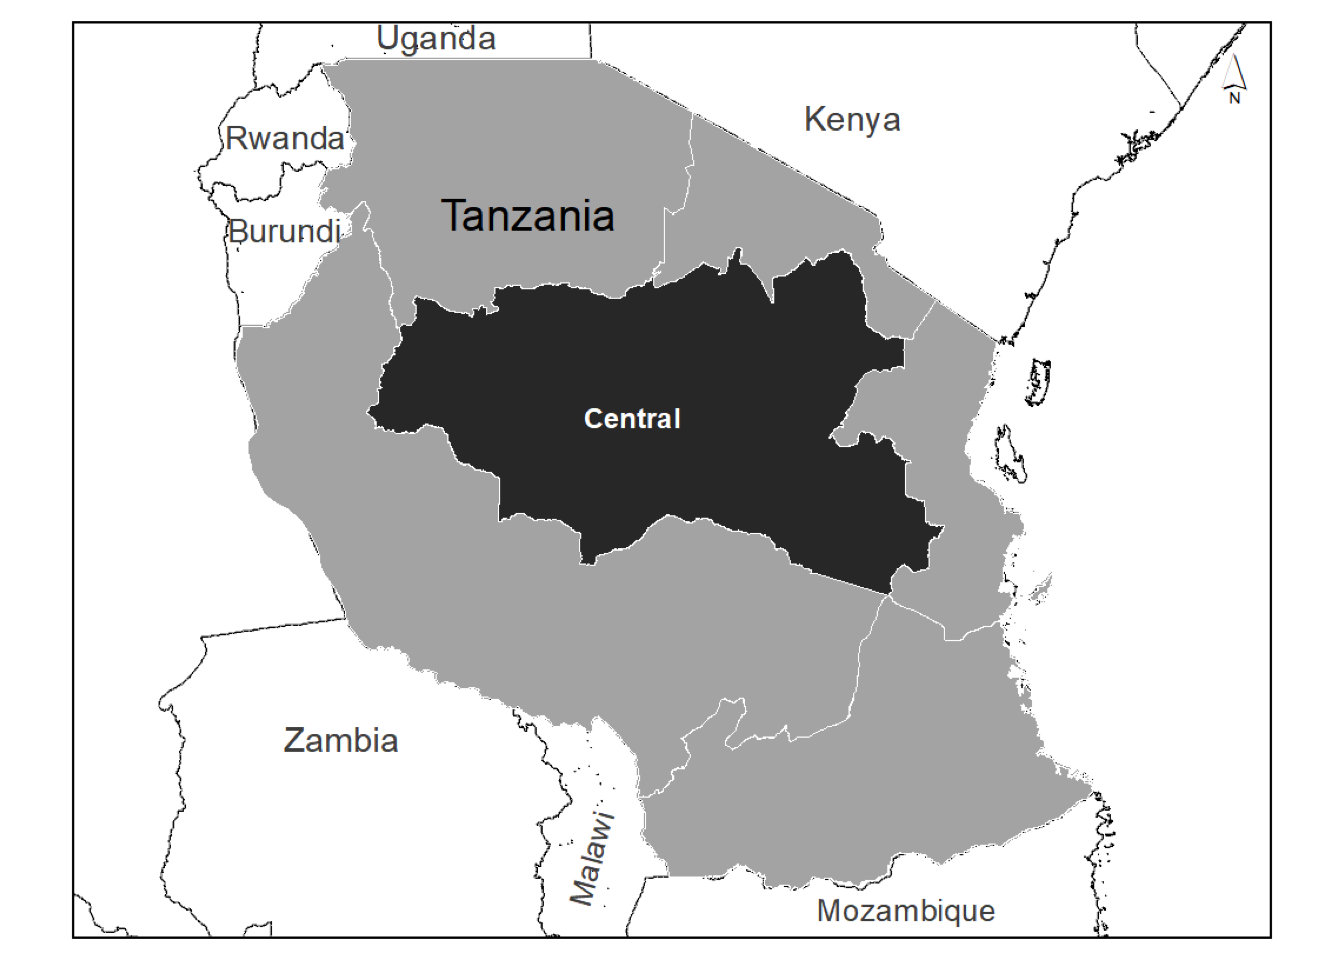
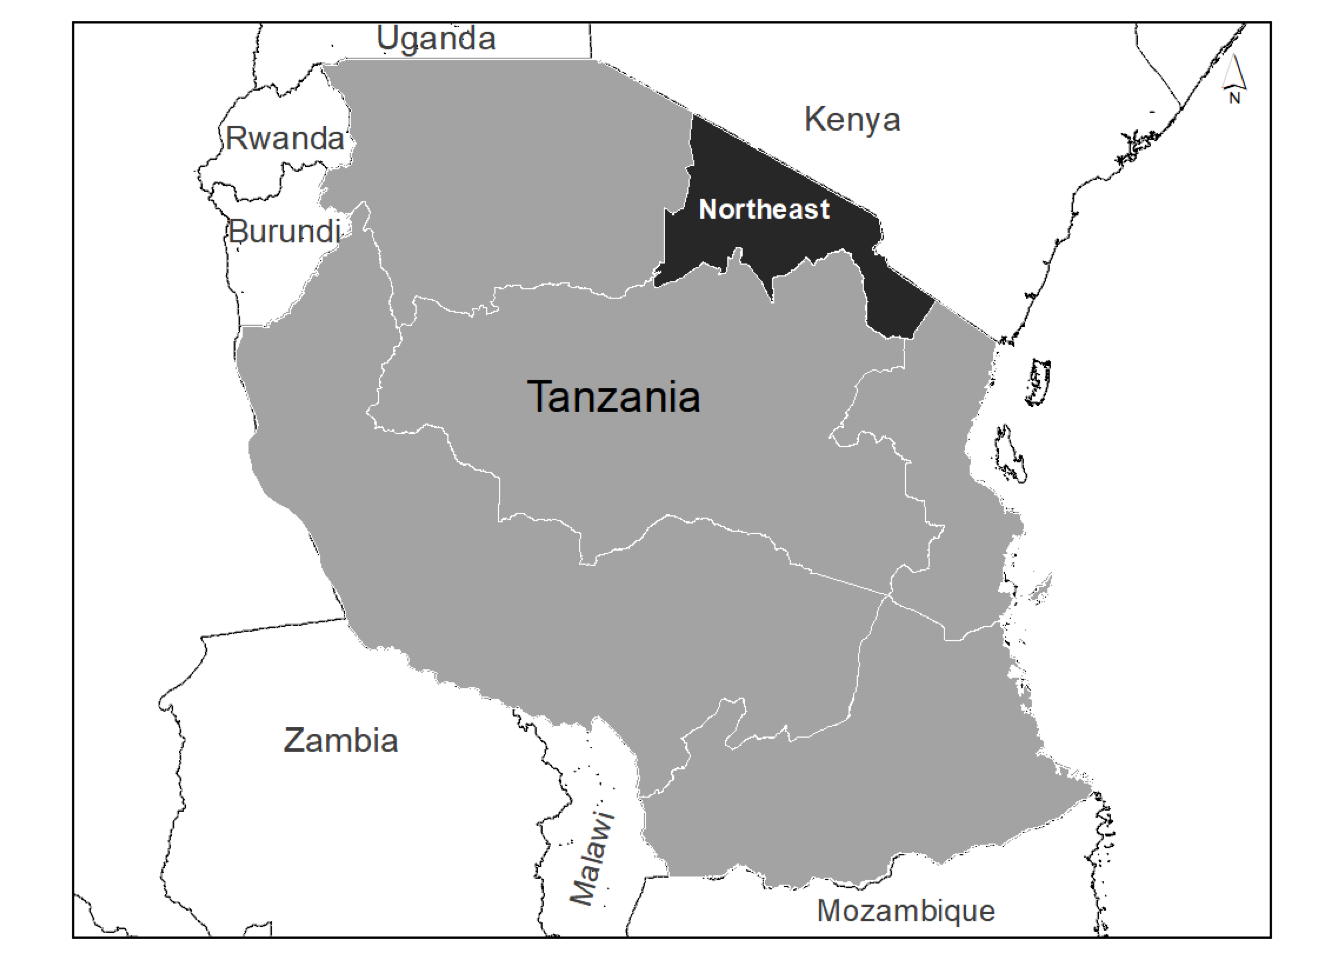
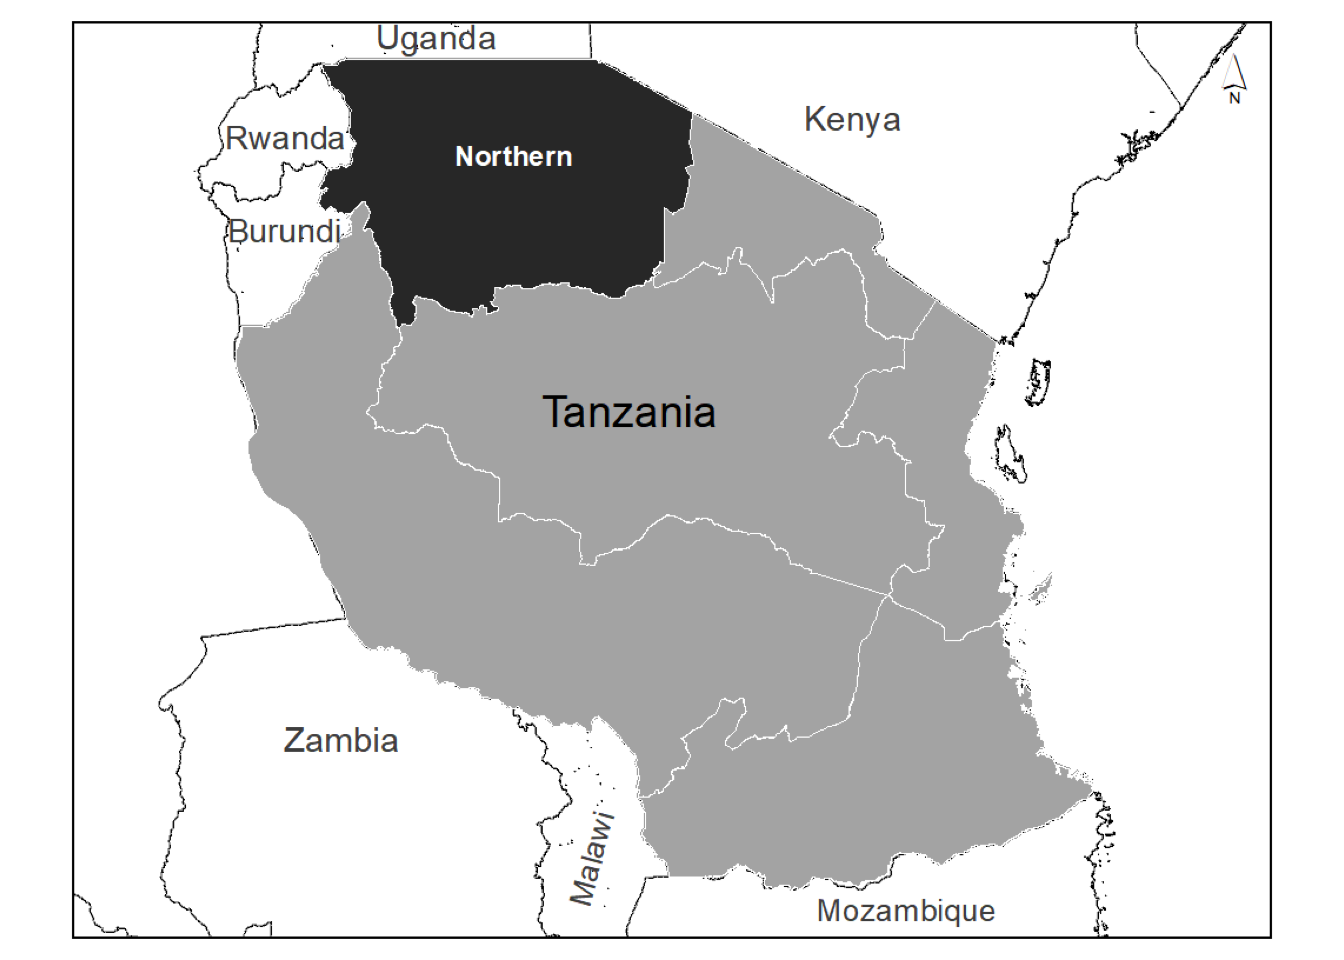
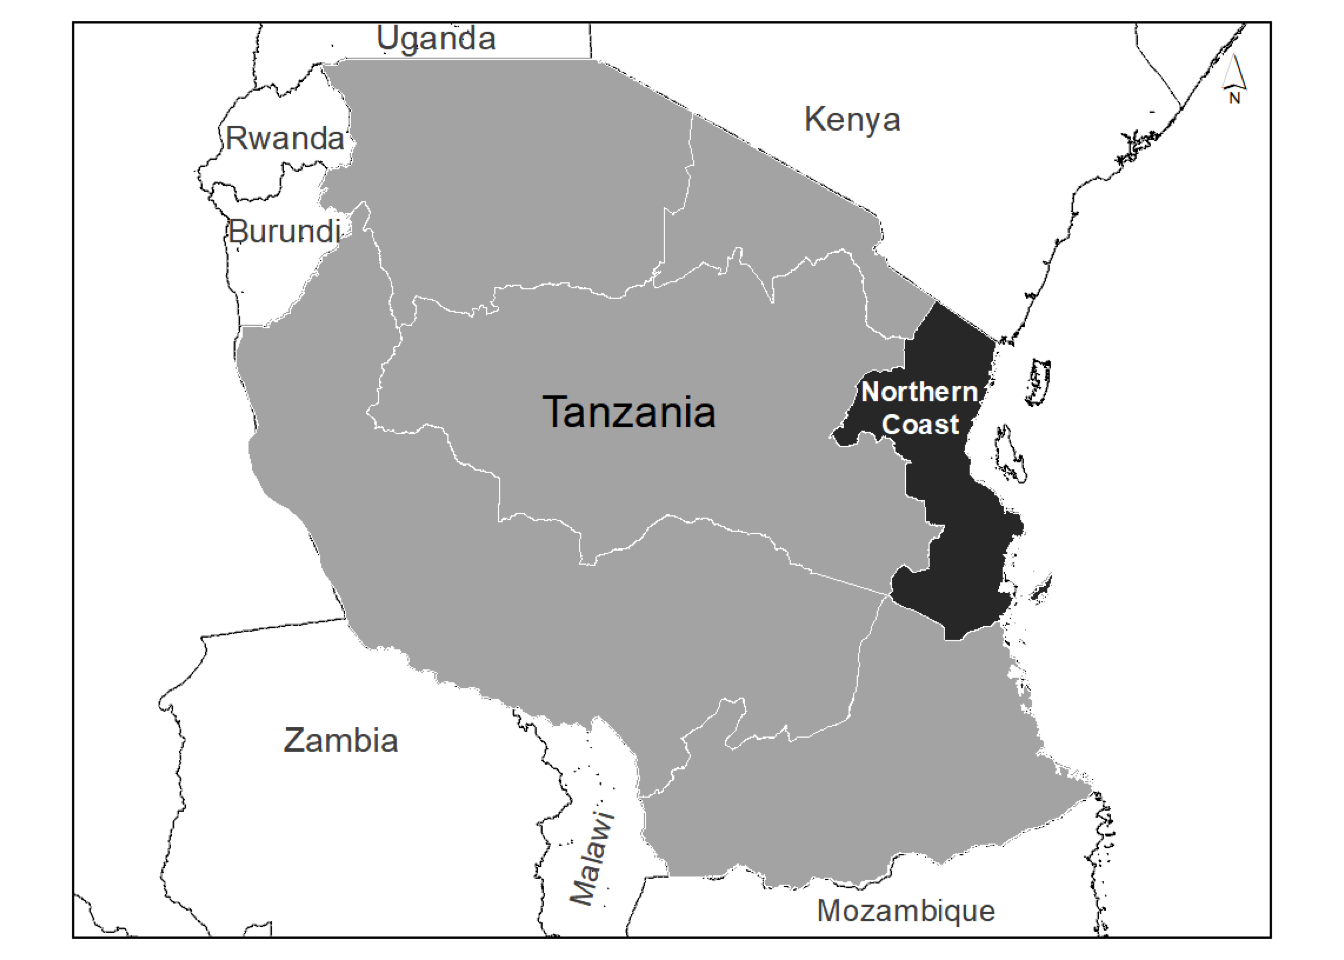
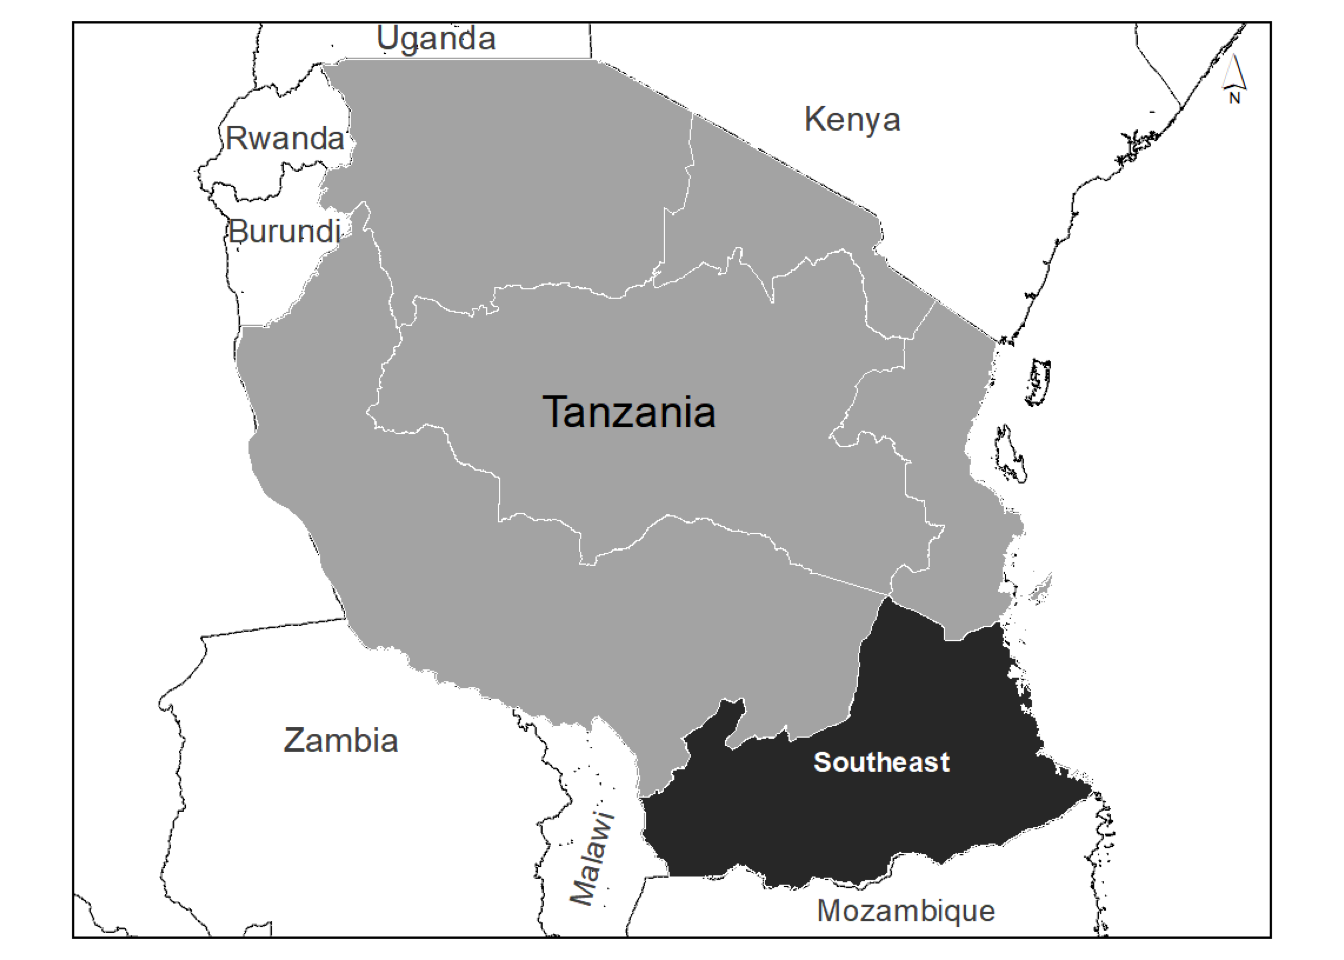
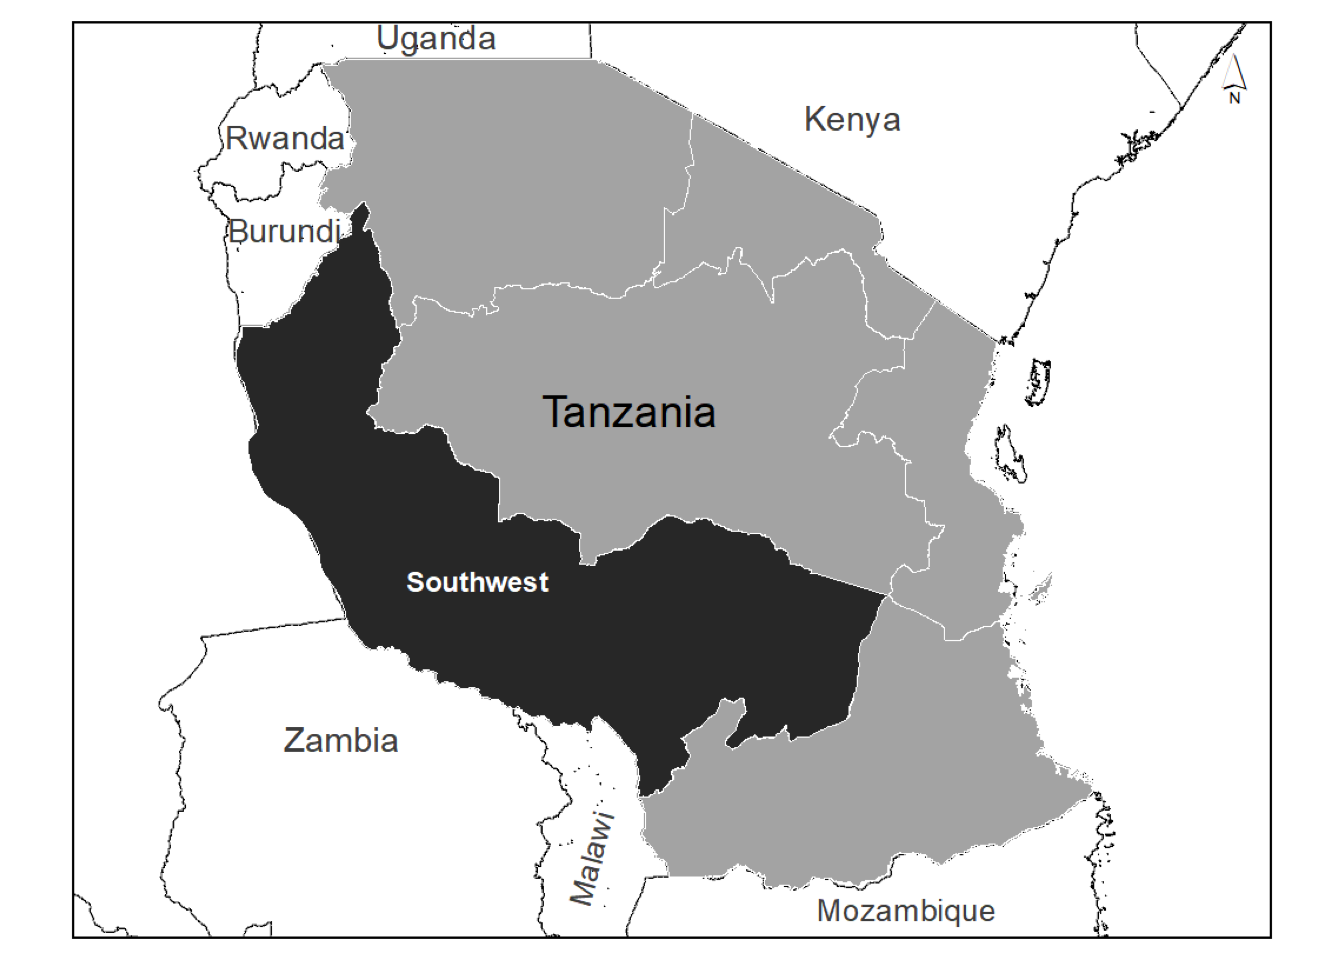
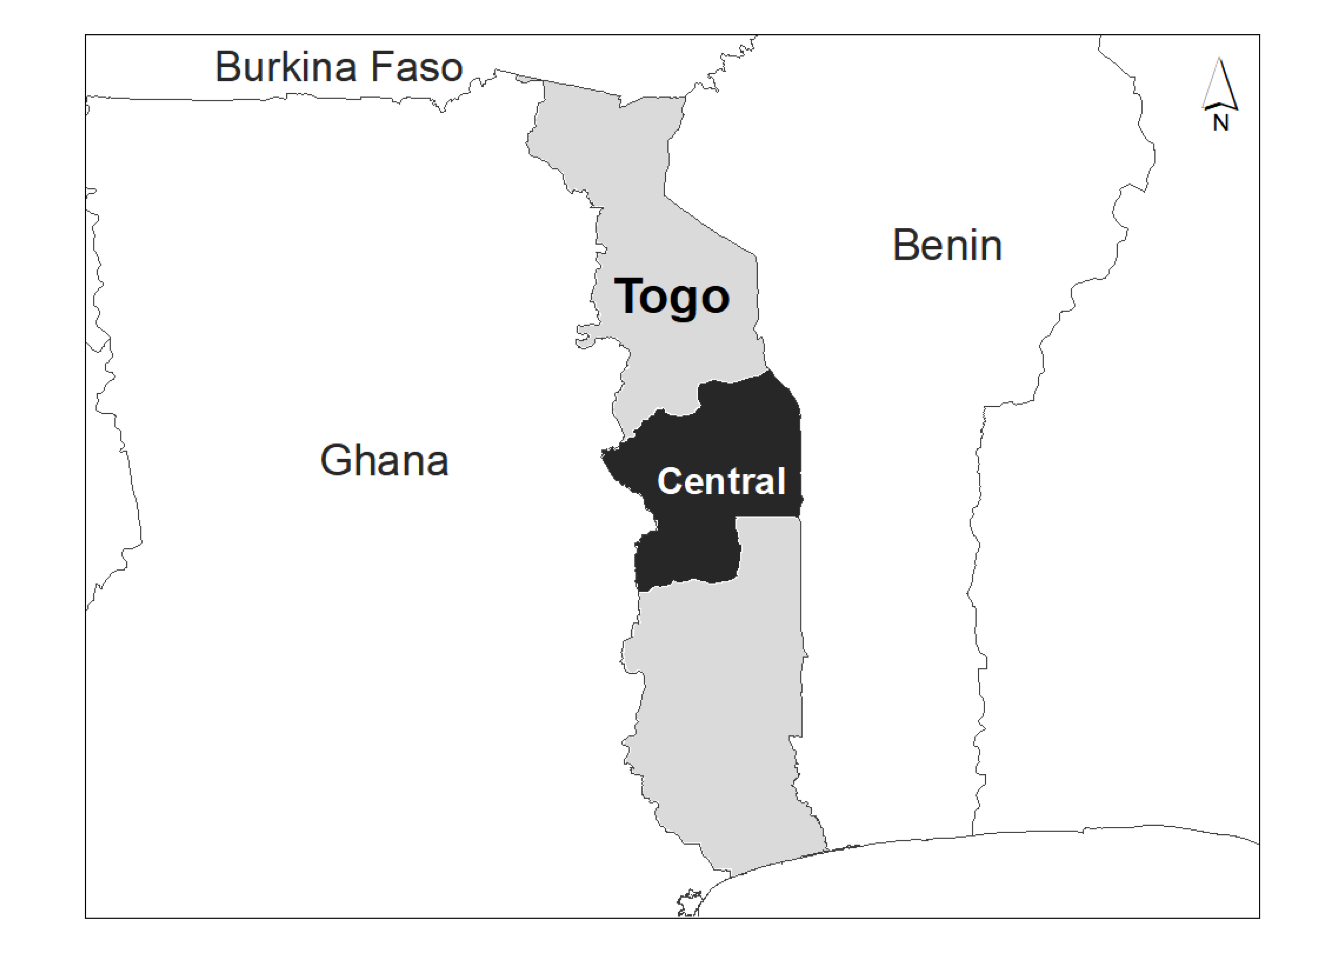
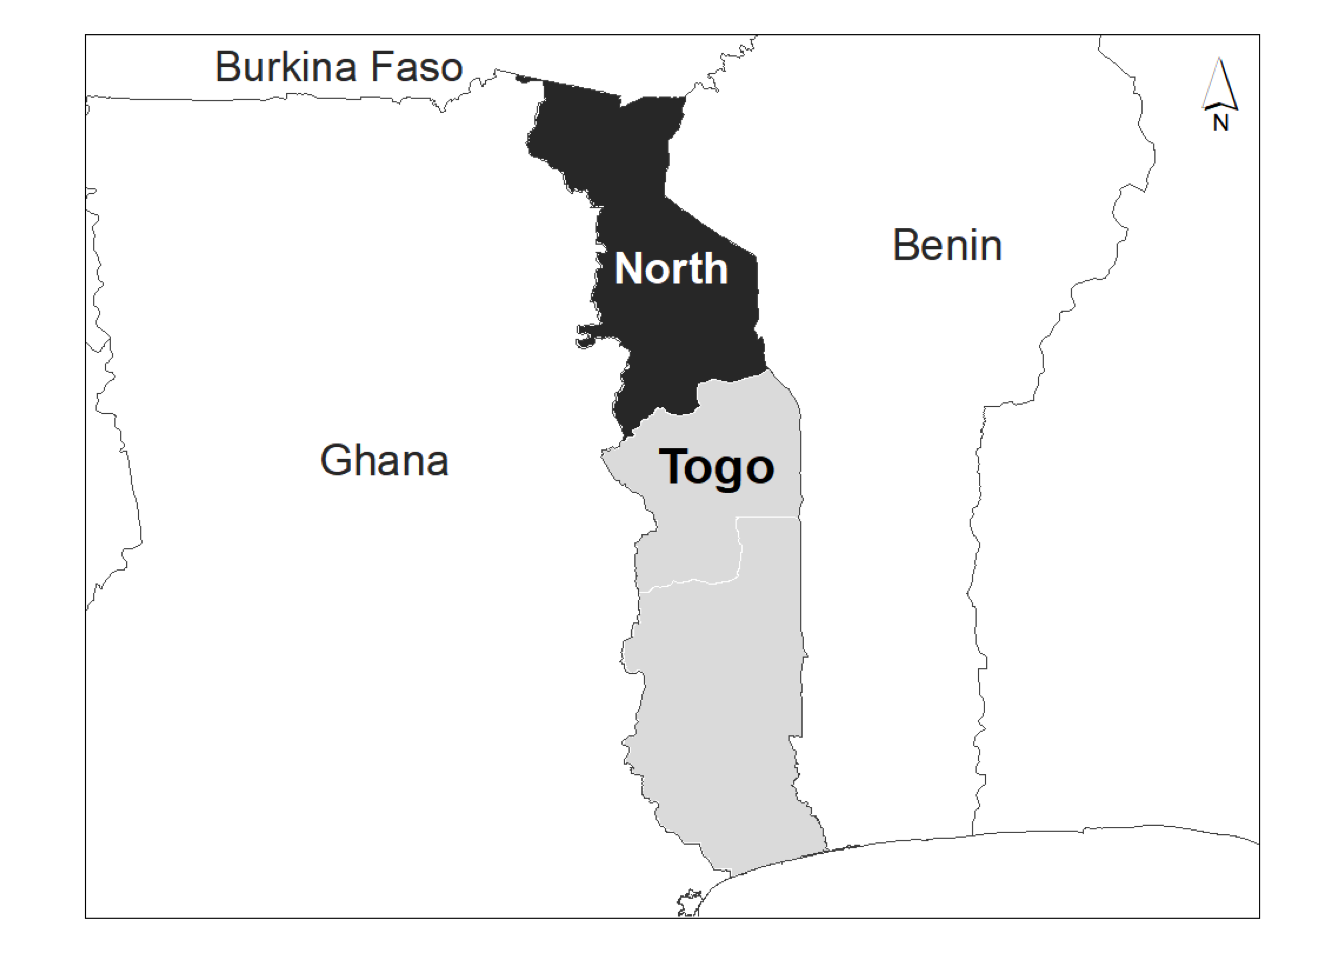
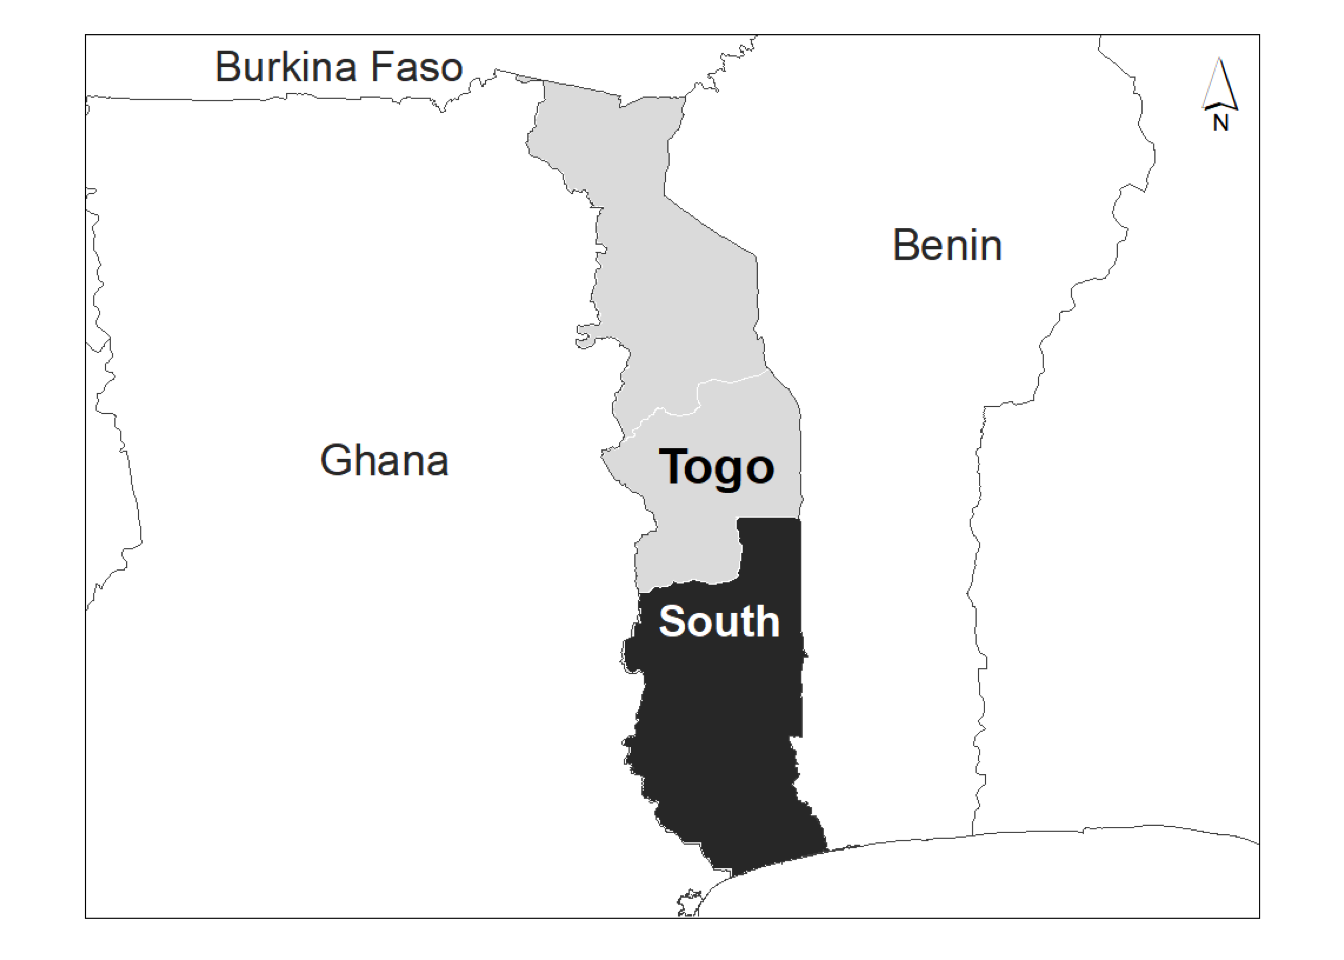
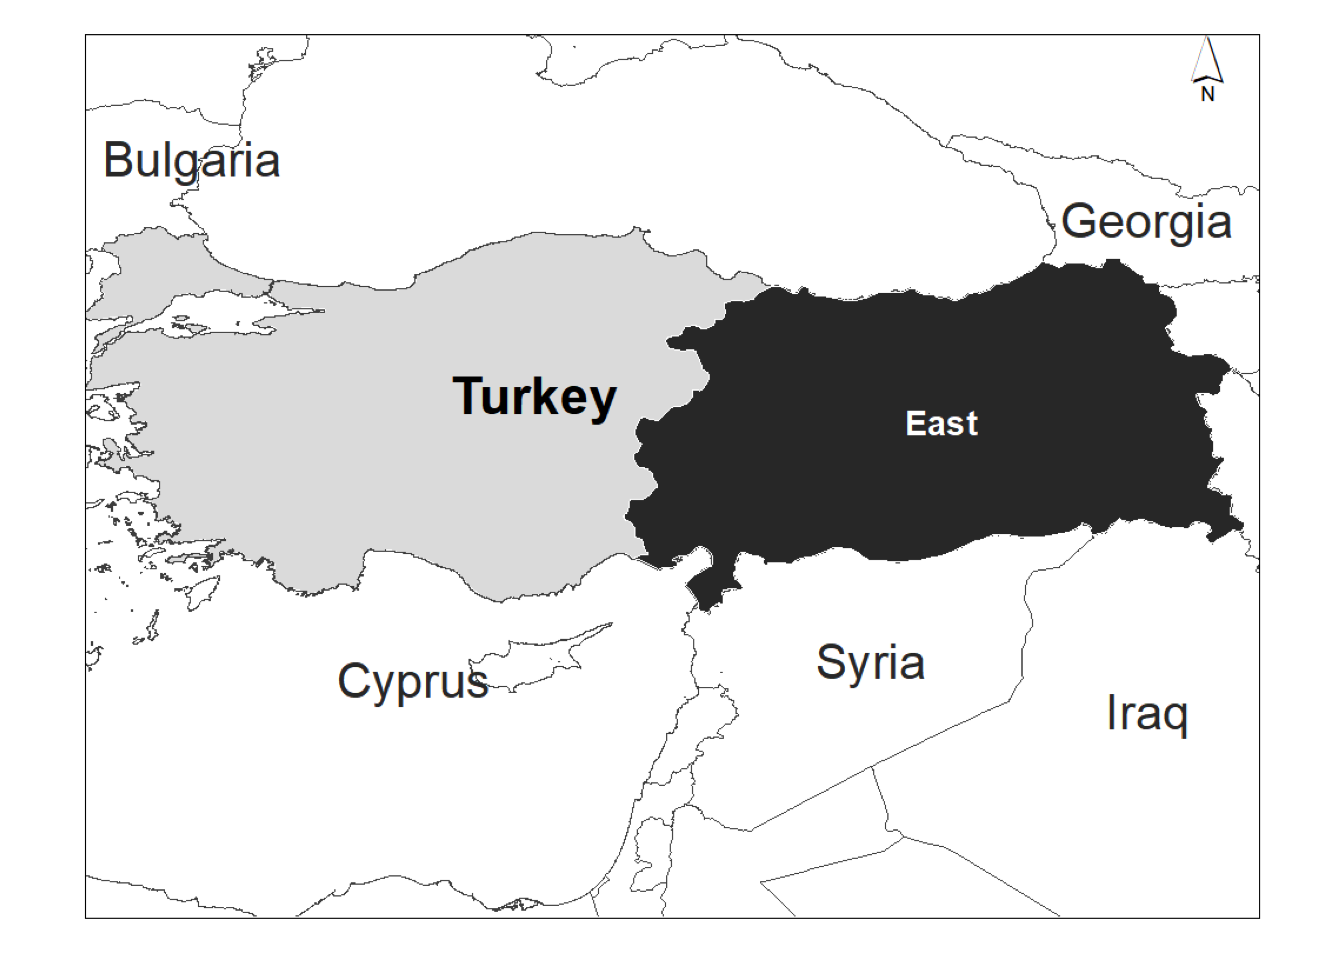
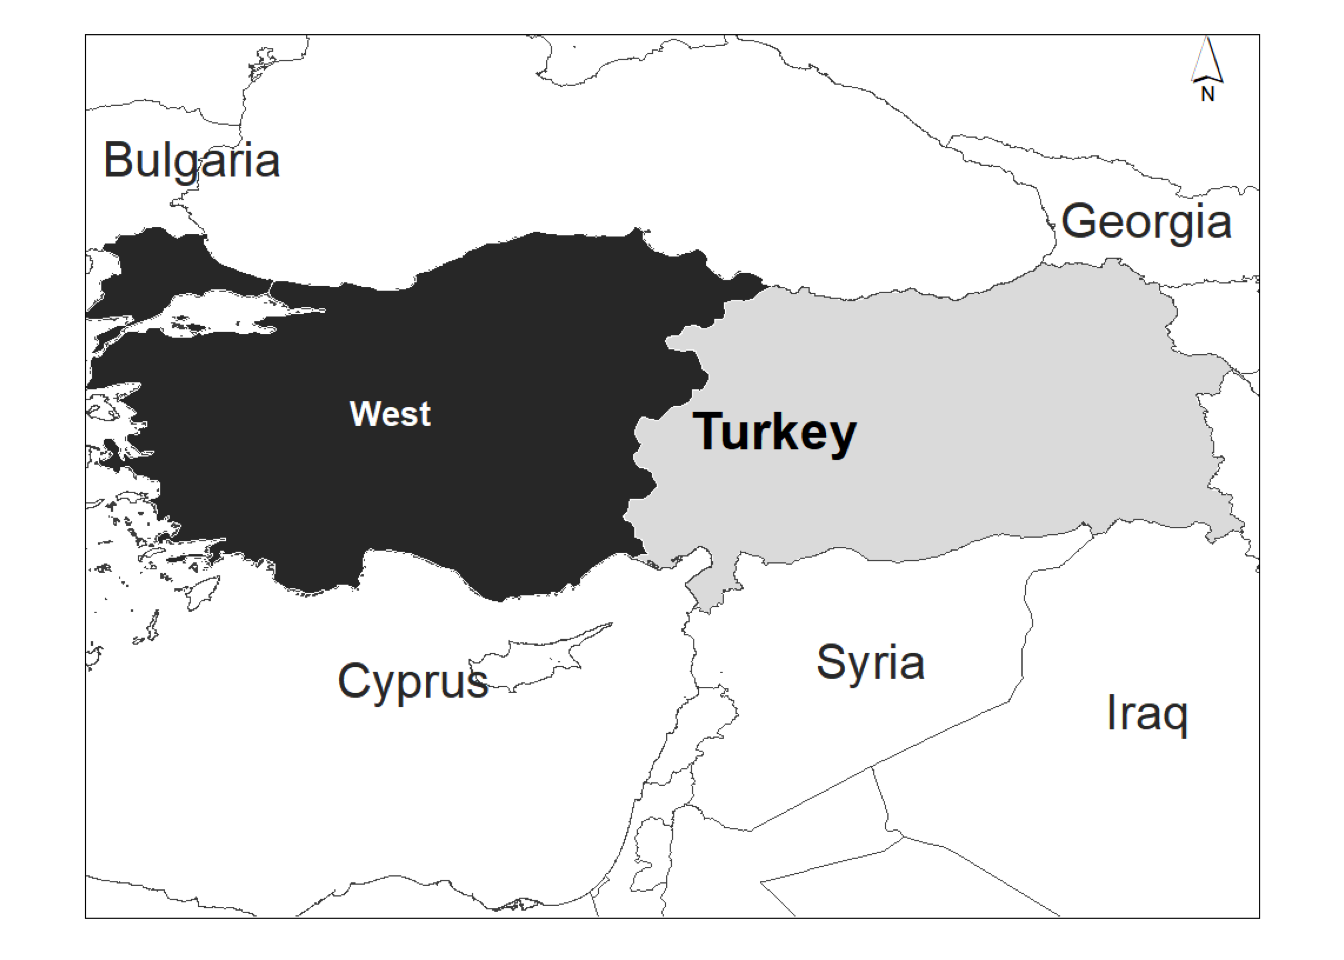
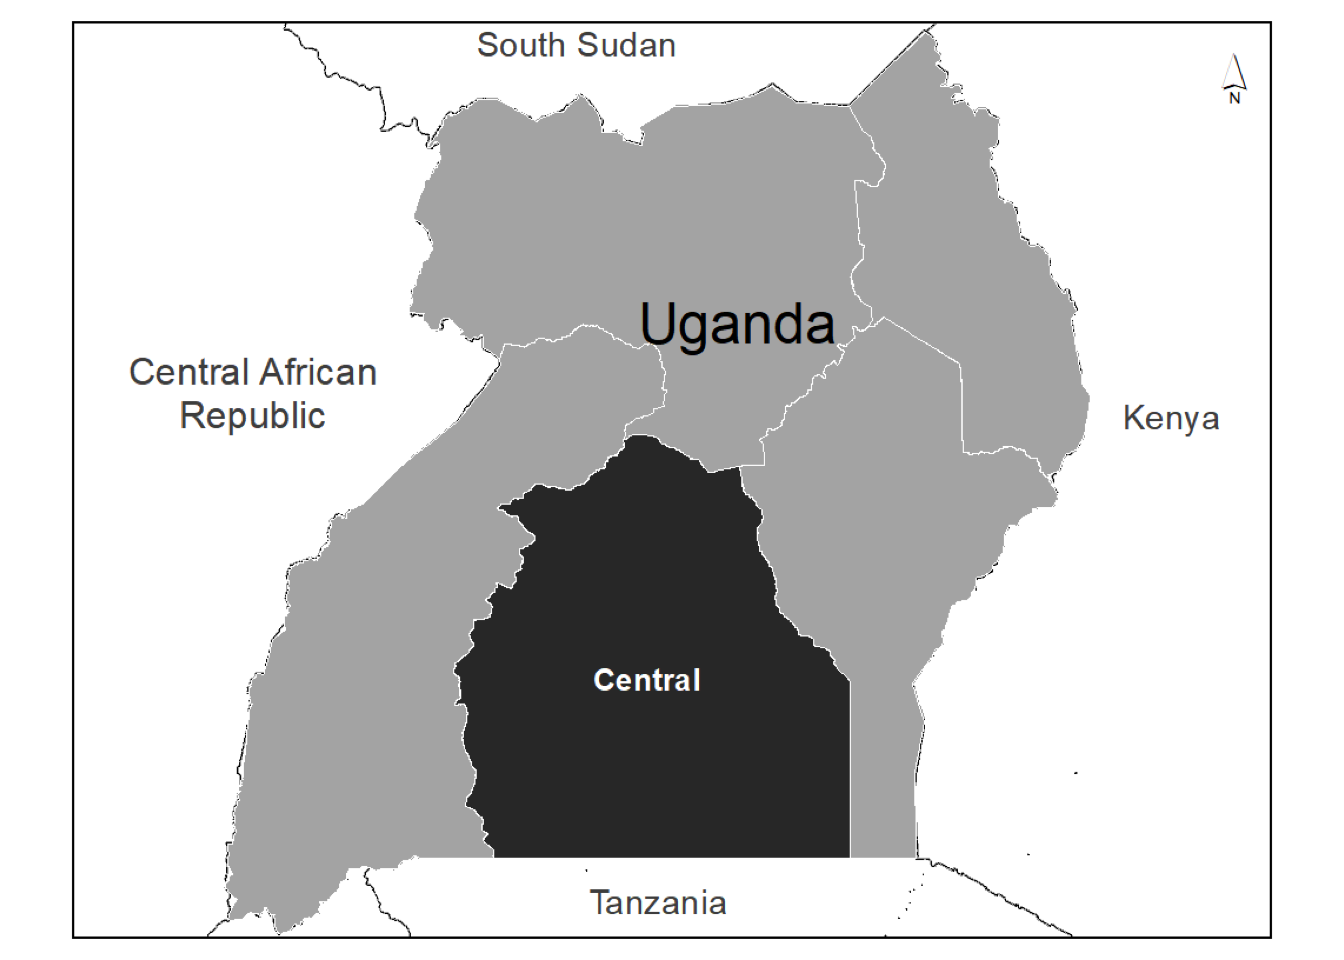
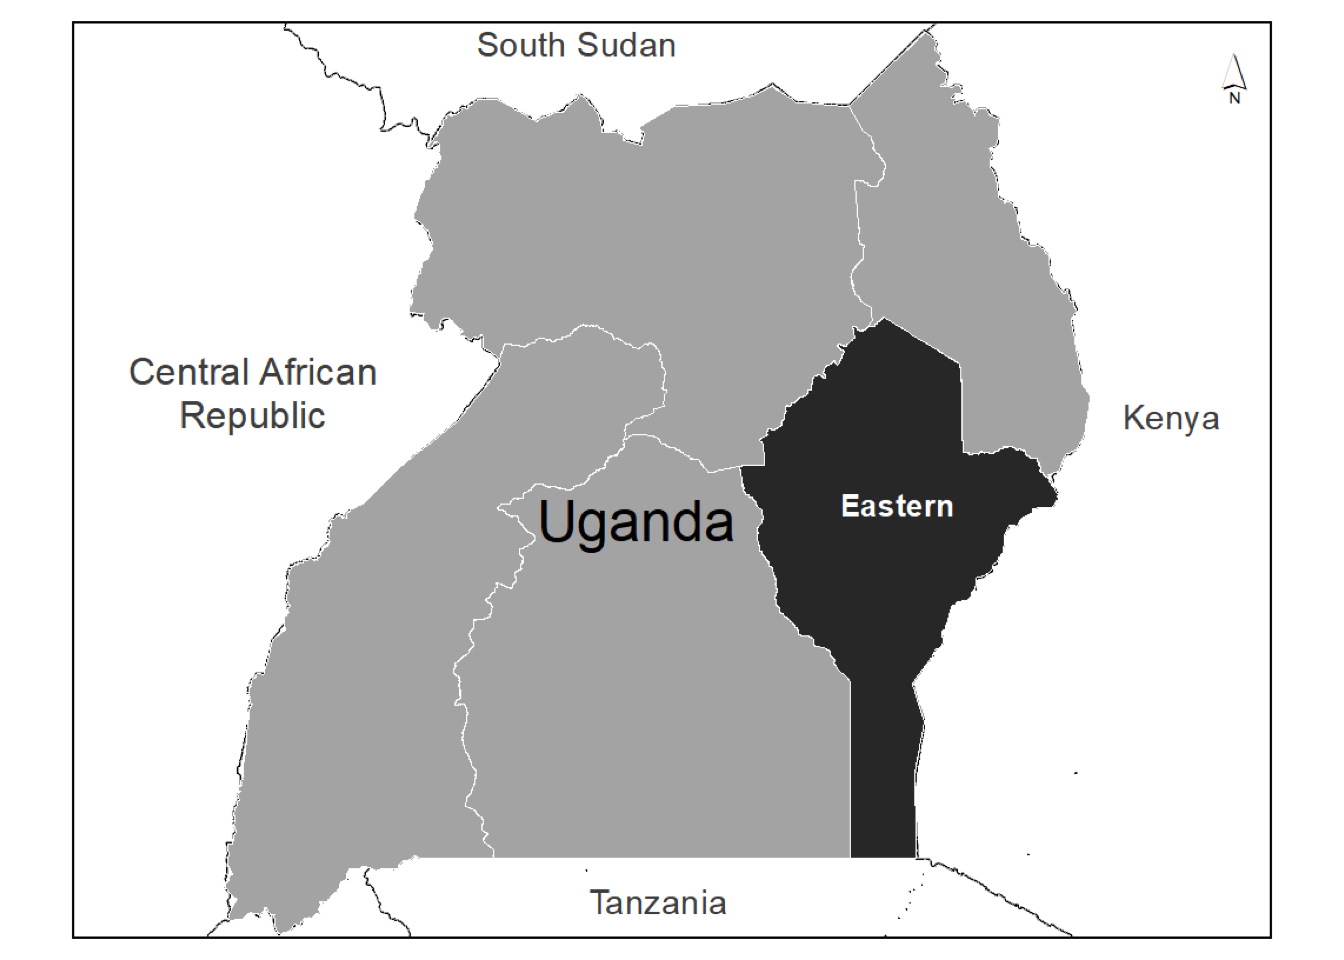
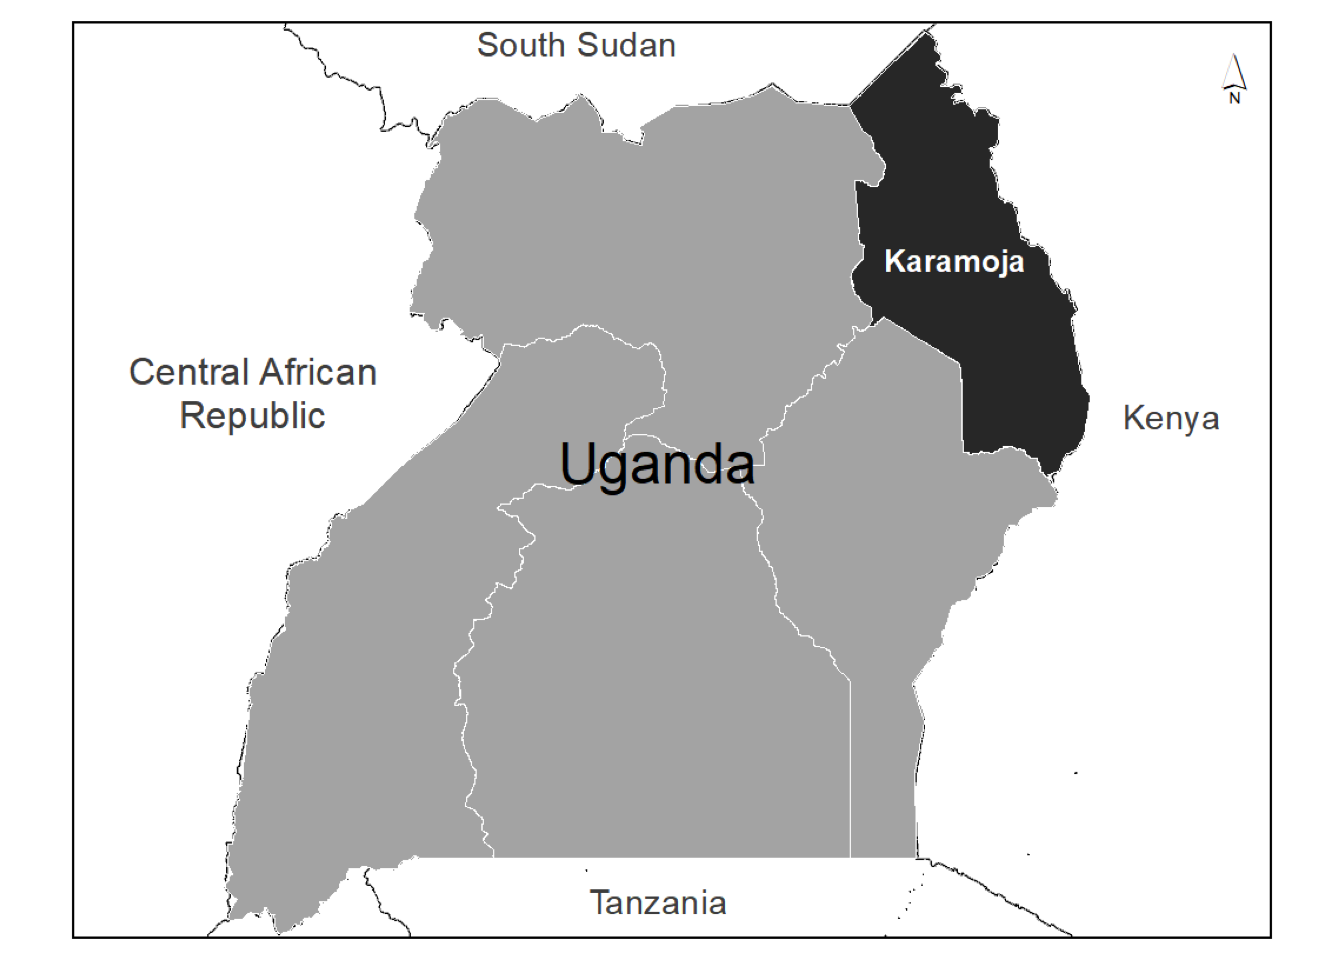
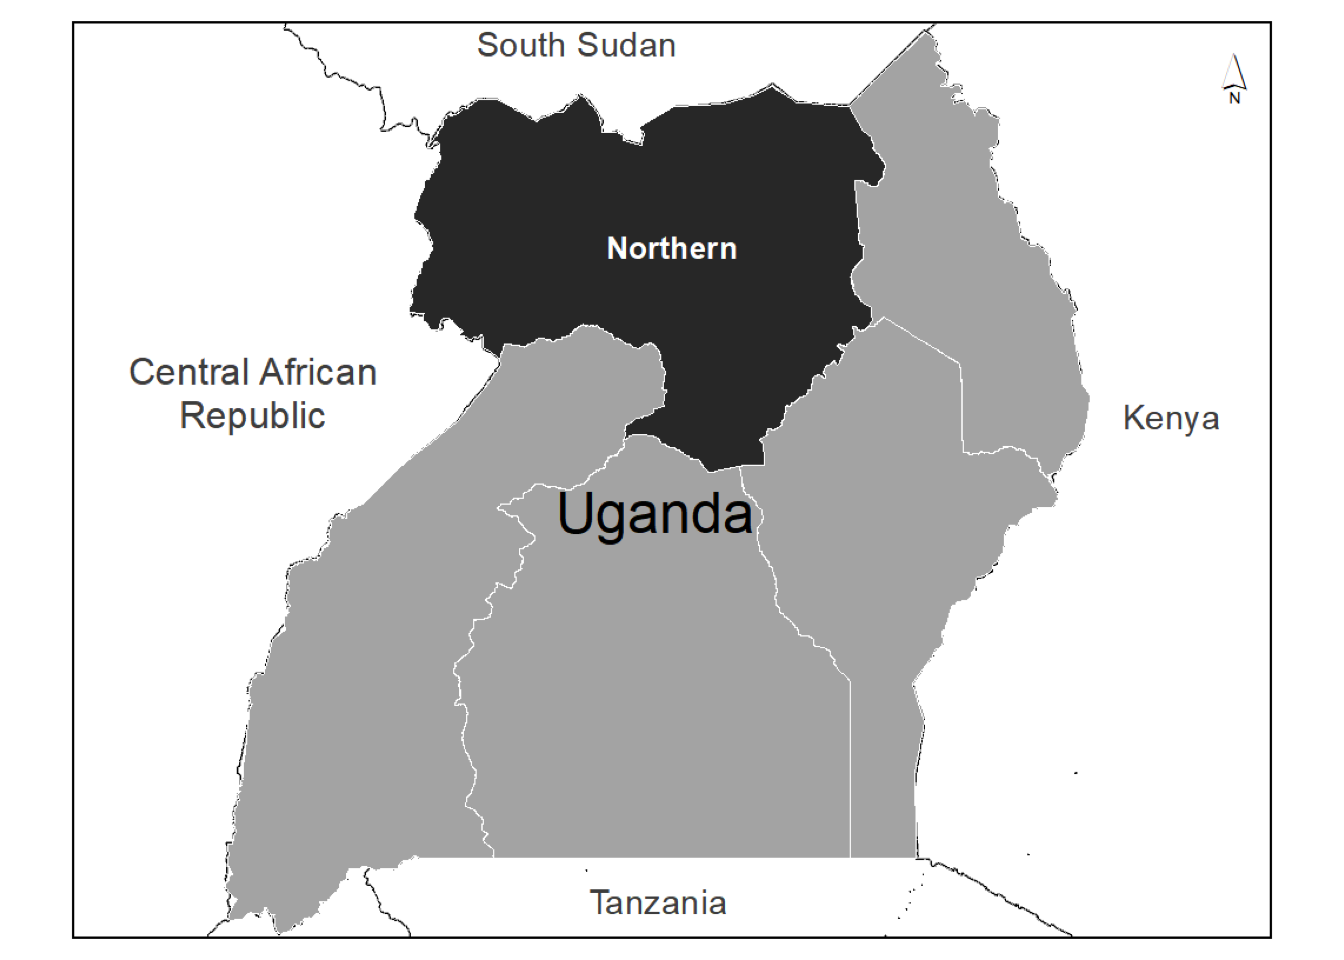
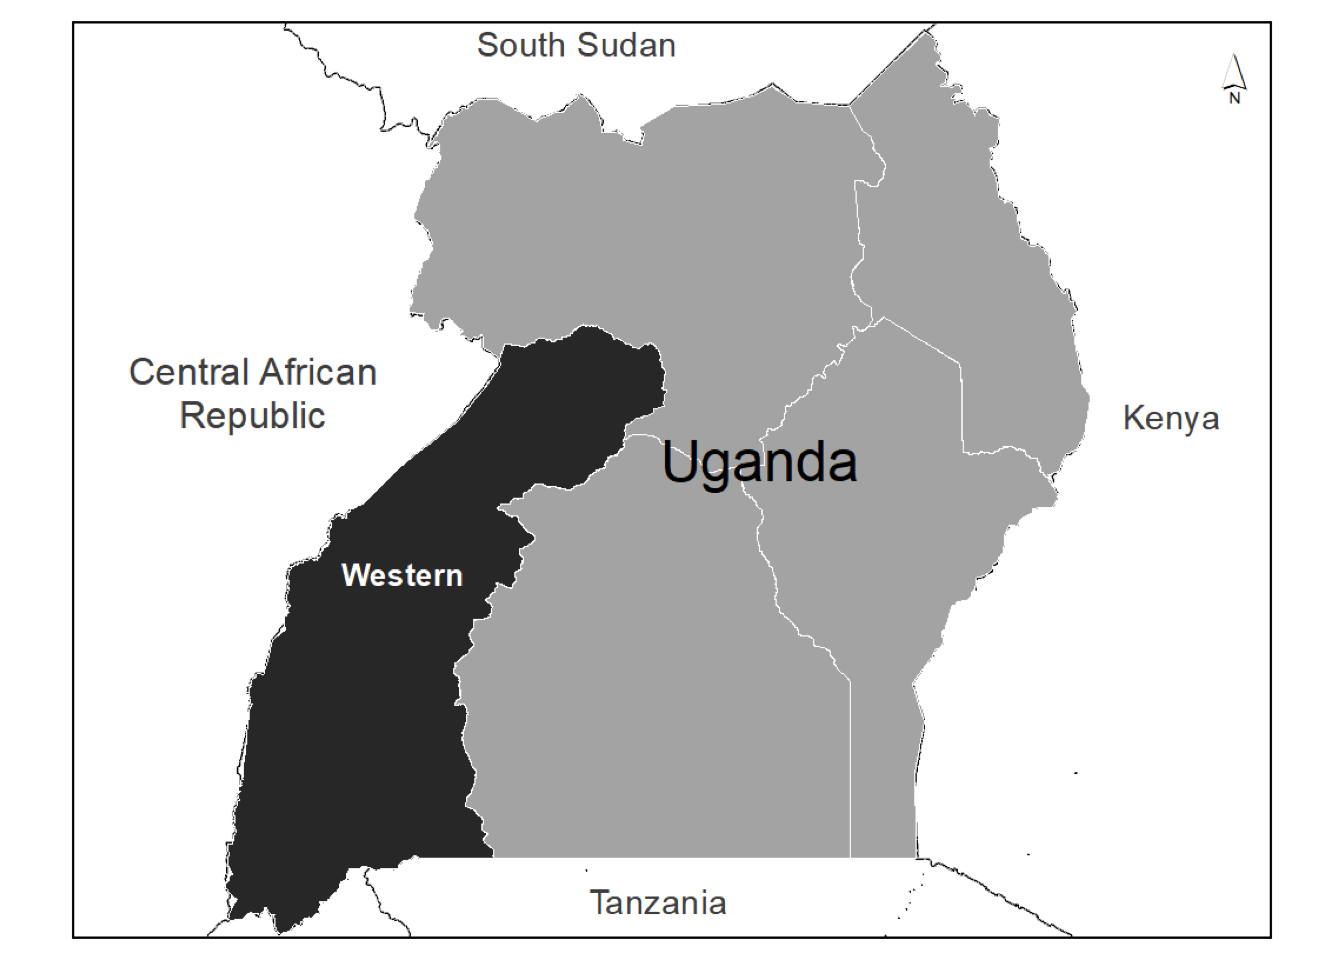
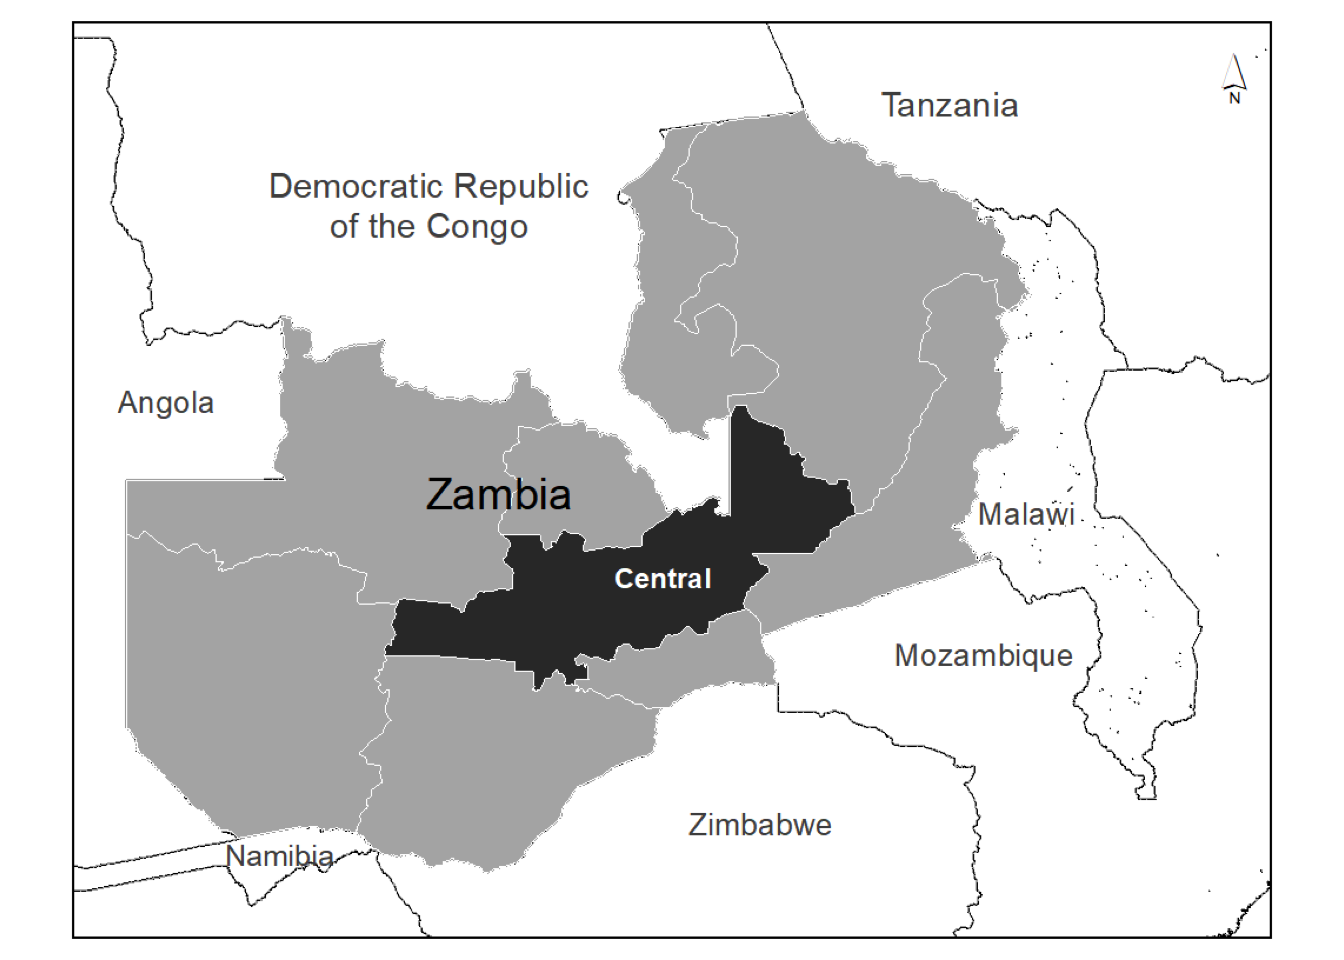
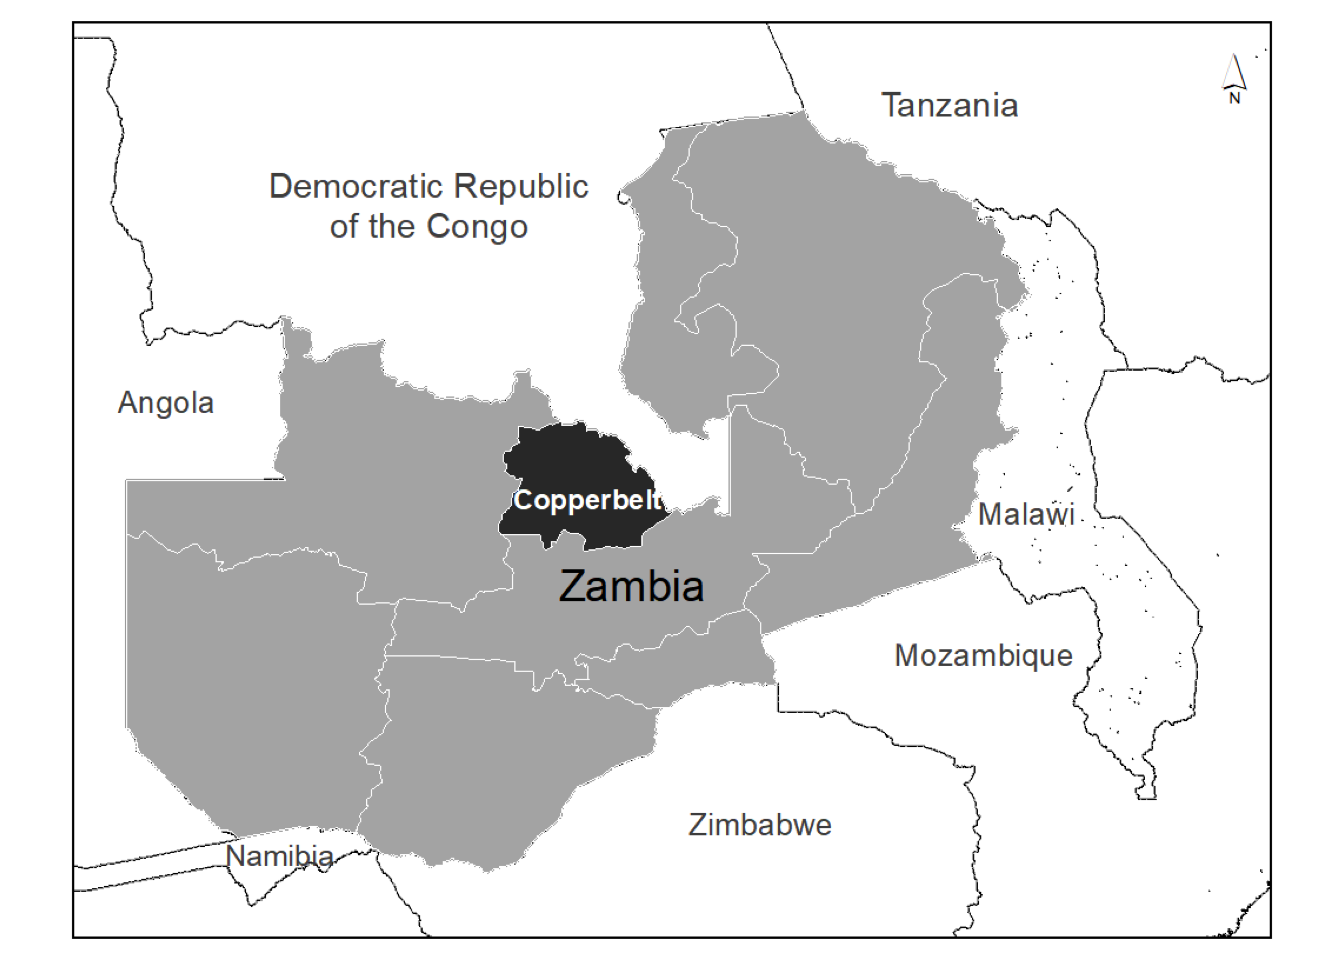
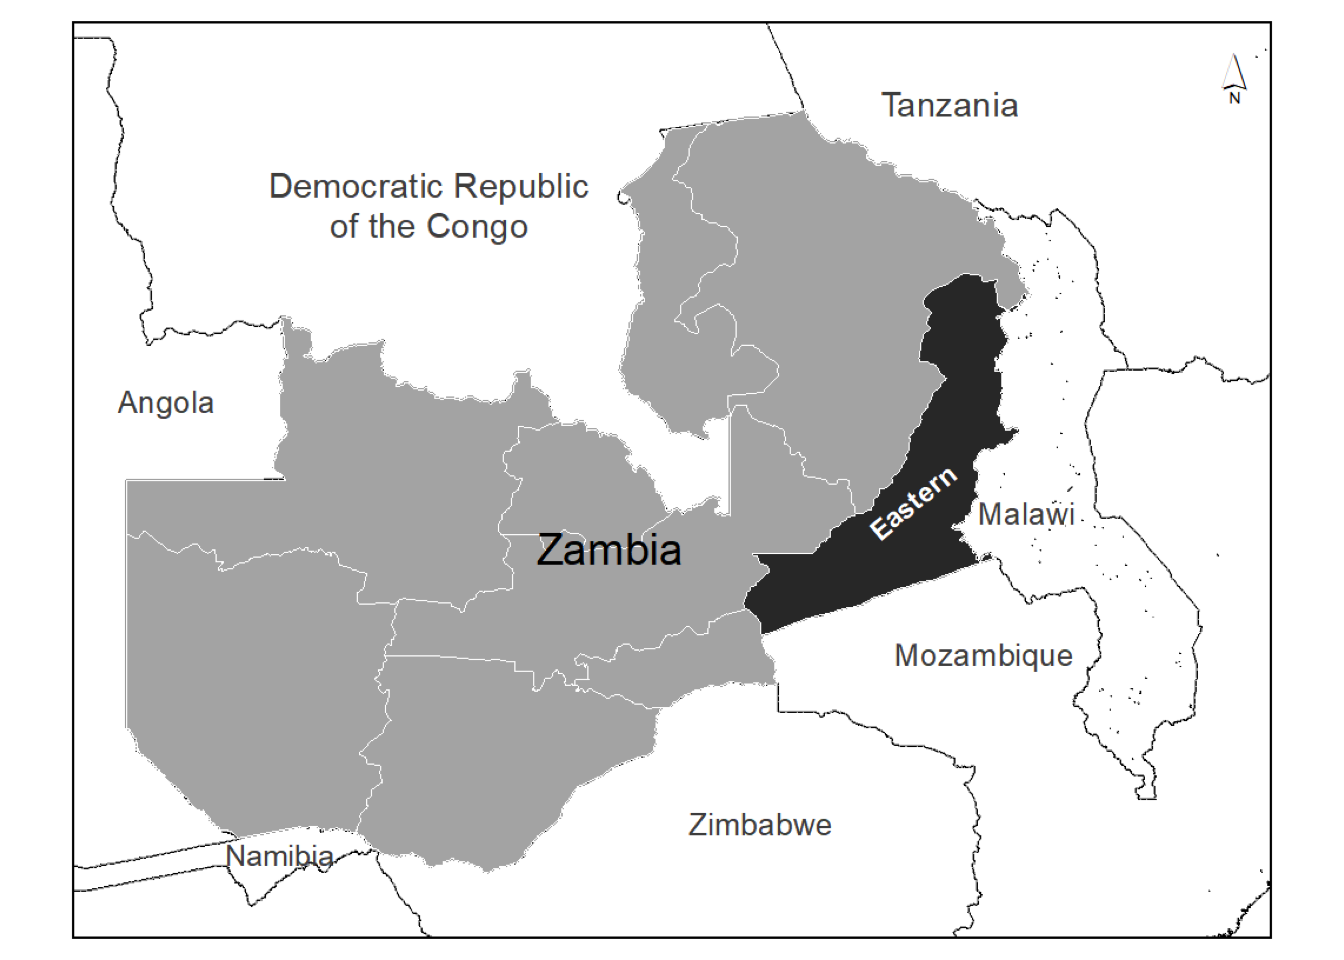
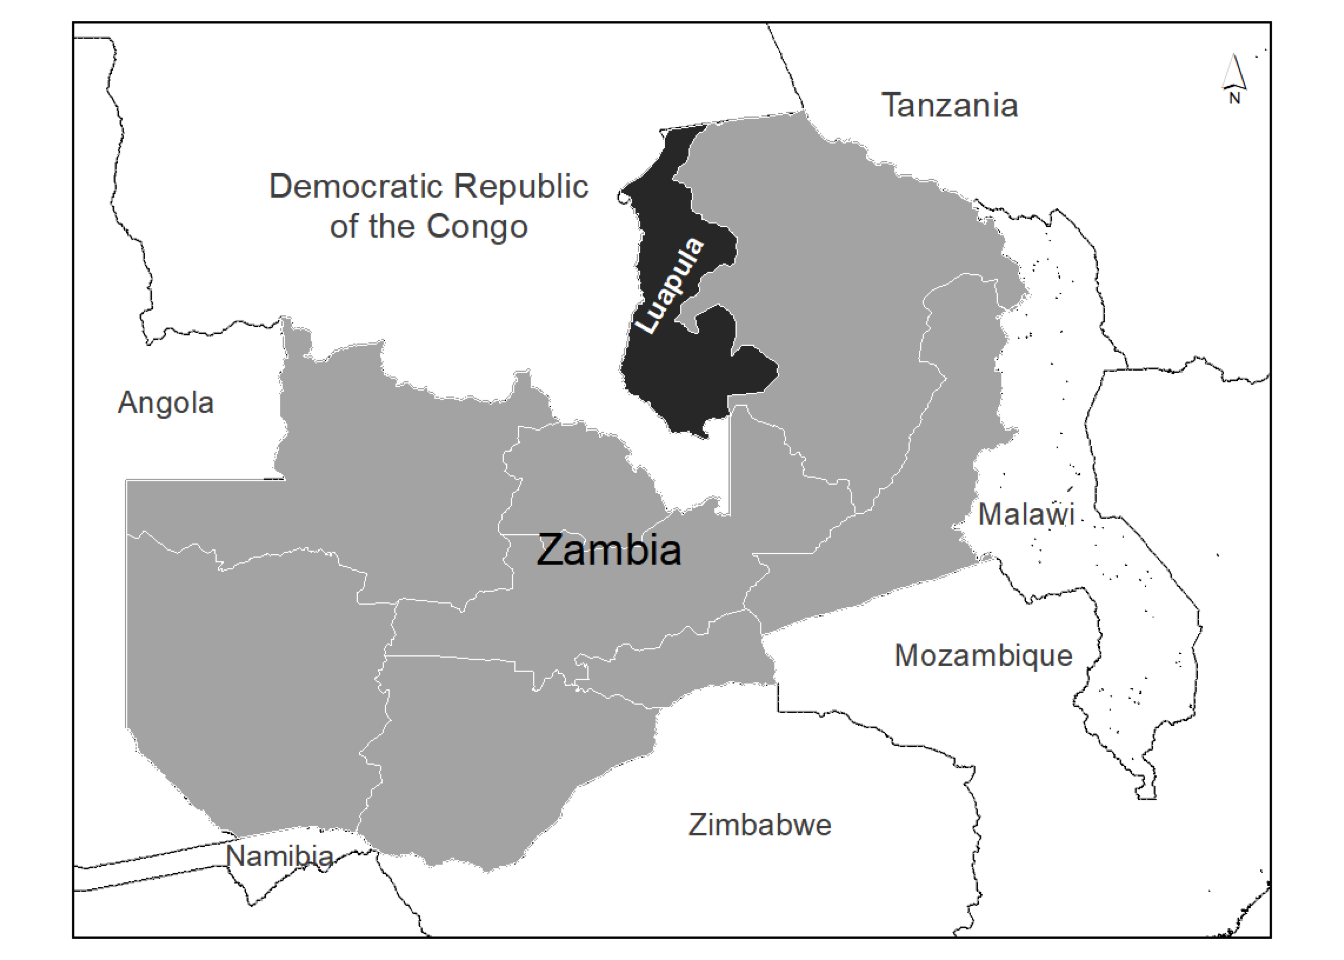
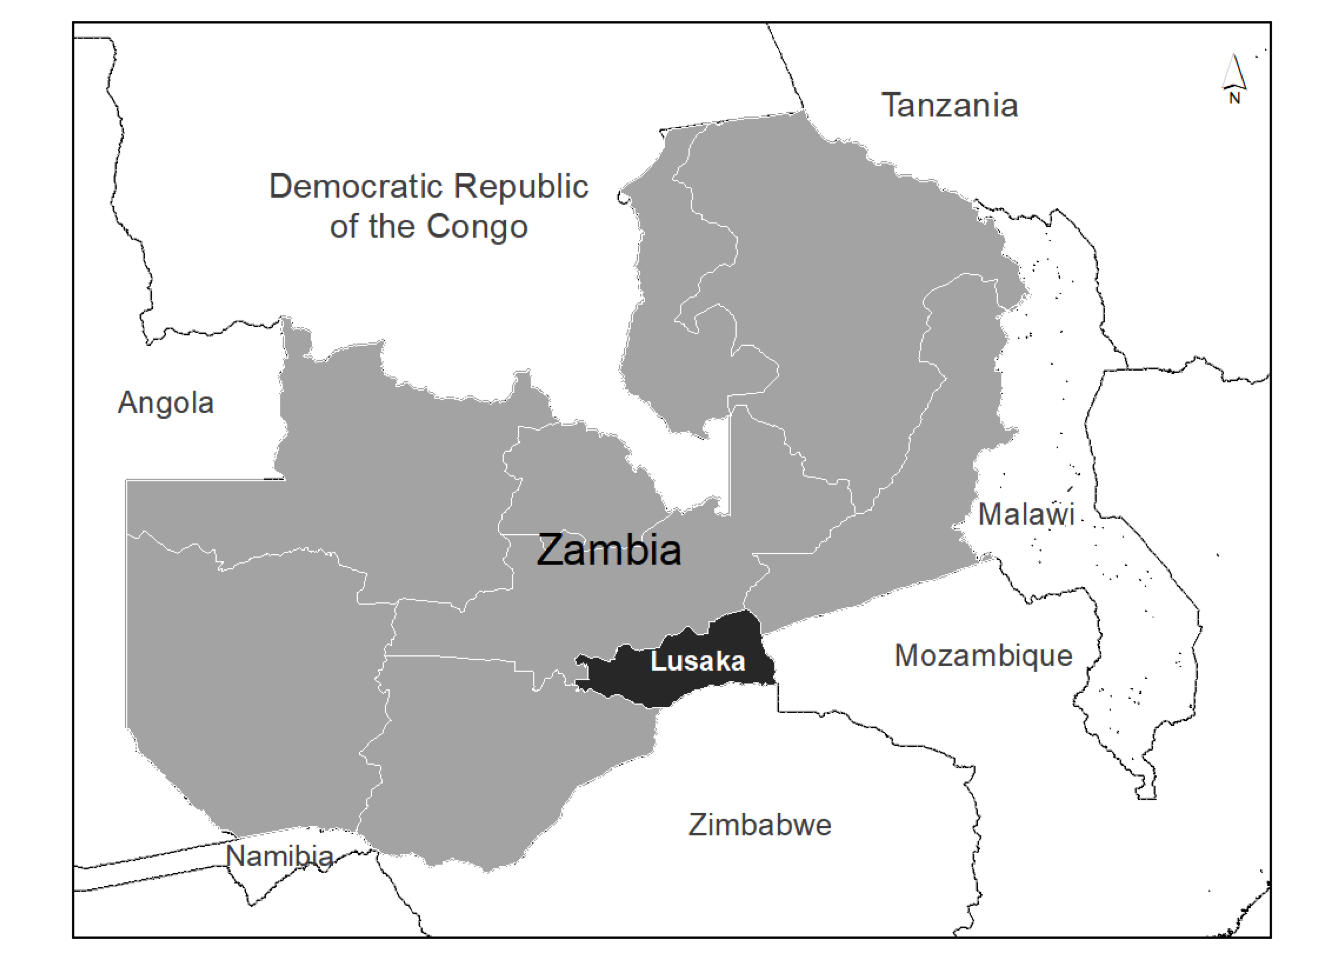
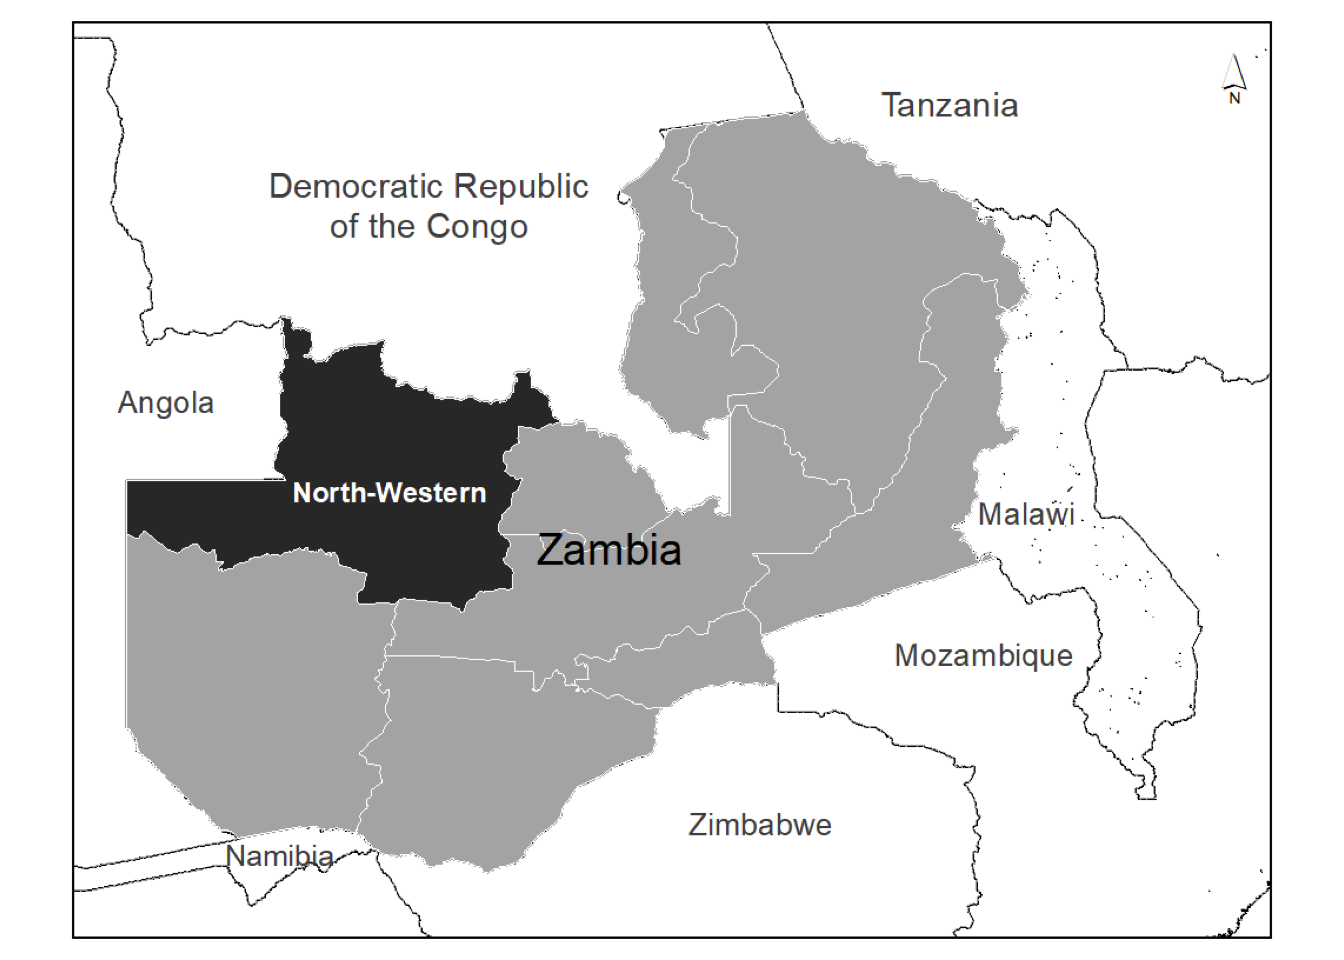
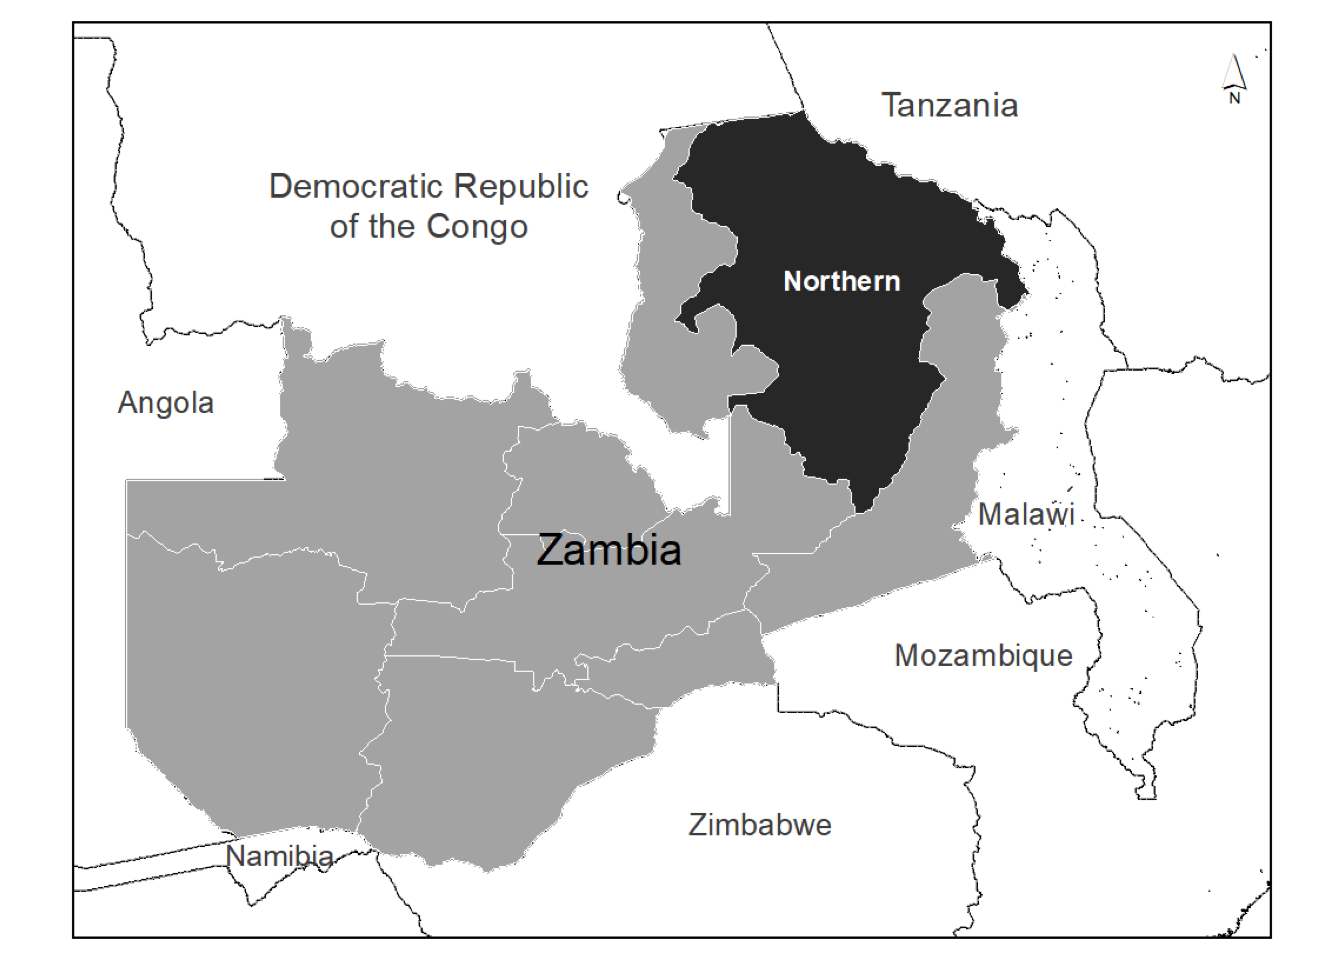
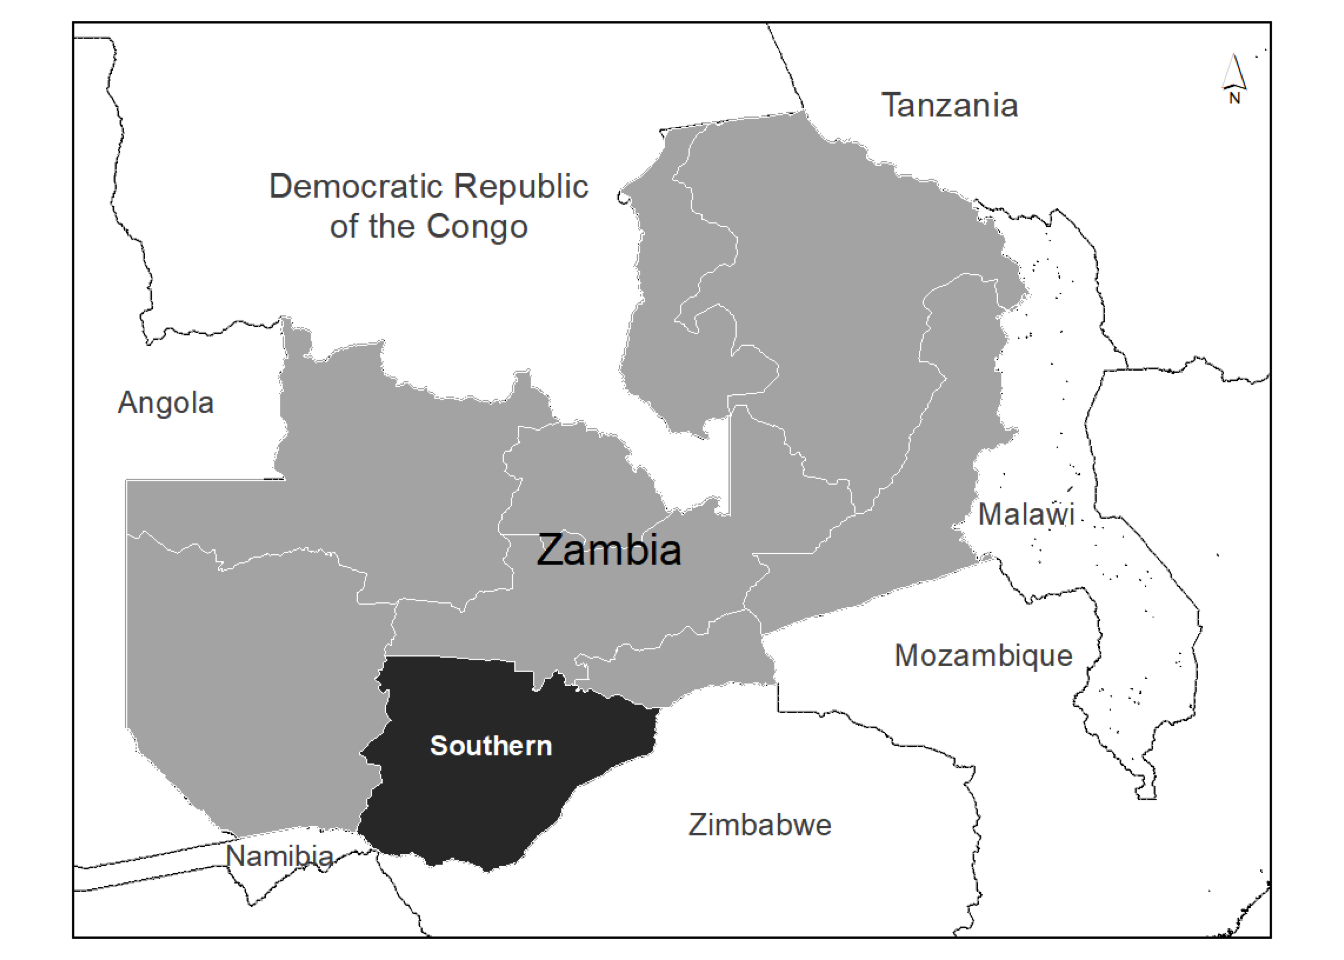
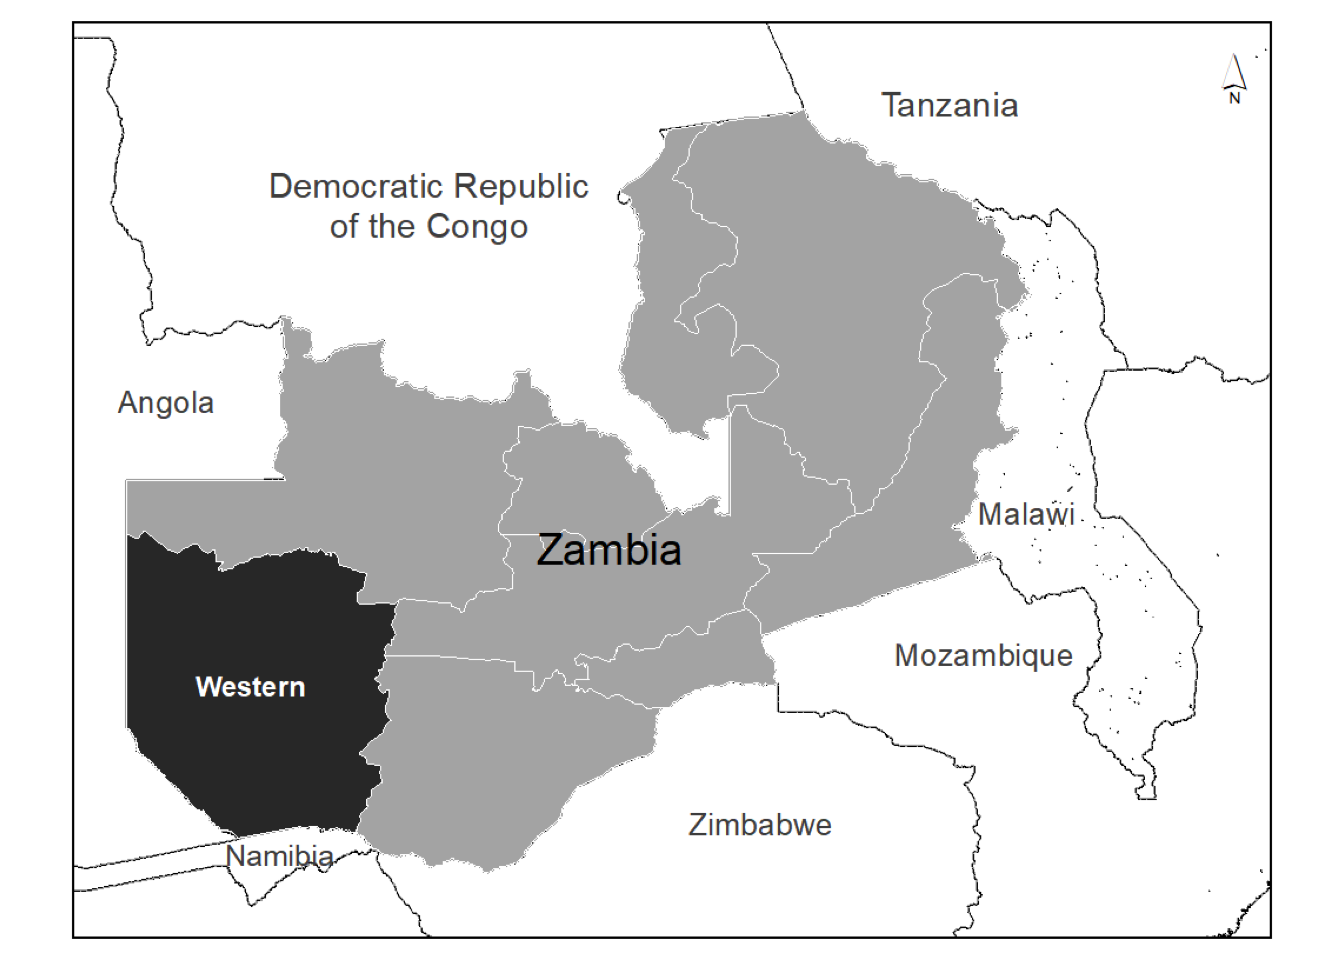
- a map of the country, with the sub-national area highlighted in cases where there are multiple crop calendars per country (due to variation in timing by area);
- a legend listing the different containment scenarios included in the LSHTM model.
Scenario descriptions
In the LSHTM model, the researchers identify an unmitigated scenario (i.e. the government takes no action to contain the spread of COVID-19), as well as a variety of different containment scenarios. They model the impacts and timing of the spread of COVID-19 for each scenario, as a way to estimate which approach could have the largest impact on reducing and/or delaying the cases, deaths, and other effects of COVID-19.
The ten containment scenarios involve social distancing, shielding, and/or a combination of these strategies. The different strategies and selected scenarios are described below:
Greenzone shielding (GZ) was implemented in the model by stratifying the population in one shielded and one unshielded compartment. The GZ applies to those aged 60+ years. We assume shielding of this population has a coverage fraction, and reduction fraction; we refer to GZ interventions by coverage / reduction, so “80C80R shielding” is 80% coverage with 80% contact reduction to the shielded group.
Basic Public Health & Social Measures (PHSM) was implemented as a 20% reduction in general contacts outside the home and a 25% reduction in transmission from symptomatic individuals corresponding to symptomatic people being encouraged to self isolate.
| Scenario Abbreviation | Scenario Name | Description |
|---|---|---|
| Unmitigated | Unmitigated | No restrictions, business as usual |
| 20% distancing | 20% distancing | 20% of population social distancing |
| 60% distancing | 60% distancing | 60% of population social distancing |
| 40% in-home | 40% in-home elder shielding | 40% of elder population shielding |
| 40C-80R GZ | 40% shielding, 80% reduction | 40% of elder population shielding, with 80% reduction in contacts for this group |
| 60C-60R GZ | 60% shielding, 60% reduction | 60% of elder population shielding, with 60% reduction in contacts for this group |
| 80C-80R GZ | 80% shielding, 80% reduction | 80% of elder population shielding, with 80% reduction in contacts for this group |
| basic PHSM | PHSM, school closure, lockdowns | Basic Public Health & Social Measures (PHSM), school closure, intermittent +40% lockdown |
| 30 day 50% | 30 day 50% lockdown, PHSM | 30 day 50% lockdown then basic PHSM as described above |
| 60 day 50% | 60 day 50% lockdown, PHSM | 60 day 50% lockdown then basic PHSM as described above |
| 90 day 50% | 90 day 50% lockdown, PHSM | 90 day 50% lockdown then basic PHSM as described above |
Caveats/Notes
- These are projections based on a model with documented assumptions. That model will be updated as the LSHTM gathers more information, as noted here.
- As noted above, the ‘Day 0’ used for the graphs here is an estimation of when a country reached a date with 50 active infections.
- The quality of COVID-19-related data that is available for LMICs is variable and this likely impacts the accuracy of modeling.
- A number of COVID-19 modeling efforts are underway. The use of the LSHTM modeling for this analysis does not imply USAID endorsement of this approach over others.
- The crop calendars do not include all crops grown in the country, nor all those that are important as a food source or for income generation.
- Maps, area names, and borders do not necessarily reflect the concurrence of the US Government.
Argentina
Benin
Brazil
Burkina Faso
Cameroon

Central African Republic


Chad


Chile

Congo (Kinshasa)
Cote d’Ivoire
Ethiopia


Ghana
Guinea


Honduras
India
Kenya

Liberia
Madagascar

Mali


Mexico
Morocco


Mozambique


Nigeria

Paraguay
Senegal


South Sudan


Tanzania

Togo

Turkey
Uganda


Zambia


Back to overview
Data sources
- Model projections of COVID-19 cases and deaths over time: Centre for the Mathematical Modelling of Infectious Diseases (CMMID) at the London School of Hygiene & Tropical Medicine (LSHTM); https://cmmid.github.io/topics/covid19/LMIC-projection-reports.html
- Crop calendars: Crop Monitor initiative from Group on Earth Observations Global Agricultural Monitoring Initiative (GEOGLAM); https://cropmonitor.org/index.php/eodatatools/baseline-data/.
- GEOGLAM major crop type areas are based on the IFPRI/IIASA SPAM 2005 beta release (2013), USDA/NASS 2013 CDL, 2013 AAFC Annual Crop Inventory Map, GLAM/UMD, GLAD/UMD, Australian Land Use and Management Classification (Version 7), SIAP, ARC, and JRC. Country administrative boundaries are from GADM version 4 (https://gadm.org/data.html). Names and boundaries are not necessarily authoritative.
- Prepared by the Data, Monitoring, and Analytics Team at USAID/Bureau for Resilience and Food Security; https://www.usaid.gov/who-we-are/organization/bureaus/bureau-resilience-and-food-security. For questions on this analysis, please contact chillbruner@usaid.gov.
Citation and license
To cite this work, please use:
- USAID / Bureau for Resilience and Food Security, Data, Monitoring, and Analytics Team. “COVID-19 Modeling and the Crop Cycle”. 2020. With data from the London School of Hygiene & Tropical Medicine Centre for the Mathematical Modelling of Infectious Diseases (LSHTM/CMMID) and from the Crop Monitor Initiative of the Group on Earth Observations Global Agricultural Monitoring Initiative (GEOGLAM). https://paultanger.github.io/COVID_LIC/. Accessed 22 June 2020, 15:14:17 MDT.
This work is licensed under a Creative Commons Attribution 4.0 International License.